
Do you live in one of the most miserable places in Arizona?
Only a third of Arizonans say they are truly happy. That’s too bad, considering that folks in Arizona don’t really have it too bad in the grand scheme of things.
But, we were curious – which Arizona cities might be the most miserable? We’re about to find out, using Saturday Night Science and data.
After analyzing the 55 largest cities, we sadly present the most miserable cities in the Grand Canyon State.
Table Of Contents: Top Ten | Methodology | Summary | Table
The 10 Most Miserable Places In Arizona
Read on below to see how we crunched the numbers and how your town ranked. If you have a smile on your face, you probably don’t live in one of these cities.
Oh, and by the way, Wickenburg is the happiest place in Arizona.
For more Arizona reading, check out:
The 10 Most Miserable Places In Arizona For 2023
/10
Population: 35,289
Poverty Level: 25.1%
Median Home Price $146,800
Married Households 6.0%
Households With Kids 57.33%
More on San Luis: Data | Crime | Cost Of Living
/10
Population: 35,410
Poverty Level: 14.6%
Median Home Price $204,700
Married Households 8.0%
Households With Kids 45.64%
More on El Mirage: Data | Crime | Cost Of Living
/10
Population: 25,356
Poverty Level: 10.9%
Median Home Price $210,000
Married Households 6.0%
Households With Kids 20.07%
More on Florence: Data | Crime | Cost Of Living
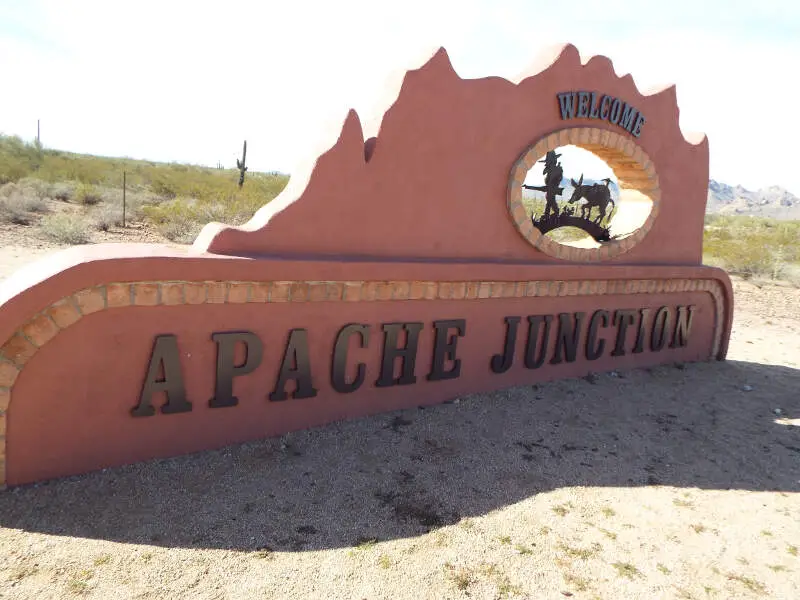
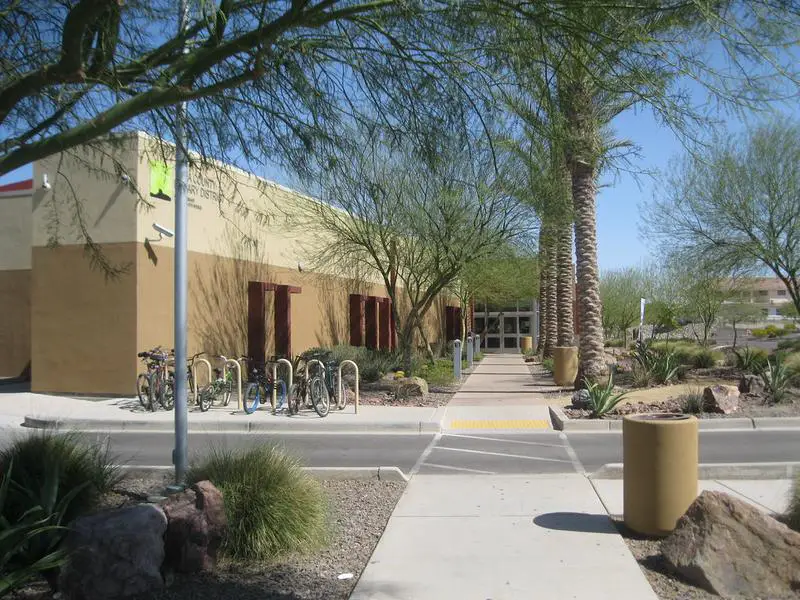
/10
Population: 38,311
Poverty Level: 12.7%
Median Home Price $145,700
Married Households 7.0%
Households With Kids 20.15%
More on Apache Junction: Data | Crime | Cost Of Living
/10
Population: 15,171
Poverty Level: 23.5%
Median Home Price $137,600
Married Households 6.0%
Households With Kids 34.79%
More on Eloy: Data | Cost Of Living
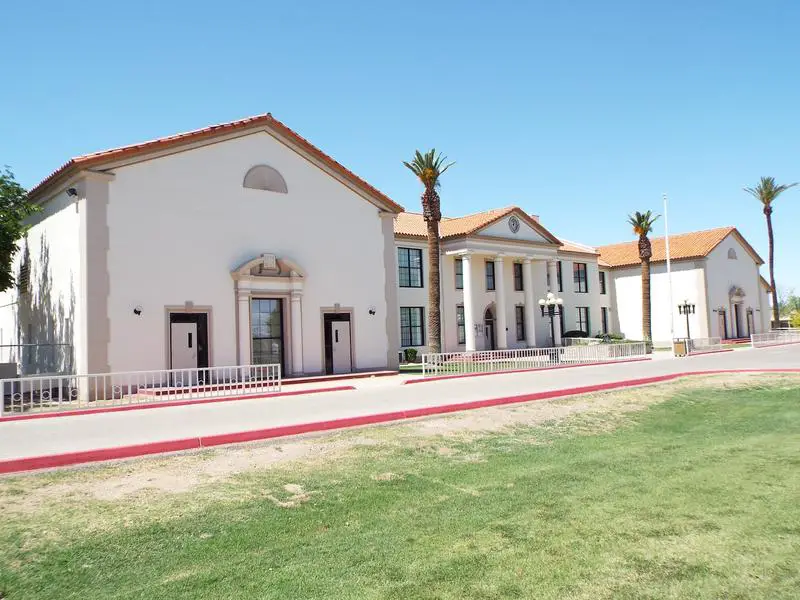
/10
Population: 14,126
Poverty Level: 19.6%
Median Home Price $155,900
Married Households 10.0%
Households With Kids 46.09%
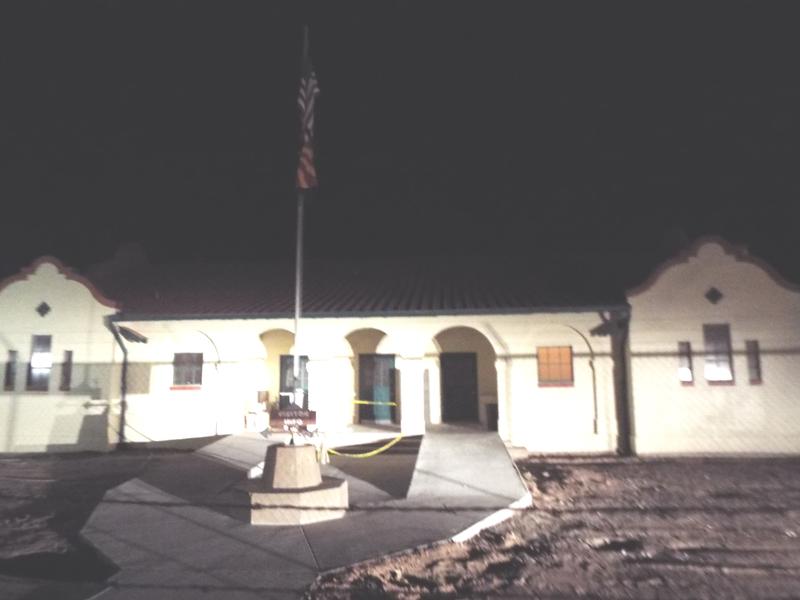
More on Somerton: Data | Crime | Cost Of Living
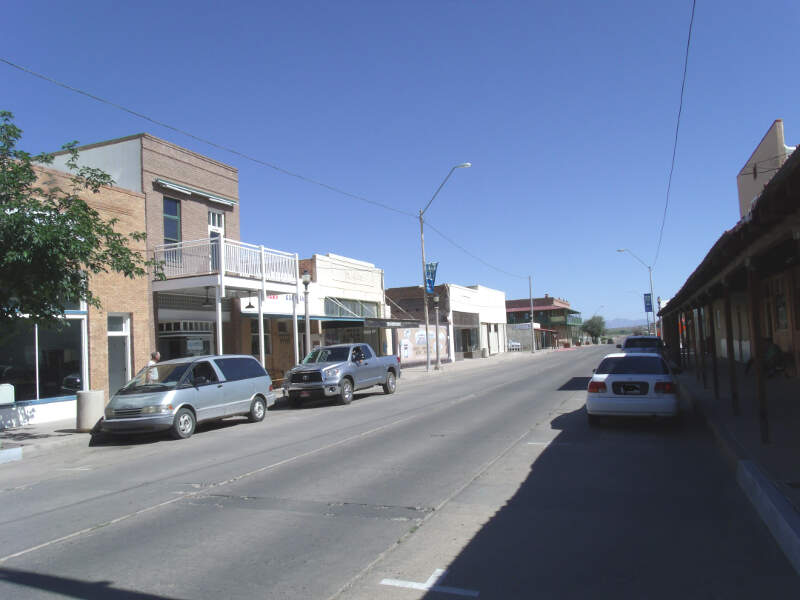
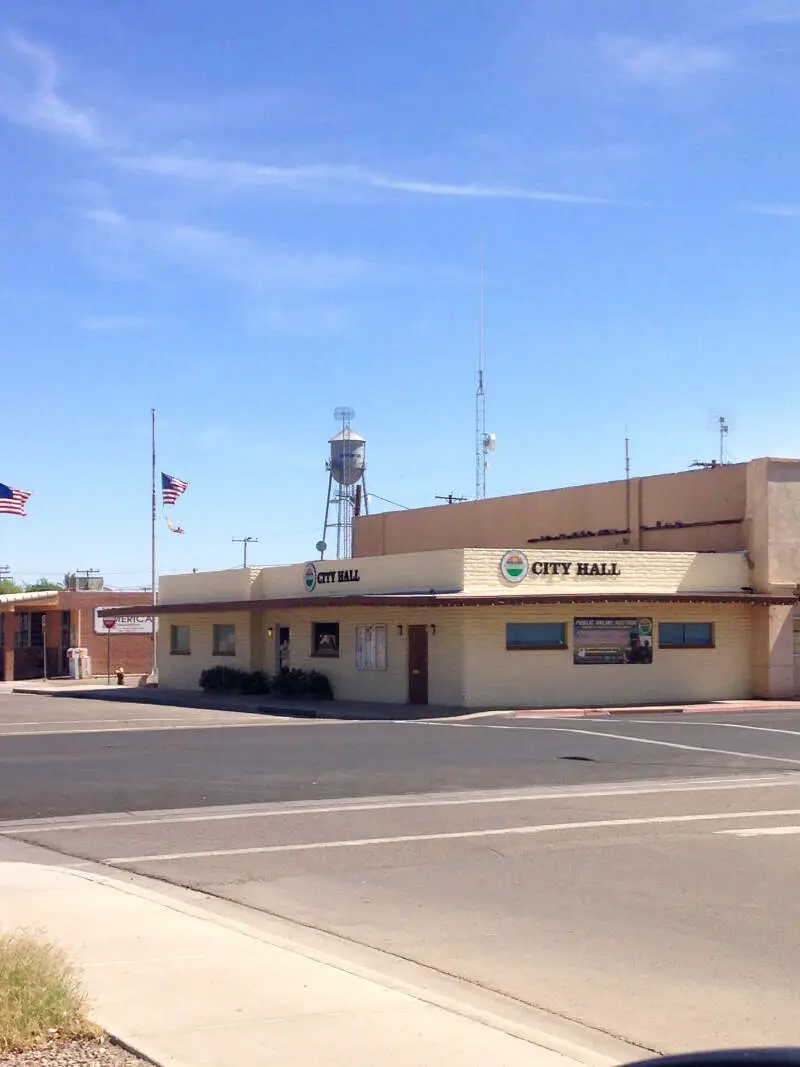
/10
Population: 13,347
Poverty Level: 18.0%
Median Home Price $127,700
Married Households 16.0%
Households With Kids 39.55%
More on Coolidge: Data | Crime | Cost Of Living
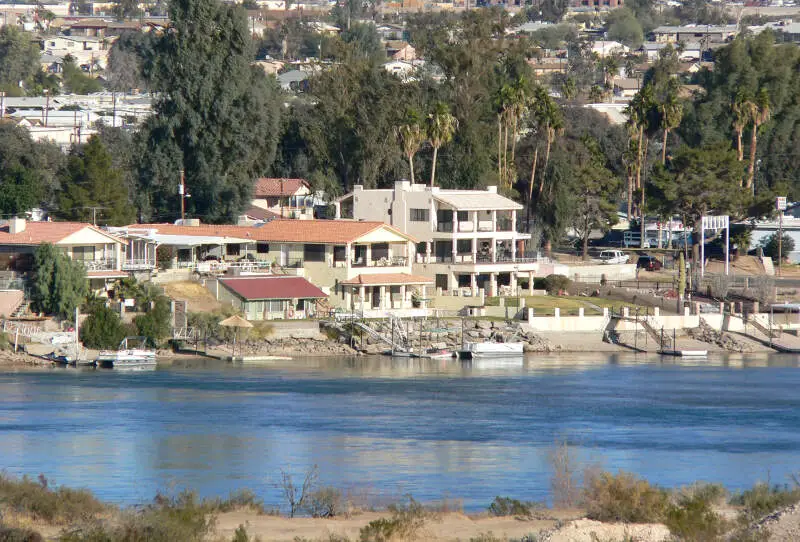
/10
Population: 41,064
Poverty Level: 19.9%
Median Home Price $159,600
Married Households 2.0%
Households With Kids 23.12%
More on Bullhead City: Data | Crime | Cost Of Living
/10
Population: 88,065
Poverty Level: 11.6%
Median Home Price $252,400
Married Households 10.0%
Households With Kids 44.78%
More on Avondale: Data | Crime | Cost Of Living
/10
Population: 57,075
Poverty Level: 6.9%
Median Home Price $235,000
Married Households 10.0%
Households With Kids 41.78%
More on Maricopa: Data | Crime | Cost Of Living
Methodology: How We Measured The Most Miserable Cities In The Grand Canyon State
To rank the unhappiest places in Arizona, we had to determine what criteria make people happy. It isn’t a stretch to assume that happy people earn great salaries, are relatively stress-free, and have a stable home life.
So we went to the Census’s American Community Survey 2017-2021 report for the happy criteria, flipped the list with Saturday Night Science, and it spit out the answer.
Like magic.
Here are the criteria we used to measure misery:
- Percentage of residents with a college degree
- Average commute times
- Unemployment rates
- Cost of living
- % of married couples
- % of families with kids
- Poverty rate
After we decided on the criteria, we gathered the data for the 55 places in Arizona with over 5,000 people.
We then ranked each place from one to 55 for each of the seven criteria, with a score of one being the most miserable (Any ties were given to the larger place).
Next, we averaged the seven rankings into a Miserable Index for each place with the lowest overall Miserable Index “earning” the title “Most Miserable City In Arizona.”
If you’d like to see the complete list of states, most miserable to happiest, scroll to the bottom of this post to see the unabridged chart.
We updated this article for 2023, and it’s our tenth time ranking the most miserable cities in Arizona.
There You Have It – The Least Happy Cities In Arizona
As we said earlier, trying to determine the most miserable cities in Arizona is usually a subjective matter.
But if you’re analyzing cities where people are not stable, where you’re stuck in traffic, and no one spent the time to go to college, then this is an accurate list.
If you’re curious enough, here are the happiest cities in Arizona, according to science:
- Wickenburg
- Cottonwood
- Flagstaff
For more Arizona reading, check out:
- Best Places To Live In Arizona
- Cheapest Places To Live In Arizona
- Most Dangerous Cities In Arizona
- Richest Cities In Arizona
- Safest Places In Arizona
- Worst Places To Live In Arizona
- Most Expensive Places To Live In Arizona
Miserable Cities In Arizona For 2023
| Rank | City | Population | Poverty Level | Median Home Value | % Married | % Kids |
|---|---|---|---|---|---|---|
| 1 | San Luis, AZ | 35,289 | 25.1% | $146,800 | 6.0% | 57.33% |
| 2 | El Mirage, AZ | 35,410 | 14.6% | $204,700 | 8.0% | 45.64% |
| 3 | Florence, AZ | 25,356 | 10.9% | $210,000 | 6.0% | 20.07% |
| 4 | Apache Junction, AZ | 38,311 | 12.7% | $145,700 | 7.0% | 20.15% |
| 5 | Eloy, AZ | 15,171 | 23.5% | $137,600 | 6.0% | 34.79% |
| 6 | Somerton, AZ | 14,126 | 19.6% | $155,900 | 10.0% | 46.09% |
| 7 | Coolidge, AZ | 13,347 | 18.0% | $127,700 | 16.0% | 39.55% |
| 8 | Bullhead City, AZ | 41,064 | 19.9% | $159,600 | 2.0% | 23.12% |
| 9 | Avondale, AZ | 88,065 | 11.6% | $252,400 | 10.0% | 44.78% |
| 10 | Maricopa, AZ | 57,075 | 6.9% | $235,000 | 10.0% | 41.78% |
| 11 | Benson, AZ | 5,252 | 14.0% | $114,400 | 9.0% | 23.15% |
| 12 | Douglas, AZ | 16,470 | 24.8% | $107,300 | 14.0% | 41.27% |
| 13 | Yuma, AZ | 95,154 | 17.1% | $157,300 | 9.0% | 38.56% |
| 14 | Nogales, AZ | 19,829 | 29.8% | $139,300 | 10.0% | 36.41% |
| 15 | Winslow, AZ | 8,961 | 25.4% | $106,400 | 17.0% | 45.33% |
| 16 | Chino Valley, AZ | 12,854 | 5.6% | $264,800 | 10.0% | 21.59% |
| 17 | Goodyear, AZ | 93,651 | 6.4% | $333,900 | 11.0% | 37.33% |
| 18 | Youn, AZ | 6,908 | 14.1% | $196,900 | 9.0% | 36.63% |
| 19 | Casa Grande, AZ | 53,488 | 14.1% | $177,700 | 12.0% | 35.28% |
| 20 | Kingman, AZ | 32,204 | 12.4% | $175,100 | 7.0% | 28.52% |
| 21 | Sahuarita, AZ | 33,524 | 8.9% | $251,800 | 12.0% | 37.23% |
| 22 | Glendale, AZ | 245,685 | 17.3% | $252,200 | 10.0% | 37.14% |
| 23 | Queen Creek, AZ | 57,728 | 4.5% | $407,800 | 13.0% | 44.41% |
| 24 | Surprise, AZ | 141,875 | 7.5% | $282,300 | 9.0% | 33.54% |
| 25 | Sierra Vista, AZ | 44,944 | 11.1% | $182,900 | 6.0% | 30.63% |
| 26 | Tolleson, AZ | 7,180 | 18.4% | $218,600 | 12.0% | 43.32% |
| 27 | Snowflake, AZ | 6,086 | 22.9% | $186,800 | 39.0% | 48.5% |
| 28 | Camp Verde, AZ | 11,942 | 23.6% | $210,400 | 11.0% | 33.32% |
| 29 | Thatcher, AZ | 5,172 | 13.3% | $184,800 | 27.0% | 38.21% |
| 30 | Phoenix, AZ | 1,591,119 | 15.4% | $277,700 | 9.0% | 34.97% |
| 31 | Tucson, AZ | 538,167 | 19.8% | $177,800 | 10.0% | 28.04% |
| 32 | Lake Havasu City, AZ | 56,510 | 11.9% | $297,200 | 3.0% | 17.56% |
| 33 | Fountain Hills, AZ | 23,639 | 5.6% | $449,300 | 4.0% | 13.68% |
| 34 | Gilbert, AZ | 262,249 | 5.4% | $377,800 | 12.0% | 43.94% |
| 35 | Peoria, AZ | 187,733 | 8.4% | $314,000 | 11.0% | 32.57% |
| 36 | Chandler, AZ | 272,439 | 7.5% | $351,600 | 9.0% | 35.75% |
| 37 | Guadalupe, AZ | 5,334 | 34.6% | $172,600 | 29.0% | 37.05% |
| 38 | Marana, AZ | 50,834 | 5.6% | $291,900 | 14.0% | 31.94% |
| 39 | Show Low, AZ | 11,623 | 12.5% | $197,200 | 16.0% | 30.95% |
| 40 | Mesa, AZ | 497,752 | 12.1% | $269,400 | 11.0% | 30.97% |
| 41 | Safford, AZ | 9,981 | 19.5% | $151,300 | 23.0% | 36.17% |
| 42 | Sedona, AZ | 9,723 | 11.3% | $569,800 | 1.0% | 12.69% |
| 43 | Prescott Valley, AZ | 46,014 | 11.6% | $283,700 | 9.0% | 25.37% |
| 44 | Oro Valley, AZ | 46,515 | 6.7% | $348,200 | 9.0% | 20.41% |
| 45 | Page, AZ | 7,466 | 29.3% | $0 | 24.0% | 36.41% |
| 46 | Paradise Valley, AZ | 12,666 | 4.1% | $1,778,000 | 8.0% | 26.7% |
| 47 | Tempe, AZ | 178,862 | 18.2% | $321,300 | 6.0% | 19.2% |
| 48 | Litchfield Park, AZ | 6,656 | 7.1% | $393,900 | 13.0% | 29.76% |
| 49 | Payson, AZ | 16,229 | 9.4% | $272,500 | 13.0% | 18.43% |
| 50 | Scottsdale, AZ | 238,685 | 6.7% | $540,000 | 5.0% | 17.75% |
| 51 | Globe, AZ | 7,185 | 21.1% | $153,400 | 24.0% | 28.06% |
| 52 | Prescott, AZ | 45,063 | 11.2% | $386,300 | 7.0% | 12.59% |
| 53 | Flagstaff, AZ | 76,228 | 17.4% | $388,500 | 9.0% | 25.47% |
| 54 | Cottonwood, AZ | 12,073 | 19.2% | $212,500 | 10.0% | 14.98% |
| 55 | Wickenburg, AZ | 7,359 | 15.2% | $276,700 | 13.0% | 11.91% |
The picture you have for Tucson is from downtown Bisbee.
LOL I thought it was Old Tucson, this is even more hilarious!