
Do you live in one of the most miserable places in Illinois?
Only a third of Illinoisans say they are truly happy. That’s too bad, considering that folks in Illinois don’t really have it too bad in the grand scheme of things.
But, we were curious – which Illinois cities might be the most miserable? We’re about to find out, using Saturday Night Science and data.
After analyzing the 332 largest cities, we sadly present the most miserable cities in the Prairie State.
Table Of Contents: Top Ten | Methodology | Summary | Table
The 10 Most Miserable Places In Illinois
Read on below to see how we crunched the numbers and how your town ranked. If you have a smile on your face, you probably don’t live in one of these cities.
Oh, and by the way, Savoy is the happiest place in Illinois.
For more Illinois reading, check out:
The 10 Most Miserable Places In Illinois For 2023
/10
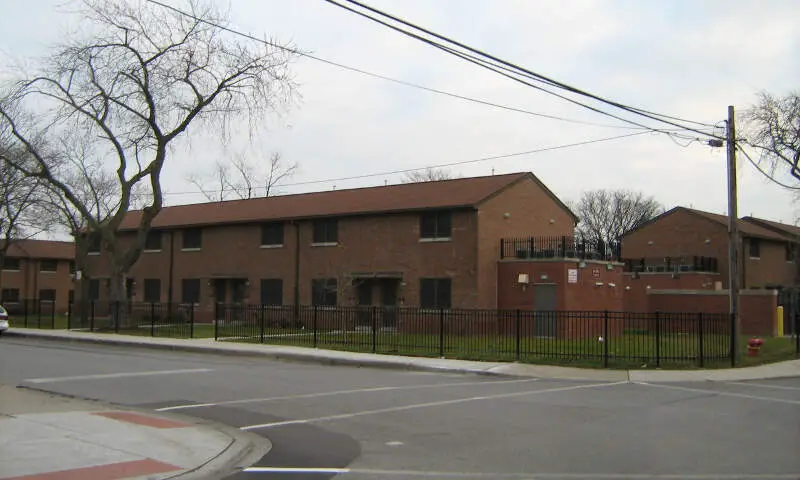
Population: 11,733
Poverty Level: 21.0%
Median Home Price $91,900
Married Households 15.0%
Households With Kids 36.68%
More on Markham: Data | Crime | Cost Of Living

/10
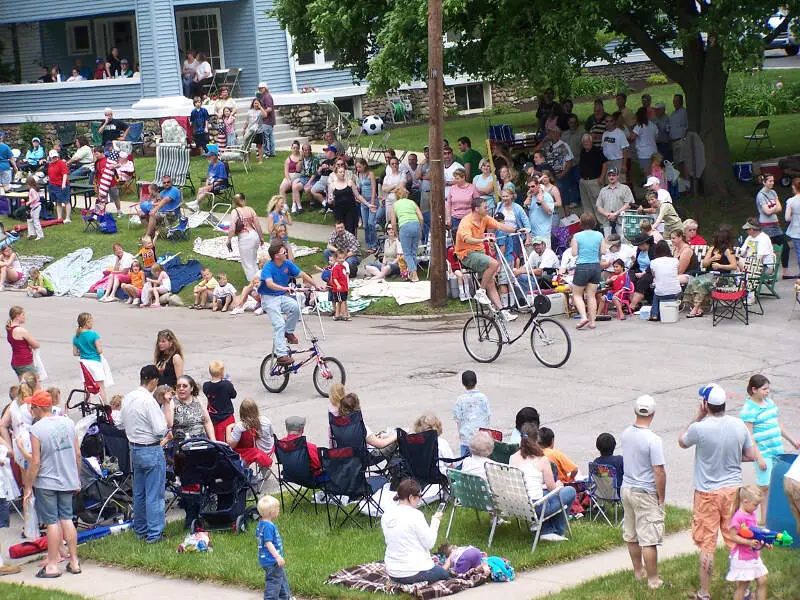
Population: 7,876
Poverty Level: 13.4%
Median Home Price $20,300
Married Households 9.0%
Households With Kids 45.02%
More on Park City: Data | Crime | Cost Of Living
/10
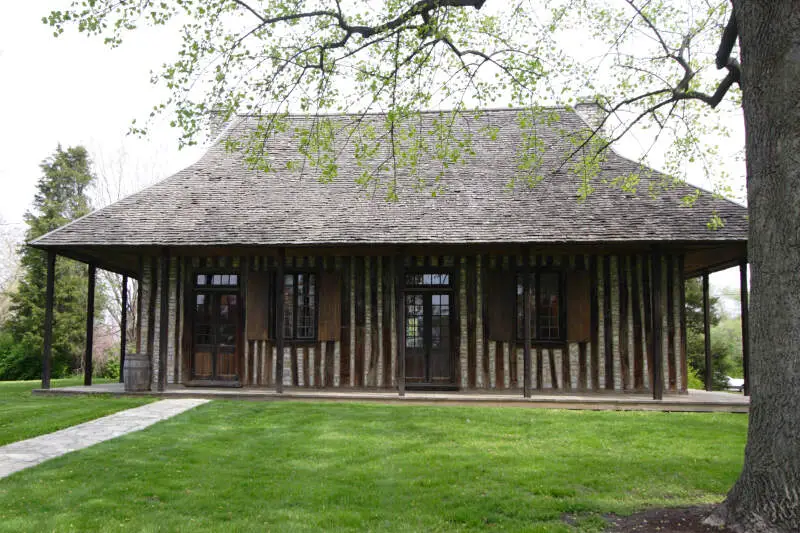
Population: 10,909
Poverty Level: 30.1%
Median Home Price $83,000
Married Households 17.0%
Households With Kids 34.9%
More on Riverdale: Data | Crime | Cost Of Living
/10
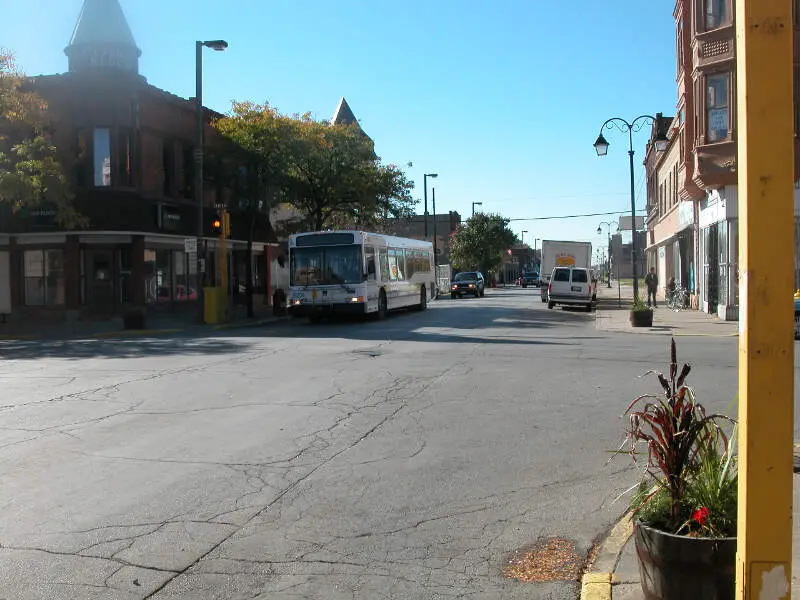
Population: 5,752
Poverty Level: 7.2%
Median Home Price $142,800
Married Households 17.0%
Households With Kids 39.07%
More on Posen: Data | Crime | Cost Of Living
/10
Population: 27,412
Poverty Level: 7.7%
Median Home Price $158,700
Married Households 18.0%
Households With Kids 44.51%
More on Round Lake Beach: Data | Crime | Cost Of Living

/10
Population: 9,981
Poverty Level: 27.6%
Median Home Price $70,300
Married Households 17.0%
Households With Kids 39.2%
More on Sauk Village: Data | Crime | Cost Of Living
/10
Population: 9,482
Poverty Level: 13.5%
Median Home Price $138,200
Married Households 19.0%
Households With Kids 48.68%
More on Harvard: Data | Crime | Cost Of Living
/10
Population: 12,440
Poverty Level: 35.4%
Median Home Price $40,900
Married Households 11.0%
Households With Kids 38.88%
More on Cahokia: Data | Crime | Cost Of Living
/10
Population: 20,751
Poverty Level: 28.5%
Median Home Price $75,700
Married Households 16.0%
Households With Kids 33.6%
More on Harvey: Data | Cost Of Living
/10
Population: 7,167
Poverty Level: 14.1%
Median Home Price $118,600
Married Households 21.0%
Households With Kids 34.69%
More on Calumet Park: Data | Cost Of Living
Methodology: How We Measured The Most Miserable Cities In The Prairie State
To rank the unhappiest places in Illinois, we had to determine what criteria make people happy. It isn’t a stretch to assume that happy people earn great salaries, are relatively stress-free, and have a stable home life.
So we went to the Census’s American Community Survey 2017-2021 report for the happy criteria, flipped the list with Saturday Night Science, and it spit out the answer.
Like magic.
Here are the criteria we used to measure misery:
- Percentage of residents with a college degree
- Average commute times
- Unemployment rates
- Cost of living
- % of married couples
- % of families with kids
- Poverty rate
After we decided on the criteria, we gathered the data for the 332 places in Illinois with over 5,000 people.
We then ranked each place from one to 332 for each of the seven criteria, with a score of one being the most miserable (Any ties were given to the larger place).
Next, we averaged the seven rankings into a Miserable Index for each place with the lowest overall Miserable Index “earning” the title “Most Miserable City In Illinois.”
If you’d like to see the complete list of states, most miserable to happiest, scroll to the bottom of this post to see the unabridged chart.
We updated this article for 2023, and it’s our tenth time ranking the most miserable cities in Illinois.
There You Have It – The Least Happy Cities In Illinois
As we said earlier, trying to determine the most miserable cities in Illinois is usually a subjective matter.
But if you’re analyzing cities where people are not stable, where you’re stuck in traffic, and no one spent the time to go to college, then this is an accurate list.
If you’re curious enough, here are the happiest cities in Illinois, according to science:
- Savoy
- Normal
- Palos Heights
For more Illinois reading, check out:
- Best Places To Live In Illinois
- Cheapest Places To Live In Illinois
- Most Dangerous Cities In Illinois
- Richest Cities In Illinois
- Safest Places In Illinois
- Worst Places To Live In Illinois
- Most Expensive Places To Live In Illinois
Miserable Cities In Illinois For 2023
| Rank | City | Population | Poverty Level | Median Home Value | % Married | % Kids |
|---|---|---|---|---|---|---|
| 1 | Markham, IL | 11,733 | 21.0% | $91,900 | 15.0% | 36.68% |
| 2 | Park City, IL | 7,876 | 13.4% | $20,300 | 9.0% | 45.02% |
| 3 | Riverdale, IL | 10,909 | 30.1% | $83,000 | 17.0% | 34.9% |
| 4 | Posen, IL | 5,752 | 7.2% | $142,800 | 17.0% | 39.07% |
| 5 | Round Lake Beach, IL | 27,412 | 7.7% | $158,700 | 18.0% | 44.51% |
| 6 | Sauk Village, IL | 9,981 | 27.6% | $70,300 | 17.0% | 39.2% |
| 7 | Harvard, IL | 9,482 | 13.5% | $138,200 | 19.0% | 48.68% |
| 8 | Cahokia, IL | 12,440 | 35.4% | $40,900 | 11.0% | 38.88% |
| 9 | Harvey, IL | 20,751 | 28.5% | $75,700 | 16.0% | 33.6% |
| 10 | Calumet Park, IL | 7,167 | 14.1% | $118,600 | 21.0% | 34.69% |
| 11 | Summit, IL | 11,098 | 13.8% | $192,800 | 9.0% | 41.98% |
| 12 | Hazel Crest, IL | 13,727 | 18.0% | $132,700 | 18.0% | 40.28% |
| 13 | University Park, IL | 7,239 | 10.1% | $127,000 | 23.0% | 48.9% |
| 14 | Zion, IL | 24,660 | 14.9% | $144,600 | 16.0% | 38.81% |
| 15 | Carpentersville, IL | 37,940 | 11.0% | $184,500 | 16.0% | 46.68% |
| 16 | Burbank, IL | 29,312 | 11.1% | $215,800 | 21.0% | 35.83% |
| 17 | Calumet City, IL | 36,065 | 21.5% | $110,600 | 18.0% | 30.46% |
| 18 | Beach Park, IL | 13,634 | 7.9% | $173,700 | 25.0% | 38.92% |
| 19 | Plano, IL | 10,885 | 8.4% | $173,300 | 26.0% | 37.6% |
| 20 | Maywood, IL | 23,547 | 14.7% | $166,500 | 16.0% | 31.11% |
| 21 | Bellwood, IL | 18,778 | 10.2% | $174,500 | 20.0% | 35.77% |
| 22 | Dolton, IL | 21,588 | 19.6% | $113,600 | 18.0% | 28.63% |
| 23 | Broadview, IL | 7,997 | 11.7% | $177,800 | 22.0% | 31.61% |
| 24 | Cicero, IL | 84,905 | 13.6% | $190,500 | 9.0% | 44.71% |
| 25 | Park Forest, IL | 21,368 | 15.0% | $77,600 | 21.0% | 32.51% |
| 26 | Chicago Heights, IL | 27,840 | 22.8% | $111,900 | 16.0% | 34.56% |
| 27 | Blue Island, IL | 22,934 | 18.3% | $136,900 | 16.0% | 30.35% |
| 28 | Romeoville, IL | 40,099 | 6.6% | $201,300 | 25.0% | 39.83% |
| 29 | Melrose Park, IL | 25,417 | 12.8% | $222,700 | 12.0% | 42.13% |
| 30 | Lansing, IL | 28,916 | 15.4% | $136,100 | 22.0% | 31.64% |
| 31 | Country Club Hills, IL | 16,746 | 10.5% | $139,800 | 22.0% | 28.13% |
| 32 | Waukegan, IL | 89,751 | 15.1% | $146,900 | 11.0% | 37.07% |
| 33 | South Holland, IL | 21,524 | 13.6% | $161,200 | 29.0% | 31.44% |
| 34 | Richton Park, IL | 12,867 | 10.9% | $165,700 | 23.0% | 25.57% |
| 35 | Round Lake Park, IL | 7,559 | 9.4% | $125,000 | 23.0% | 19.91% |
| 36 | Round Lake, IL | 18,720 | 8.6% | $228,200 | 20.0% | 43.03% |
| 37 | Beardstown, IL | 5,839 | 18.8% | $71,100 | 19.0% | 32.01% |
| 38 | Berwyn, IL | 56,960 | 11.6% | $244,500 | 16.0% | 38.73% |
| 39 | Lynwood, IL | 9,095 | 6.5% | $160,200 | 34.0% | 37.34% |
| 40 | Genoa, IL | 5,139 | 5.9% | $166,800 | 34.0% | 31.58% |
| 41 | Kankakee, IL | 24,903 | 28.2% | $89,700 | 19.0% | 32.76% |
| 42 | Justice, IL | 12,625 | 23.6% | $194,900 | 17.0% | 31.97% |
| 43 | Norridge, IL | 15,294 | 3.1% | $313,900 | 20.0% | 25.7% |
| 44 | Belvidere, IL | 25,179 | 14.4% | $120,900 | 23.0% | 33.46% |
| 45 | Lake Villa, IL | 8,741 | 3.1% | $279,400 | 30.0% | 42.04% |
| 46 | Montgomery, IL | 20,084 | 9.7% | $234,000 | 32.0% | 47.1% |
| 47 | Aurora, IL | 183,447 | 10.3% | $208,500 | 18.0% | 43.79% |
| 48 | Island Lake, IL | 8,057 | 8.9% | $196,400 | 27.0% | 32.26% |
| 49 | West Chicago, IL | 25,881 | 11.3% | $254,700 | 19.0% | 42.67% |
| 50 | Northlake, IL | 12,836 | 12.1% | $201,900 | 13.0% | 31.18% |
| 51 | East St. Louis, IL | 19,437 | 29.3% | $57,800 | 7.0% | 21.85% |
| 52 | Spring Grove, IL | 5,713 | 1.2% | $321,200 | 54.0% | 47.86% |
| 53 | Elgin, IL | 114,156 | 9.5% | $206,800 | 21.0% | 37.73% |
| 54 | Glenwood, IL | 8,590 | 11.6% | $143,700 | 24.0% | 25.44% |
| 55 | Elmwood Park, IL | 24,517 | 5.5% | $278,300 | 23.0% | 30.29% |
| 56 | Bridgeview, IL | 16,883 | 14.9% | $202,400 | 19.0% | 28.99% |
| 57 | Joliet, IL | 150,323 | 10.7% | $204,800 | 27.0% | 41.98% |
| 58 | Lyons, IL | 10,665 | 8.6% | $195,400 | 25.0% | 33.18% |
| 59 | Channahon, IL | 13,694 | 3.8% | $247,800 | 52.0% | 42.88% |
| 60 | Hanover Park, IL | 37,545 | 13.9% | $215,900 | 18.0% | 42.44% |
| 61 | Monmouth, IL | 8,810 | 15.7% | $77,800 | 20.0% | 31.72% |
| 62 | Alsip, IL | 19,036 | 8.2% | $172,000 | 33.0% | 30.58% |
| 63 | River Grove, IL | 10,571 | 10.9% | $216,800 | 23.0% | 32.96% |
| 64 | Lake In The Hills, IL | 29,024 | 3.1% | $247,400 | 34.0% | 43.2% |
| 65 | North Chicago, IL | 30,619 | 21.4% | $117,300 | 6.0% | 34.93% |
| 66 | Lindenhurst, IL | 14,453 | 4.5% | $228,300 | 34.0% | 41.92% |
| 67 | Franklin Park, IL | 18,435 | 12.7% | $220,800 | 18.0% | 36.65% |
| 68 | South Beloit, IL | 7,943 | 10.9% | $128,400 | 21.0% | 32.25% |
| 69 | Stickney, IL | 7,074 | 8.6% | $195,200 | 25.0% | 36.71% |
| 70 | Antioch, IL | 14,705 | 8.8% | $245,100 | 33.0% | 41.71% |
| 71 | Rochelle, IL | 9,380 | 9.0% | $128,200 | 22.0% | 24.89% |
| 72 | Harrisburg, IL | 8,375 | 21.4% | $75,600 | 27.0% | 33.42% |
| 73 | Volo, IL | 5,929 | 1.5% | $216,400 | 33.0% | 46.85% |
| 74 | Bolingbrook, IL | 73,807 | 7.9% | $242,600 | 25.0% | 39.51% |
| 75 | Wood Dale, IL | 14,034 | 5.2% | $247,500 | 26.0% | 30.84% |
| 76 | Yorkville, IL | 20,503 | 2.7% | $261,000 | 42.0% | 45.23% |
| 77 | Marengo, IL | 7,466 | 17.8% | $172,800 | 30.0% | 40.07% |
| 78 | Mendota, IL | 6,996 | 9.2% | $104,600 | 33.0% | 33.46% |
| 79 | Hillside, IL | 8,286 | 6.0% | $196,600 | 19.0% | 19.72% |
| 80 | Steger, IL | 9,568 | 13.1% | $108,800 | 32.0% | 30.13% |
| 81 | Minooka, IL | 12,412 | 3.1% | $234,500 | 45.0% | 52.01% |
| 82 | Hickory Hills, IL | 14,483 | 9.6% | $247,400 | 19.0% | 32.48% |
| 83 | Harwood Heights, IL | 8,978 | 8.7% | $297,000 | 19.0% | 34.58% |
| 84 | East Moline, IL | 21,181 | 14.0% | $117,600 | 24.0% | 33.5% |
| 85 | Colona, IL | 5,339 | 4.1% | $130,000 | 35.0% | 35.04% |
| 86 | Rantoul, IL | 12,766 | 19.3% | $89,700 | 18.0% | 30.24% |
| 87 | Alton, IL | 25,902 | 24.4% | $82,000 | 22.0% | 29.95% |
| 88 | Flossmoor, IL | 9,868 | 7.9% | $258,300 | 35.0% | 38.56% |
| 89 | Bradley, IL | 15,236 | 9.1% | $139,000 | 32.0% | 33.68% |
| 90 | Worth, IL | 10,909 | 16.0% | $184,000 | 29.0% | 29.6% |
| 91 | Olney, IL | 8,996 | 17.2% | $82,900 | 30.0% | 34.38% |
| 92 | Manhattan, IL | 9,366 | 3.4% | $258,600 | 53.0% | 48.99% |
| 93 | Streamwood, IL | 39,736 | 7.8% | $216,400 | 19.0% | 34.91% |
| 94 | Plainfield, IL | 44,296 | 2.3% | $330,600 | 34.0% | 51.01% |
| 95 | Crete, IL | 8,425 | 5.3% | $172,700 | 33.0% | 22.36% |
| 96 | Rockford, IL | 148,942 | 22.0% | $97,500 | 20.0% | 29.4% |
| 97 | Glendale Heights, IL | 33,443 | 9.6% | $208,700 | 16.0% | 35.05% |
| 98 | Bensenville, IL | 18,801 | 8.9% | $227,000 | 22.0% | 33.78% |
| 99 | West Frankfort, IL | 7,299 | 33.6% | $68,600 | 36.0% | 31.44% |
| 100 | Mascoutah, IL | 8,803 | 9.7% | $178,800 | 23.0% | 37.57% |
In my eyes, Kewanee is the worst place in Illinois. Not much work and surrounded by drugs. Not only does the town suck so does the county.
Very interesting