
Do you live in one of the most miserable places in Mississippi?
Only a third of Mississippians say they are truly happy. That’s too bad, considering that folks in Mississippi don’t really have it too bad in the grand scheme of things.
But, we were curious – which Mississippi cities might be the most miserable? We’re about to find out, using Saturday Night Science and data.
After analyzing the 63 largest cities, we sadly present the most miserable cities in the Magnolia State.
Table Of Contents: Top Ten | Methodology | Summary | Table
The 10 Most Miserable Places In Mississippi
Read on below to see how we crunched the numbers and how your town ranked. If you have a smile on your face, you probably don’t live in one of these cities.
Oh, and by the way, Starkville is the happiest place in Mississippi.
For more Mississippi reading, check out:
The 10 Most Miserable Places In Mississippi For 2023

/10
Population: 10,887
Poverty Level: 39.1%
Median Home Price $66,400
Married Households 10.0%
Households With Kids 36.15%
More on Yazoo City: Data | Cost Of Living
/10
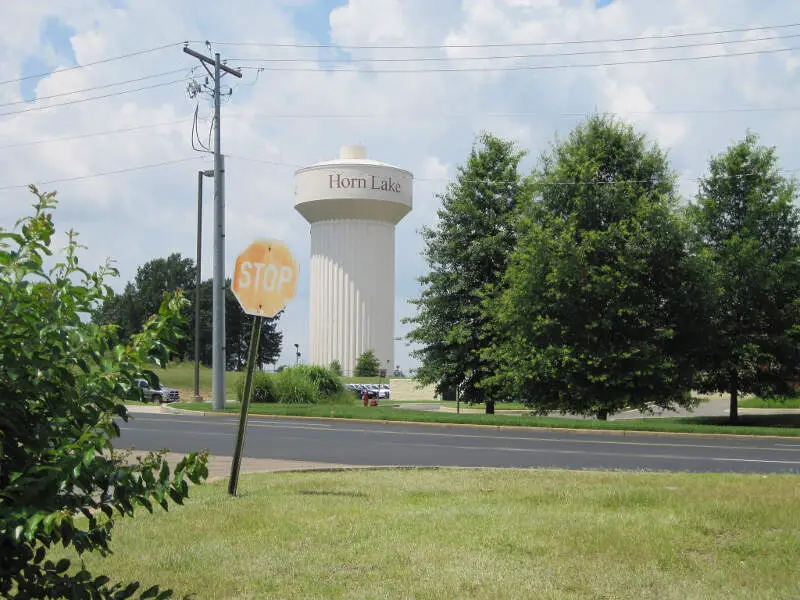
Population: 26,623
Poverty Level: 14.6%
Median Home Price $117,900
Married Households 15.0%
Households With Kids 37.15%
More on Horn Lake: Data | Crime | Cost Of Living
/10
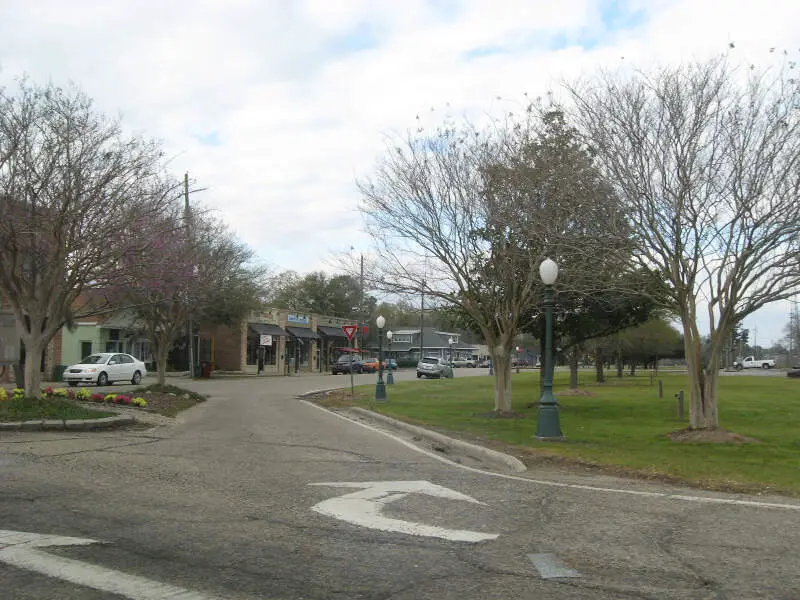
Population: 11,777
Poverty Level: 26.5%
Median Home Price $117,000
Married Households 13.0%
Households With Kids 32.79%
More on Picayune: Data | Cost Of Living
/10
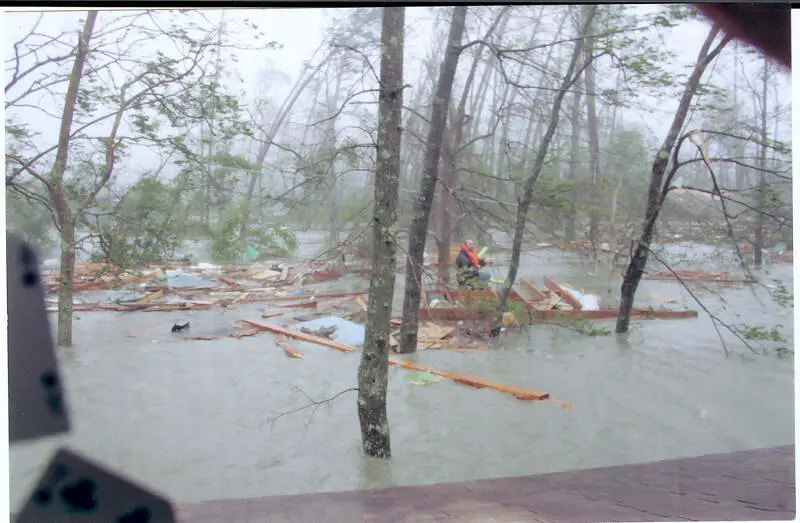
Population: 7,063
Poverty Level: 15.4%
Median Home Price $164,200
Married Households 16.0%
Households With Kids 45.59%
More on Waveland: Data | Crime | Cost Of Living
/10
Population: 5,598
Poverty Level: 27.4%
Median Home Price $95,600
Married Households 15.0%
Households With Kids 24.9%
More on Leakesville: Data | Cost Of Living
/10
Population: 6,743
Poverty Level: 24.1%
Median Home Price $86,300
Married Households 15.0%
Households With Kids 26.19%
More on Holly Springs: Data | Crime | Cost Of Living
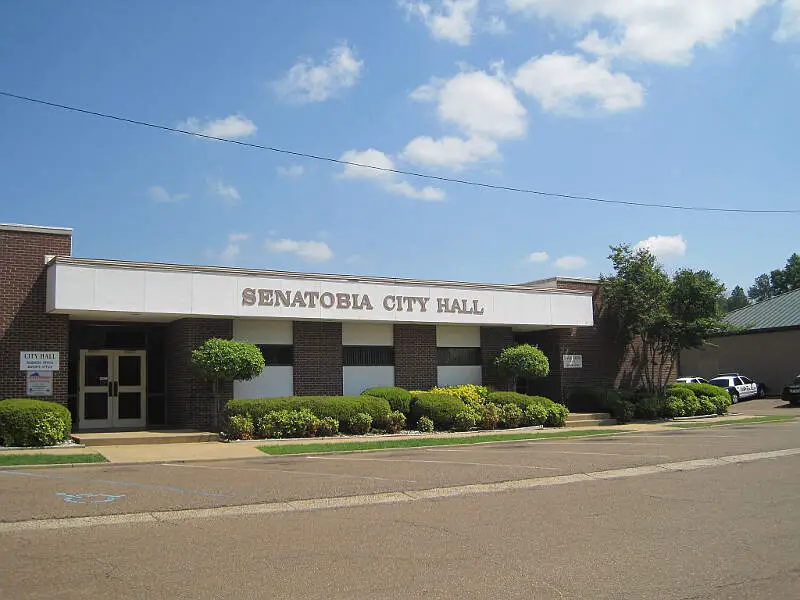
/10
Population: 8,075
Poverty Level: 18.9%
Median Home Price $150,700
Married Households 18.0%
Households With Kids 36.44%
More on Senatobia: Data | Cost Of Living
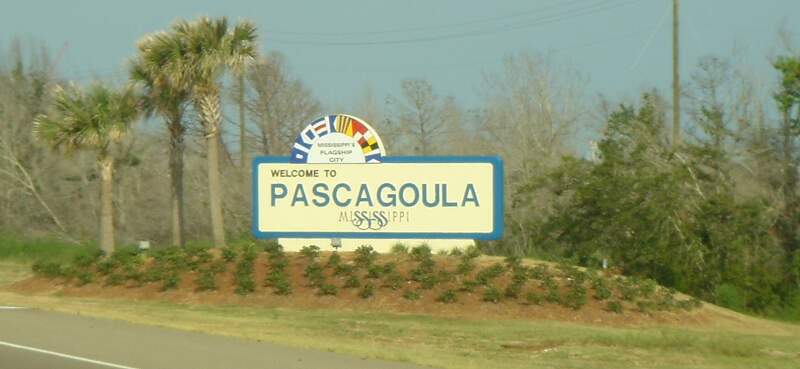
/10
Population: 22,001
Poverty Level: 24.5%
Median Home Price $116,000
Married Households 18.0%
Households With Kids 32.59%
More on Pascagoula: Data | Crime | Cost Of Living
/10
Population: 72,468
Poverty Level: 25.6%
Median Home Price $138,200
Married Households 18.0%
Households With Kids 33.99%
More on Gulfport: Data | Crime | Cost Of Living
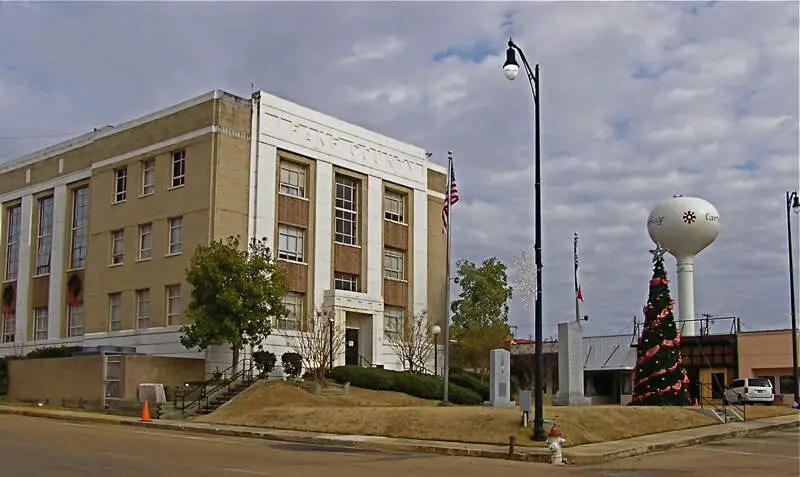
/10
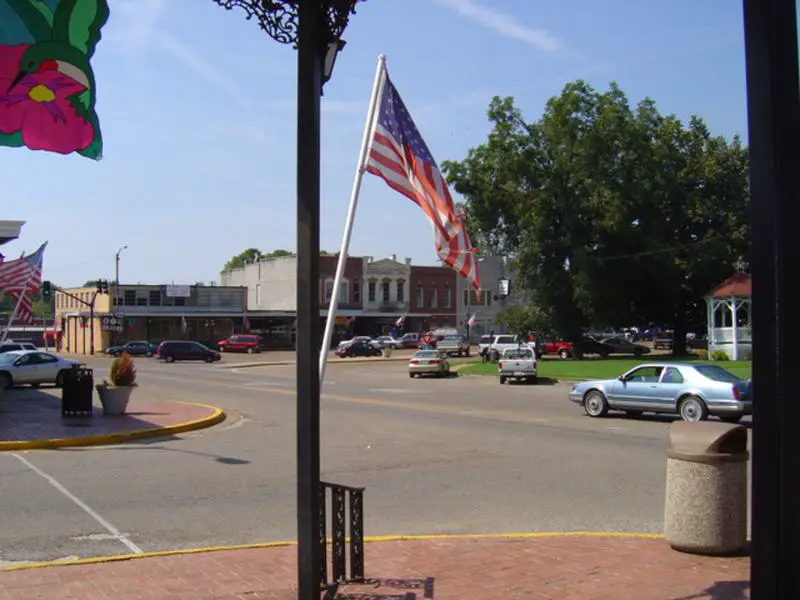
Population: 5,622
Poverty Level: 23.6%
Median Home Price $131,000
Married Households 20.0%
Households With Kids 32.01%
More on Carthage: Data
Methodology: How We Measured The Most Miserable Cities In The Magnolia State
To rank the unhappiest places in Mississippi, we had to determine what criteria make people happy. It isn’t a stretch to assume that happy people earn great salaries, are relatively stress-free, and have a stable home life.
So we went to the Census’s American Community Survey 2017-2021 report for the happy criteria, flipped the list with Saturday Night Science, and it spit out the answer.
Like magic.
Here are the criteria we used to measure misery:
- Percentage of residents with a college degree
- Average commute times
- Unemployment rates
- Cost of living
- % of married couples
- % of families with kids
- Poverty rate
After we decided on the criteria, we gathered the data for the 63 places in Mississippi with over 5,000 people.
We then ranked each place from one to 63 for each of the seven criteria, with a score of one being the most miserable (Any ties were given to the larger place).
Next, we averaged the seven rankings into a Miserable Index for each place with the lowest overall Miserable Index “earning” the title “Most Miserable City In Mississippi.”
If you’d like to see the complete list of states, most miserable to happiest, scroll to the bottom of this post to see the unabridged chart.
We updated this article for 2023, and it’s our tenth time ranking the most miserable cities in Mississippi.
There You Have It – The Least Happy Cities In Mississippi
As we said earlier, trying to determine the most miserable cities in Mississippi is usually a subjective matter.
But if you’re analyzing cities where people are not stable, where you’re stuck in traffic, and no one spent the time to go to college, then this is an accurate list.
If you’re curious enough, here are the happiest cities in Mississippi, according to science:
- Starkville
- Oxford
- Ridgeland
For more Mississippi reading, check out:
- Best Places To Live In Mississippi
- Cheapest Places To Live In Mississippi
- Most Dangerous Cities In Mississippi
- Richest Cities In Mississippi
- Safest Places In Mississippi
- Worst Places To Live In Mississippi
- Most Expensive Places To Live In Mississippi
Miserable Cities In Mississippi For 2023
| Rank | City | Population | Poverty Level | Median Home Value | % Married | % Kids |
|---|---|---|---|---|---|---|
| 1 | Yazoo City, MS | 10,887 | 39.1% | $66,400 | 10.0% | 36.15% |
| 2 | Horn Lake, MS | 26,623 | 14.6% | $117,900 | 15.0% | 37.15% |
| 3 | Picayune, MS | 11,777 | 26.5% | $117,000 | 13.0% | 32.79% |
| 4 | Waveland, MS | 7,063 | 15.4% | $164,200 | 16.0% | 45.59% |
| 5 | Leakesville, MS | 5,598 | 27.4% | $95,600 | 15.0% | 24.9% |
| 6 | Holly Springs, MS | 6,743 | 24.1% | $86,300 | 15.0% | 26.19% |
| 7 | Senatobia, MS | 8,075 | 18.9% | $150,700 | 18.0% | 36.44% |
| 8 | Pascagoula, MS | 22,001 | 24.5% | $116,000 | 18.0% | 32.59% |
| 9 | Gulfport, MS | 72,468 | 25.6% | $138,200 | 18.0% | 33.99% |
| 10 | Carthage, MS | 5,622 | 23.6% | $131,000 | 20.0% | 32.01% |
| 11 | Southaven, MS | 54,141 | 12.1% | $169,800 | 15.0% | 39.46% |
| 12 | Kosciusko, MS | 7,128 | 33.7% | $107,100 | 24.0% | 33.78% |
| 13 | Gautier, MS | 18,932 | 17.9% | $133,600 | 24.0% | 32.9% |
| 14 | Columbia, MS | 5,998 | 34.9% | $85,100 | 18.0% | 20.32% |
| 15 | Forest, MS | 5,464 | 22.6% | $106,600 | 31.0% | 33.58% |
| 16 | Olive Branch, MS | 39,136 | 7.3% | $204,800 | 13.0% | 34.38% |
| 17 | Moss Point, MS | 12,282 | 21.1% | $99,000 | 21.0% | 23.77% |
| 18 | Philadelphia, MS | 7,107 | 30.2% | $94,200 | 29.0% | 30.98% |
| 19 | Long Beach, MS | 16,654 | 9.3% | $165,600 | 16.0% | 31.48% |
| 20 | Biloxi, MS | 49,061 | 14.9% | $168,600 | 15.0% | 30.64% |
| 21 | D’iberville, MS | 12,736 | 21.4% | $161,800 | 16.0% | 31.4% |
| 22 | Clarksdale, MS | 15,124 | 41.6% | $73,800 | 21.0% | 32.51% |
| 23 | Ocean Springs, MS | 18,275 | 7.3% | $184,800 | 17.0% | 30.97% |
| 24 | Jackson, MS | 156,803 | 26.1% | $92,900 | 23.0% | 30.13% |
| 25 | Pearl, MS | 27,017 | 10.2% | $141,000 | 31.0% | 34.56% |
| 26 | Ripley, MS | 5,412 | 20.1% | $113,700 | 33.0% | 32.07% |
| 27 | Hernando, MS | 16,730 | 7.5% | $236,600 | 17.0% | 38.9% |
| 28 | Indianola, MS | 9,679 | 30.8% | $100,300 | 23.0% | 36.13% |
| 29 | Richland, MS | 7,126 | 19.8% | $109,000 | 35.0% | 36.64% |
| 30 | Greenwood, MS | 14,521 | 30.0% | $85,200 | 19.0% | 29.15% |
| 31 | Diamondhead, MS | 9,417 | 5.4% | $188,600 | 12.0% | 26.63% |
| 32 | Byram, MS | 12,591 | 5.0% | $147,600 | 39.0% | 44.37% |
| 33 | Louisville, MS | 6,108 | 33.8% | $103,400 | 26.0% | 29.81% |
| 34 | Petal, MS | 11,342 | 17.0% | $141,400 | 28.0% | 39.62% |
| 35 | Columbus, MS | 23,858 | 26.9% | $116,300 | 19.0% | 22.92% |
| 36 | Pontotoc, MS | 5,621 | 16.4% | $123,400 | 28.0% | 37.42% |
| 37 | West Point, MS | 10,148 | 31.5% | $105,600 | 28.0% | 27.12% |
| 38 | Pass Christian, MS | 5,655 | 11.2% | $212,000 | 20.0% | 29.36% |
| 39 | Bay St. Louis, MS | 9,568 | 22.2% | $195,900 | 20.0% | 29.09% |
| 40 | Meridian, MS | 35,625 | 30.4% | $92,100 | 23.0% | 28.38% |
| 41 | Greenville, MS | 30,175 | 32.4% | $81,000 | 25.0% | 26.02% |
| 42 | Amory, MS | 6,665 | 18.1% | $128,700 | 35.0% | 28.54% |
| 43 | Corinth, MS | 14,545 | 20.7% | $137,300 | 20.0% | 22.58% |
| 44 | Laurel, MS | 17,375 | 33.8% | $88,900 | 24.0% | 30.15% |
| 45 | Brandon, MS | 24,887 | 4.8% | $222,600 | 40.0% | 35.62% |
| 46 | Vicksburg, MS | 21,748 | 27.8% | $110,200 | 21.0% | 26.95% |
| 47 | Brookhaven, MS | 11,855 | 26.4% | $92,900 | 29.0% | 27.36% |
| 48 | Clinton, MS | 27,830 | 9.0% | $183,800 | 31.0% | 33.97% |
| 49 | Natchez, MS | 14,435 | 33.2% | $96,800 | 21.0% | 28.95% |
| 50 | New Albany, MS | 7,657 | 14.4% | $116,300 | 31.0% | 30.59% |
| 51 | Madison, MS | 27,459 | 4.7% | $282,600 | 40.0% | 42.18% |
| 52 | Mccomb, MS | 12,400 | 35.5% | $92,800 | 22.0% | 18.73% |
| 53 | Canton, MS | 10,955 | 30.9% | $117,700 | 19.0% | 24.63% |
| 54 | Batesville, MS | 7,404 | 19.9% | $168,000 | 30.0% | 38.25% |
| 55 | Cleveland, MS | 11,285 | 29.8% | $142,600 | 21.0% | 34.27% |
| 56 | Hattiesburg, MS | 47,074 | 32.0% | $131,300 | 17.0% | 27.69% |
| 57 | Tupelo, MS | 37,872 | 14.1% | $158,800 | 30.0% | 30.06% |
| 58 | Booneville, MS | 8,702 | 22.7% | $120,300 | 26.0% | 26.86% |
| 59 | Grenada, MS | 12,675 | 30.2% | $102,000 | 32.0% | 26.25% |
| 60 | Flowood, MS | 10,019 | 17.7% | $220,000 | 33.0% | 32.34% |
| 61 | Ridgeland, MS | 24,330 | 6.9% | $198,800 | 26.0% | 28.41% |
| 62 | Oxford, MS | 25,859 | 29.1% | $288,600 | 17.0% | 23.09% |
| 63 | Starkville, MS | 24,578 | 28.8% | $197,600 | 20.0% | 22.3% |