
Do you live in one of the most miserable places in Washington?
Only a third of Washingtonians say they are truly happy. That’s too bad, considering that folks in Washington don’t really have it too bad in the grand scheme of things.
But, we were curious – which Washington cities might be the most miserable? We’re about to find out, using Saturday Night Science and data.
After analyzing the 120 largest cities, we sadly present the most miserable cities in the Evergreen State.
Table Of Contents: Top Ten | Methodology | Summary | Table
Read on below to see how we crunched the numbers and how your town ranked. If you have a smile on your face, you probably don’t live in one of these cities.
Oh, and by the way, North Bend is the happiest place in Washington.
For more Washington reading, check out:
The 10 Most Miserable Places In Washington For 2023
/10
Population: 10,205
Poverty Level: 6.0%
Median Home Price $315,400
Married Households 12.0%
Households With Kids 49.37%
More on Yelm: Data | Crime | Cost Of Living
/10
Population: 5,208
Poverty Level: 2.5%
Median Home Price $315,900
Married Households 15.0%
Households With Kids 34.92%
More on Sultan: Data | Crime | Cost Of Living
/10
Population: 8,843
Poverty Level: 16.1%
Median Home Price $159,200
Married Households 10.0%
Households With Kids 59.2%
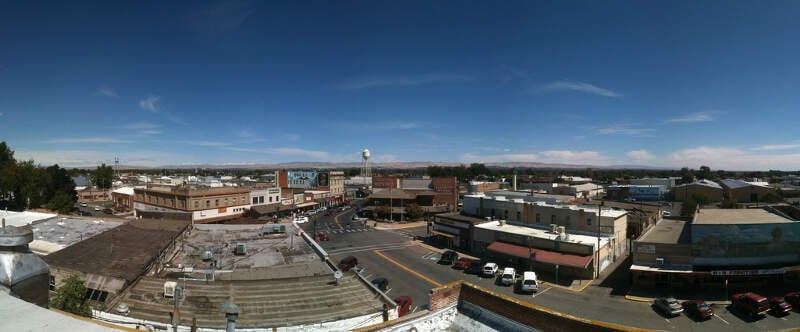
More on Toppenish: Data | Crime | Cost Of Living
/10
Population: 10,894
Poverty Level: 14.2%
Median Home Price $155,400
Married Households 9.0%
Households With Kids 52.46%
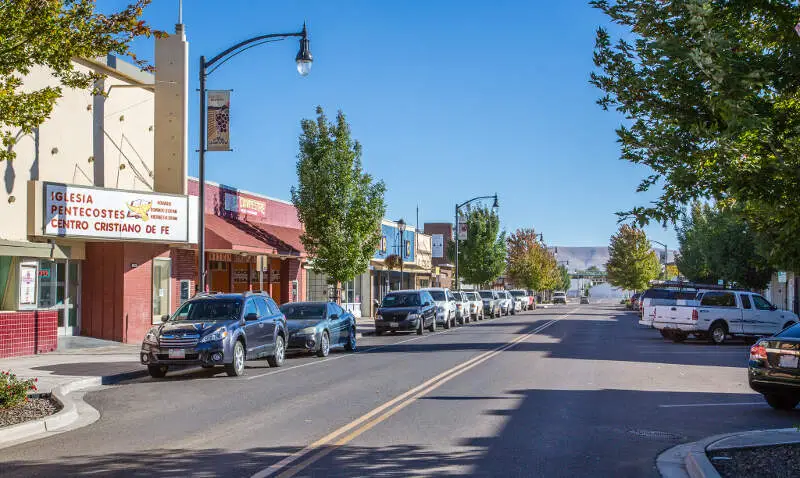
More on Grandview: Data | Crime | Cost Of Living
/10
Population: 16,343
Poverty Level: 18.6%
Median Home Price $152,900
Married Households 16.0%
Households With Kids 53.63%
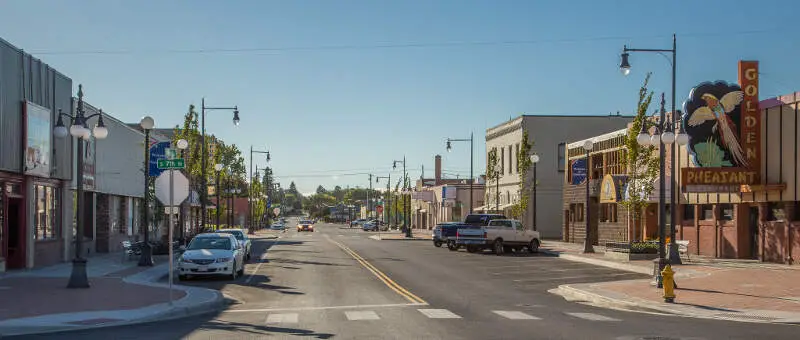
More on Sunnyside: Data | Crime | Cost Of Living
/10
Population: 6,368
Poverty Level: 7.4%
Median Home Price $275,900
Married Households 17.0%
Households With Kids 41.71%
More on Woodland: Data | Crime | Cost Of Living
/10
Population: 7,130
Poverty Level: 6.4%
Median Home Price $331,200
Married Households 14.0%
Households With Kids 44.03%
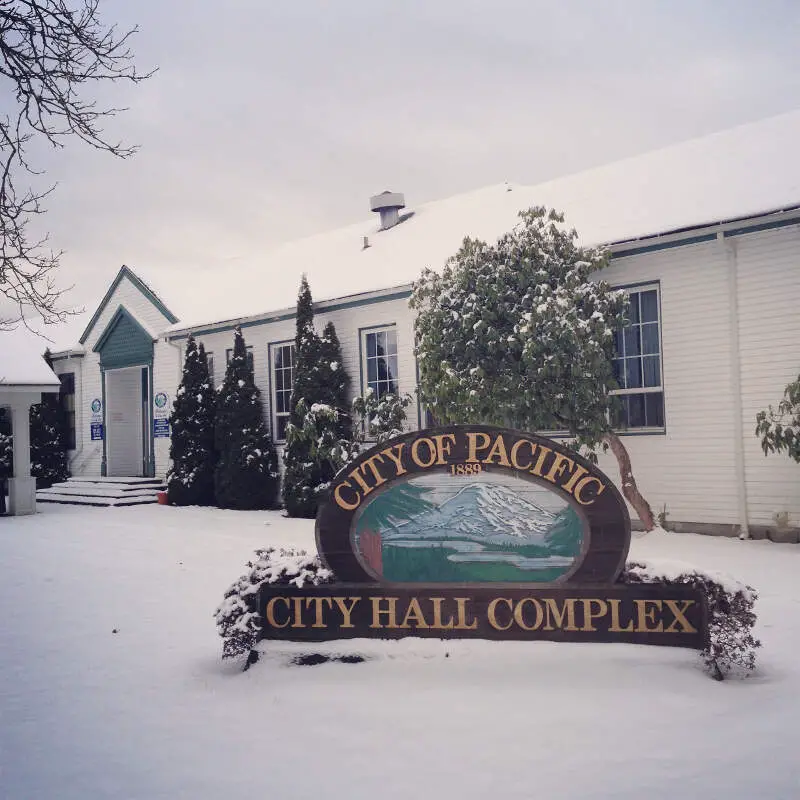
More on Pacific: Data | Crime | Cost Of Living
/10
Population: 10,288
Poverty Level: 24.5%
Median Home Price $208,400
Married Households 14.0%
Households With Kids 38.24%
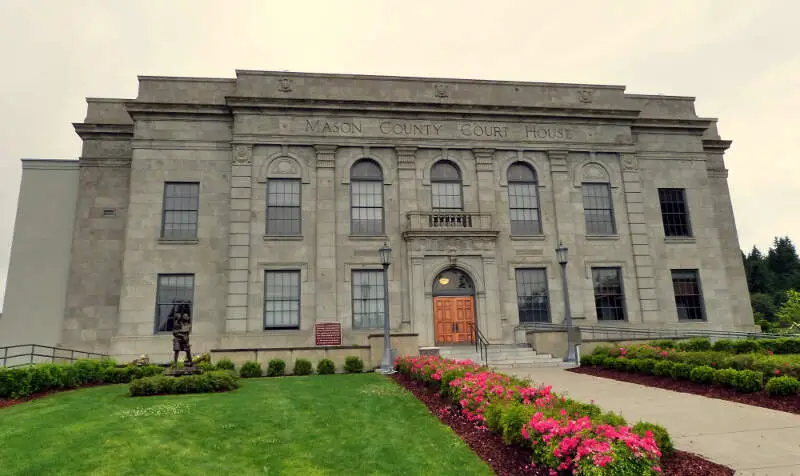
More on Shelton: Data | Crime | Cost Of Living
/10
Population: 20,536
Poverty Level: 6.4%
Median Home Price $344,700
Married Households 13.0%
Households With Kids 39.14%
More on Battle Ground: Data | Crime | Cost Of Living
/10
Population: 8,781
Poverty Level: 6.9%
Median Home Price $336,300
Married Households 28.0%
Households With Kids 44.42%
More on Orting: Data | Crime | Cost Of Living
Methodology: How We Measured The Most Miserable Cities In The Evergreen State
To rank the unhappiest places in Washington, we had to determine what criteria make people happy. It isn’t a stretch to assume that happy people earn great salaries, are relatively stress-free, and have a stable home life.
So we went to the Census’s American Community Survey 2017-2021 report for the happy criteria, flipped the list with Saturday Night Science, and it spit out the answer.
Like magic.
Here are the criteria we used to measure misery:
- Percentage of residents with a college degree
- Average commute times
- Unemployment rates
- Cost of living
- % of married couples
- % of families with kids
- Poverty rate
After we decided on the criteria, we gathered the data for the 120 places in Washington with over 5,000 people.
We then ranked each place from one to 120 for each of the seven criteria, with a score of one being the most miserable (Any ties were given to the larger place).
Next, we averaged the seven rankings into a Miserable Index for each place with the lowest overall Miserable Index “earning” the title “Most Miserable City In Washington.”
If you’d like to see the complete list of states, most miserable to happiest, scroll to the bottom of this post to see the unabridged chart.
We updated this article for 2023, and it’s our tenth time ranking the most miserable cities in Washington.
There You Have It – The Least Happy Cities In Washington
As we said earlier, trying to determine the most miserable cities in Washington is usually a subjective matter.
But if you’re analyzing cities where people are not stable, where you’re stuck in traffic, and no one spent the time to go to college, then this is an accurate list.
If you’re curious enough, here are the happiest cities in Washington, according to science:
- North Bend
- Bellingham
- Normandy Park
For more Washington reading, check out:
- Best Places To Live In Washington
- Cheapest Places To Live In Washington
- Most Dangerous Cities In Washington
- Richest Cities In Washington
- Safest Places In Washington
- Worst Places To Live In Washington
- Most Expensive Places To Live In Washington
Miserable Cities In Washington For 2023
| Rank | City | Population | Poverty Level | Median Home Value | % Married | % Kids |
|---|---|---|---|---|---|---|
| 1 | Yelm, WA | 10,205 | 6.0% | $315,400 | 12.0% | 49.37% |
| 2 | Sultan, WA | 5,208 | 2.5% | $315,900 | 15.0% | 34.92% |
| 3 | Toppenish, WA | 8,843 | 16.1% | $159,200 | 10.0% | 59.2% |
| 4 | Grandview, WA | 10,894 | 14.2% | $155,400 | 9.0% | 52.46% |
| 5 | Sunnyside, WA | 16,343 | 18.6% | $152,900 | 16.0% | 53.63% |
| 6 | Woodland, WA | 6,368 | 7.4% | $275,900 | 17.0% | 41.71% |
| 7 | Pacific, WA | 7,130 | 6.4% | $331,200 | 14.0% | 44.03% |
| 8 | Shelton, WA | 10,288 | 24.5% | $208,400 | 14.0% | 38.24% |
| 9 | Battle Ground, WA | 20,536 | 6.4% | $344,700 | 13.0% | 39.14% |
| 10 | Orting, WA | 8,781 | 6.9% | $336,300 | 28.0% | 44.42% |
| 11 | Othello, WA | 8,470 | 21.8% | $206,300 | 14.0% | 51.67% |
| 12 | Kent, WA | 134,890 | 11.3% | $414,200 | 11.0% | 37.28% |
| 13 | Clarkston, WA | 7,164 | 16.9% | $157,300 | 6.0% | 31.69% |
| 14 | Airway Heights, WA | 10,108 | 17.9% | $200,300 | 10.0% | 32.44% |
| 15 | Seatac, WA | 30,867 | 10.7% | $364,400 | 10.0% | 31.24% |
| 16 | Oak Harbor, WA | 24,267 | 8.6% | $329,500 | 7.0% | 36.16% |
| 17 | Union Gap, WA | 6,499 | 22.3% | $140,200 | 16.0% | 37.34% |
| 18 | Maple Valley, WA | 27,643 | 4.6% | $498,100 | 21.0% | 50.08% |
| 19 | Ephrata, WA | 8,348 | 7.2% | $175,700 | 22.0% | 38.24% |
| 20 | Federal Way, WA | 99,792 | 11.3% | $384,200 | 12.0% | 33.41% |
| 21 | Lake Stevens, WA | 35,135 | 5.4% | $425,500 | 22.0% | 45.56% |
| 22 | Pasco, WA | 76,398 | 15.4% | $250,500 | 16.0% | 47.54% |
| 23 | Auburn, WA | 85,306 | 9.6% | $393,500 | 15.0% | 36.01% |
| 24 | Ridgefield, WA | 10,432 | 3.1% | $450,700 | 15.0% | 45.65% |
| 25 | Puyallup, WA | 42,366 | 6.6% | $387,800 | 19.0% | 30.79% |
| 26 | Tukwila, WA | 21,545 | 12.4% | $373,200 | 8.0% | 30.25% |
| 27 | Fife, WA | 10,869 | 12.8% | $337,200 | 13.0% | 34.99% |
| 28 | Aberdeen, WA | 16,842 | 25.2% | $162,100 | 18.0% | 33.33% |
| 29 | Centralia, WA | 17,988 | 22.1% | $183,200 | 15.0% | 27.84% |
| 30 | Lacey, WA | 52,572 | 9.6% | $310,600 | 12.0% | 30.66% |
| 31 | Yakima, WA | 96,266 | 17.6% | $206,600 | 18.0% | 37.15% |
| 32 | Lakewood, WA | 62,972 | 13.6% | $331,500 | 12.0% | 27.48% |
| 33 | Port Orchard, WA | 15,315 | 10.2% | $377,700 | 14.0% | 40.3% |
| 34 | Dupont, WA | 9,974 | 3.0% | $385,500 | 10.0% | 35.54% |
| 35 | Des Moines, WA | 32,631 | 11.3% | $416,500 | 13.0% | 30.8% |
| 36 | Washougal, WA | 16,664 | 14.0% | $376,000 | 14.0% | 35.72% |
| 37 | Liberty Lake, WA | 11,647 | 3.6% | $361,000 | 21.0% | 41.45% |
| 38 | Snohomish, WA | 10,091 | 7.2% | $435,500 | 21.0% | 32.51% |
| 39 | Chehalis, WA | 7,427 | 13.4% | $228,500 | 18.0% | 26.95% |
| 40 | Marysville, WA | 69,957 | 6.1% | $384,000 | 22.0% | 32.05% |
| 41 | Sumner, WA | 10,545 | 6.5% | $390,700 | 20.0% | 33.16% |
| 42 | Moses Lake, WA | 24,764 | 10.2% | $205,100 | 18.0% | 37.47% |
| 43 | Duvall, WA | 8,007 | 2.3% | $599,400 | 15.0% | 47.87% |
| 44 | Sammamish, WA | 66,532 | 3.1% | $939,600 | 10.0% | 54.02% |
| 45 | Kelso, WA | 12,566 | 21.1% | $201,800 | 17.0% | 29.5% |
| 46 | Prosser, WA | 6,061 | 18.6% | $210,100 | 20.0% | 36.31% |
| 47 | Sedro-Woolley, WA | 12,266 | 12.7% | $298,100 | 23.0% | 36.71% |
| 48 | Bonney Lake, WA | 22,229 | 5.1% | $396,700 | 25.0% | 43.52% |
| 49 | Monroe, WA | 19,879 | 7.6% | $432,600 | 19.0% | 40.99% |
| 50 | Bremerton, WA | 43,345 | 14.6% | $306,700 | 10.0% | 24.38% |
| 51 | Covington, WA | 20,608 | 4.8% | $434,500 | 22.0% | 38.3% |
| 52 | Vancouver, WA | 188,331 | 12.7% | $343,900 | 9.0% | 29.12% |
| 53 | Burlington, WA | 9,220 | 14.3% | $304,600 | 18.0% | 35.0% |
| 54 | Longview, WA | 37,542 | 13.7% | $239,100 | 17.0% | 26.97% |
| 55 | Stanwood, WA | 7,776 | 5.1% | $419,000 | 27.0% | 38.09% |
| 56 | Hoquiam, WA | 8,700 | 16.1% | $135,900 | 22.0% | 24.93% |
| 57 | Arlington, WA | 19,832 | 6.9% | $372,600 | 26.0% | 34.61% |
| 58 | College Place, WA | 9,739 | 10.3% | $249,800 | 15.0% | 31.08% |
| 59 | Camas, WA | 25,774 | 3.8% | $497,100 | 12.0% | 42.8% |
| 60 | Renton, WA | 105,313 | 7.9% | $474,700 | 12.0% | 31.7% |
| 61 | Burien, WA | 51,646 | 11.7% | $459,800 | 14.0% | 31.01% |
| 62 | Blaine, WA | 5,773 | 11.5% | $369,500 | 11.0% | 25.95% |
| 63 | Mount Vernon, WA | 34,824 | 16.5% | $334,700 | 17.0% | 35.76% |
| 64 | Quincy, WA | 7,630 | 18.3% | $216,000 | 19.0% | 61.16% |
| 65 | Newcastle, WA | 12,855 | 3.6% | $888,400 | 12.0% | 33.35% |
| 66 | West Richland, WA | 15,988 | 5.8% | $322,200 | 25.0% | 46.98% |
| 67 | Lynden, WA | 15,410 | 6.9% | $394,600 | 25.0% | 34.65% |
| 68 | Everett, WA | 110,438 | 11.0% | $394,900 | 13.0% | 27.69% |
| 69 | Ocean Shores, WA | 6,637 | 10.4% | $267,700 | 24.0% | 10.34% |
| 70 | Tumwater, WA | 24,855 | 8.5% | $343,300 | 18.0% | 32.8% |
| 71 | Enumclaw, WA | 12,544 | 7.7% | $358,000 | 26.0% | 27.18% |
| 72 | Tacoma, WA | 217,332 | 12.5% | $347,100 | 15.0% | 27.57% |
| 73 | Spokane Valley, WA | 102,178 | 10.6% | $250,500 | 20.0% | 29.2% |
| 74 | East Wenatchee, WA | 14,113 | 10.9% | $314,100 | 24.0% | 43.69% |
| 75 | Kennewick, WA | 83,082 | 14.1% | $262,400 | 18.0% | 33.4% |
| 76 | Cheney, WA | 12,743 | 34.2% | $239,500 | 11.0% | 23.52% |
| 77 | Snoqualmie, WA | 13,718 | 0.2% | $681,500 | 20.0% | 54.33% |
| 78 | Brier, WA | 6,524 | 1.5% | $660,300 | 30.0% | 35.42% |
| 79 | Milton, WA | 8,501 | 8.8% | $359,400 | 22.0% | 29.17% |
| 80 | Walla Walla, WA | 33,765 | 13.5% | $262,600 | 15.0% | 28.25% |
| 81 | Kenmore, WA | 23,556 | 6.1% | $656,200 | 16.0% | 31.6% |
| 82 | Bothell, WA | 47,355 | 4.5% | $638,000 | 19.0% | 33.94% |
| 83 | Mill Creek, WA | 20,665 | 3.7% | $647,800 | 18.0% | 31.32% |
| 84 | Fircrest, WA | 7,109 | 5.6% | $406,500 | 24.0% | 32.15% |
| 85 | Bainbridge Island, WA | 24,557 | 2.6% | $852,700 | 14.0% | 29.37% |
| 86 | Mountlake Terrace, WA | 21,210 | 6.4% | $451,900 | 14.0% | 28.3% |
| 87 | Redmond, WA | 72,166 | 6.0% | $864,100 | 6.0% | 35.27% |
| 88 | Sequim, WA | 7,896 | 14.4% | $252,900 | 9.0% | 18.95% |
| 89 | Port Angeles, WA | 19,888 | 11.5% | $253,000 | 17.0% | 23.66% |
| 90 | Black Diamond, WA | 5,002 | 1.5% | $609,200 | 20.0% | 31.24% |
| 91 | Ellensburg, WA | 19,215 | 22.7% | $261,500 | 13.0% | 19.02% |
| 92 | Lynnwood, WA | 38,812 | 15.6% | $492,600 | 12.0% | 28.05% |
| 93 | Richland, WA | 59,718 | 8.1% | $311,000 | 17.0% | 30.78% |
| 94 | Poulsbo, WA | 11,652 | 10.9% | $420,800 | 15.0% | 30.26% |
| 95 | Ferndale, WA | 14,777 | 11.3% | $366,200 | 21.0% | 48.72% |
| 96 | Issaquah, WA | 39,057 | 7.4% | $745,100 | 9.0% | 30.22% |
| 97 | Olympia, WA | 54,579 | 14.0% | $355,100 | 12.0% | 25.65% |
| 98 | Woodinville, WA | 13,247 | 3.2% | $770,800 | 16.0% | 29.78% |
| 99 | Steilacoom, WA | 6,673 | 7.7% | $442,500 | 17.0% | 31.31% |
| 100 | Buckley, WA | 5,098 | 6.1% | $415,500 | 39.0% | 28.3% |