
Do you live in one of the most miserable places in Georgia?
Only a third of Georgians say they are truly happy. That’s too bad, considering that folks in Georgia don’t really have it too bad in the grand scheme of things.
But, we were curious – which Georgia cities might be the most miserable? We’re about to find out, using Saturday Night Science and data.
After analyzing the 128 largest cities, we sadly present the most miserable cities in the Peach State.
Table Of Contents: Top Ten | Methodology | Summary | Table
The 10 Most Miserable Places In Georgia
Read on below to see how we crunched the numbers and how your town ranked. If you have a smile on your face, you probably don’t live in one of these cities.
Oh, and by the way, Dahlonega is the happiest place in Georgia.
For more Georgia reading, check out:
The 10 Most Miserable Places In Georgia For 2023
/10
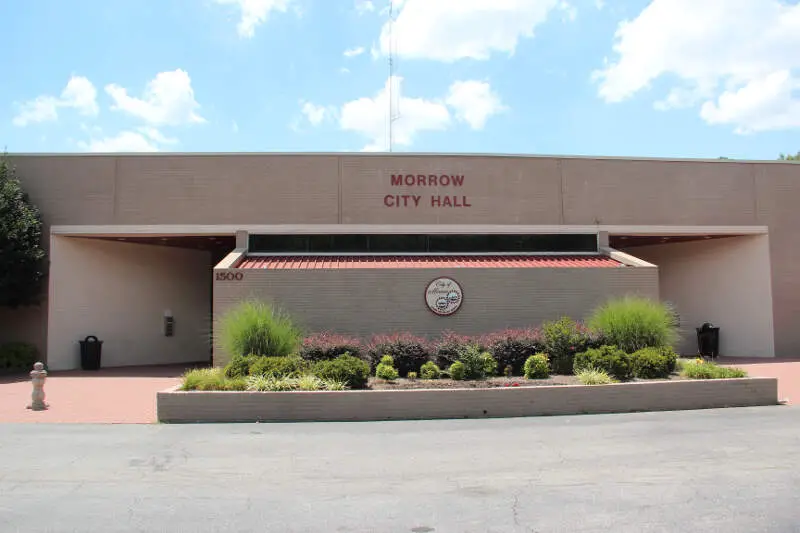
Population: 6,572
Poverty Level: 14.3%
Median Home Price $116,000
Married Households 5.0%
Households With Kids 51.4%
More on Morrow: Data | Crime | Cost Of Living

/10
Population: 10,208
Poverty Level: 17.1%
Median Home Price $153,800
Married Households 7.0%
Households With Kids 59.66%
More on Lovejoy: Data | Cost Of Living
/10
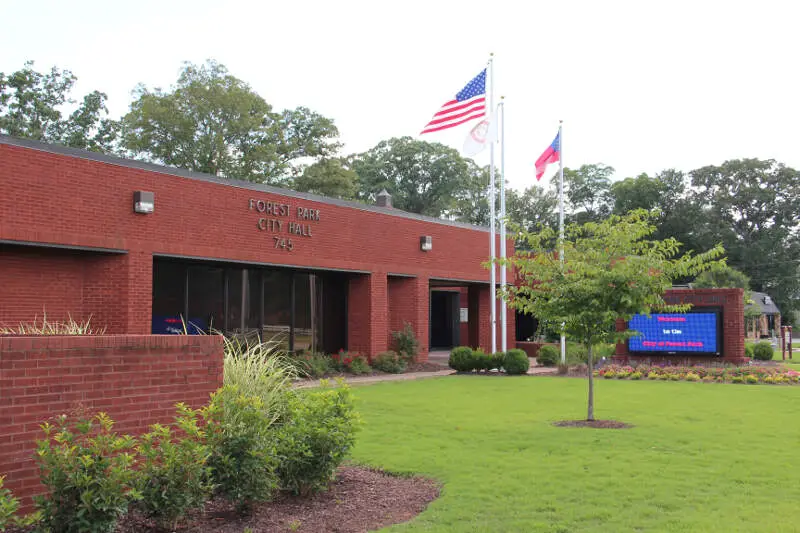
Population: 19,856
Poverty Level: 20.8%
Median Home Price $82,400
Married Households 11.0%
Households With Kids 35.6%
More on Forest Park: Data | Crime | Cost Of Living
/10
Population: 14,455
Poverty Level: 25.9%
Median Home Price $164,200
Married Households 5.0%
Households With Kids 51.96%
More on Clarkston: Data | Crime | Cost Of Living
/10
Population: 6,696
Poverty Level: 2.6%
Median Home Price $268,200
Married Households 21.0%
Households With Kids 54.59%
More on Dacula: Data | Cost Of Living

/10
Population: 9,533
Poverty Level: 17.8%
Median Home Price $111,600
Married Households 4.0%
Households With Kids 52.29%
More on Cusseta-Chattahoochee County Unified Government: Data
/10
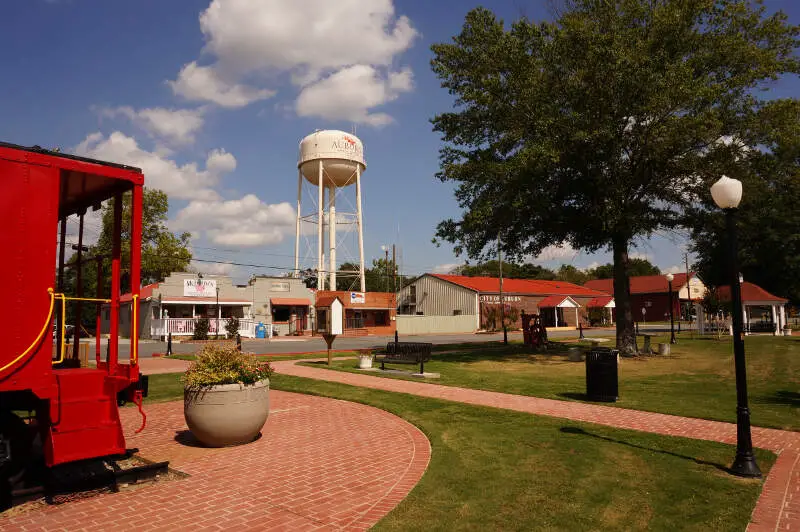
Population: 7,424
Poverty Level: 6.2%
Median Home Price $159,700
Married Households 24.0%
Households With Kids 39.59%
More on Auburn: Data | Cost Of Living
/10
Population: 10,091
Poverty Level: 39.5%
Median Home Price $111,700
Married Households 18.0%
Households With Kids 46.59%
More on Cedartown: Data | Crime | Cost Of Living
/10
Population: 34,733
Poverty Level: 19.0%
Median Home Price $136,100
Married Households 8.0%
Households With Kids 36.17%
More on Hinesville: Data | Cost Of Living
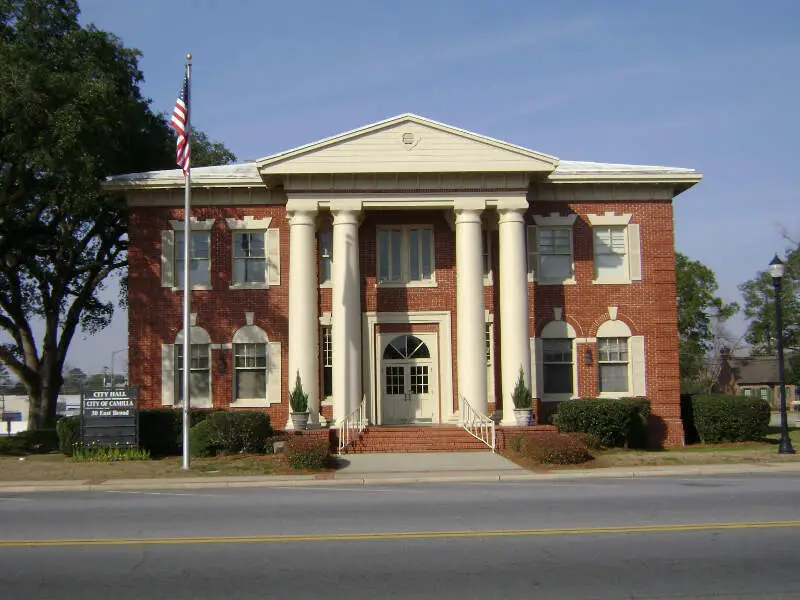
/10
Population: 5,135
Poverty Level: 48.1%
Median Home Price $79,100
Married Households 14.0%
Households With Kids 40.76%
More on Camilla: Data | Crime | Cost Of Living
Methodology: How We Measured The Most Miserable Cities In The Peach State
To rank the unhappiest places in Georgia, we had to determine what criteria make people happy. It isn’t a stretch to assume that happy people earn great salaries, are relatively stress-free, and have a stable home life.
So we went to the Census’s American Community Survey 2017-2021 report for the happy criteria, flipped the list with Saturday Night Science, and it spit out the answer.
Like magic.
Here are the criteria we used to measure misery:
- Percentage of residents with a college degree
- Average commute times
- Unemployment rates
- Cost of living
- % of married couples
- % of families with kids
- Poverty rate
After we decided on the criteria, we gathered the data for the 128 places in Georgia with over 5,000 people.
We then ranked each place from one to 128 for each of the seven criteria, with a score of one being the most miserable (Any ties were given to the larger place).
Next, we averaged the seven rankings into a Miserable Index for each place with the lowest overall Miserable Index “earning” the title “Most Miserable City In Georgia.”
If you’d like to see the complete list of states, most miserable to happiest, scroll to the bottom of this post to see the unabridged chart.
We updated this article for 2023, and it’s our tenth time ranking the most miserable cities in Georgia.
There You Have It – The Least Happy Cities In Georgia
As we said earlier, trying to determine the most miserable cities in Georgia is usually a subjective matter.
But if you’re analyzing cities where people are not stable, where you’re stuck in traffic, and no one spent the time to go to college, then this is an accurate list.
If you’re curious enough, here are the happiest cities in Georgia, according to science:
- Dahlonega
- Athens-Clarke County unified government (balance)
- Carrollton
For more Georgia reading, check out:
- Best Places To Live In Georgia
- Cheapest Places To Live In Georgia
- Most Dangerous Places In Georgia
- Richest Cities In Georgia
- Safest Places In Georgia
- Worst Places To Live In Georgia
- Most Expensive Places To Live In Georgia
Miserable Cities In Georgia For 2023
| Rank | City | Population | Poverty Level | Median Home Value | % Married | % Kids |
|---|---|---|---|---|---|---|
| 1 | Morrow, GA | 6,572 | 14.3% | $116,000 | 5.0% | 51.4% |
| 2 | Lovejoy, GA | 10,208 | 17.1% | $153,800 | 7.0% | 59.66% |
| 3 | Forest Park, GA | 19,856 | 20.8% | $82,400 | 11.0% | 35.6% |
| 4 | Clarkston, GA | 14,455 | 25.9% | $164,200 | 5.0% | 51.96% |
| 5 | Dacula, GA | 6,696 | 2.6% | $268,200 | 21.0% | 54.59% |
| 6 | Cusseta-Chattahoochee County Unified Government, GA | 9,533 | 17.8% | $111,600 | 4.0% | 52.29% |
| 7 | Auburn, GA | 7,424 | 6.2% | $159,700 | 24.0% | 39.59% |
| 8 | Cedartown, GA | 10,091 | 39.5% | $111,700 | 18.0% | 46.59% |
| 9 | Hinesville, GA | 34,733 | 19.0% | $136,100 | 8.0% | 36.17% |
| 10 | Camilla, GA | 5,135 | 48.1% | $79,100 | 14.0% | 40.76% |
| 11 | Stone Mountain, GA | 6,622 | 12.8% | $137,900 | 6.0% | 28.7% |
| 12 | Austell, GA | 8,194 | 5.1% | $156,000 | 18.0% | 44.4% |
| 13 | Swainsboro, GA | 7,430 | 35.6% | $94,500 | 17.0% | 38.34% |
| 14 | Mcdonough, GA | 28,574 | 11.3% | $191,700 | 11.0% | 41.79% |
| 15 | Powder Springs, GA | 16,698 | 8.6% | $199,100 | 9.0% | 38.42% |
| 16 | Dallas, GA | 13,704 | 16.5% | $174,000 | 16.0% | 49.1% |
| 17 | Garden City, GA | 10,263 | 14.9% | $129,700 | 17.0% | 35.7% |
| 18 | Richmond Hill, GA | 15,900 | 10.5% | $223,400 | 11.0% | 54.49% |
| 19 | Temple, GA | 5,093 | 2.8% | $129,100 | 30.0% | 45.67% |
| 20 | Holly Springs, GA | 15,784 | 3.8% | $312,600 | 14.0% | 48.84% |
| 21 | Lawrenceville, GA | 30,299 | 17.5% | $216,800 | 9.0% | 34.41% |
| 22 | Loganville, GA | 13,810 | 9.5% | $228,800 | 16.0% | 44.81% |
| 23 | Lilburn, GA | 14,424 | 19.7% | $212,700 | 8.0% | 43.1% |
| 24 | Villa Rica, GA | 16,863 | 7.1% | $178,900 | 18.0% | 47.07% |
| 25 | Monroe, GA | 14,675 | 33.7% | $161,400 | 17.0% | 43.01% |
| 26 | Jackson, GA | 5,435 | 33.0% | $129,700 | 17.0% | 47.82% |
| 27 | Conyers, GA | 17,101 | 17.5% | $161,900 | 10.0% | 30.32% |
| 28 | Fort Valley, GA | 8,829 | 33.5% | $89,500 | 13.0% | 30.76% |
| 29 | Cochran, GA | 5,035 | 28.1% | $105,200 | 22.0% | 46.03% |
| 30 | Locust Grove, GA | 8,816 | 23.0% | $169,500 | 22.0% | 38.06% |
| 31 | Stockbridge, GA | 28,567 | 11.1% | $204,100 | 10.0% | 33.32% |
| 32 | Snellville, GA | 20,475 | 8.0% | $206,900 | 12.0% | 35.49% |
| 33 | Hampton, GA | 8,166 | 14.6% | $162,500 | 16.0% | 32.23% |
| 34 | Riverdale, GA | 15,013 | 13.2% | $119,200 | 12.0% | 29.77% |
| 35 | Kingsland, GA | 18,217 | 16.9% | $176,200 | 8.0% | 40.97% |
| 36 | Moultrie, GA | 14,621 | 24.7% | $115,100 | 19.0% | 34.51% |
| 37 | Grovetown, GA | 15,608 | 12.2% | $164,900 | 14.0% | 40.71% |
| 38 | Thomson, GA | 6,892 | 14.4% | $113,000 | 20.0% | 23.81% |
| 39 | Johns Creek, GA | 82,068 | 3.6% | $452,700 | 6.0% | 43.02% |
| 40 | Winder, GA | 17,768 | 13.8% | $190,100 | 21.0% | 35.35% |
| 41 | Douglasville, GA | 34,410 | 11.5% | $214,300 | 12.0% | 33.16% |
| 42 | Kennesaw, GA | 33,036 | 13.5% | $225,500 | 9.0% | 34.78% |
| 43 | St. Marys, GA | 18,200 | 18.4% | $211,000 | 8.0% | 35.97% |
| 44 | Milton, GA | 40,487 | 4.3% | $561,000 | 7.0% | 43.67% |
| 45 | Lafayette, GA | 6,928 | 20.3% | $99,400 | 22.0% | 23.35% |
| 46 | Union City, GA | 26,273 | 8.6% | $169,700 | 11.0% | 31.14% |
| 47 | Warner Robins, GA | 79,589 | 12.4% | $135,200 | 15.0% | 35.44% |
| 48 | Alpharetta, GA | 65,187 | 4.3% | $469,800 | 7.0% | 39.67% |
| 49 | Fairburn, GA | 16,215 | 25.3% | $170,700 | 9.0% | 41.07% |
| 50 | Fayetteville, GA | 18,633 | 8.2% | $257,400 | 16.0% | 32.53% |
| 51 | Port Wentworth, GA | 10,502 | 4.1% | $156,900 | 23.0% | 24.99% |
| 52 | Sugar Hill, GA | 24,599 | 8.2% | $277,700 | 14.0% | 41.83% |
| 53 | Cordele, GA | 10,316 | 39.5% | $77,700 | 20.0% | 30.74% |
| 54 | Canton, GA | 32,342 | 15.1% | $261,100 | 14.0% | 34.22% |
| 55 | Covington, GA | 14,065 | 21.0% | $179,400 | 19.0% | 41.82% |
| 56 | Dalton, GA | 34,255 | 19.8% | $155,600 | 11.0% | 36.49% |
| 57 | Acworth, GA | 22,330 | 8.6% | $219,200 | 12.0% | 35.23% |
| 58 | Toccoa, GA | 9,048 | 20.6% | $104,700 | 24.0% | 26.92% |
| 59 | Buford, GA | 16,811 | 13.0% | $265,600 | 16.0% | 42.74% |
| 60 | Blakely, GA | 5,308 | 32.8% | $111,800 | 28.0% | 37.63% |
| 61 | Sylvester, GA | 5,675 | 28.9% | $104,100 | 27.0% | 35.64% |
| 62 | Duluth, GA | 31,506 | 9.0% | $279,000 | 8.0% | 33.21% |
| 63 | Bainbridge, GA | 14,210 | 19.9% | $111,200 | 24.0% | 33.75% |
| 64 | College Park, GA | 14,032 | 19.7% | $244,200 | 13.0% | 30.99% |
| 65 | Braselton, GA | 12,833 | 3.6% | $332,500 | 17.0% | 42.37% |
| 66 | Woodstock, GA | 33,857 | 5.6% | $290,300 | 11.0% | 33.91% |
| 67 | Hapeville, GA | 6,553 | 21.8% | $186,000 | 9.0% | 37.41% |
| 68 | Augusta-Richmond County Consolidated Government (Balance), GA | 201,264 | 22.1% | $123,400 | 15.0% | 27.19% |
| 69 | East Point, GA | 37,895 | 23.2% | $177,500 | 11.0% | 26.78% |
| 70 | Peachtree City, GA | 37,867 | 6.8% | $368,300 | 9.0% | 37.67% |
| 71 | Brunswick, GA | 14,774 | 32.8% | $105,800 | 15.0% | 29.54% |
| 72 | Decatur, GA | 24,334 | 7.3% | $583,900 | 10.0% | 42.8% |
| 73 | Perry, GA | 20,227 | 13.9% | $156,800 | 21.0% | 34.13% |
| 74 | Norcross, GA | 17,413 | 15.0% | $281,300 | 11.0% | 40.6% |
| 75 | Suwanee, GA | 20,629 | 9.5% | $345,600 | 10.0% | 34.01% |
| 76 | Fort Oglethorpe, GA | 10,196 | 11.8% | $138,100 | 19.0% | 17.53% |
| 77 | Eastman, GA | 5,630 | 26.6% | $155,200 | 19.0% | 38.6% |
| 78 | Bremen, GA | 7,066 | 2.8% | $190,600 | 41.0% | 41.94% |
| 79 | Lagrange, GA | 31,053 | 25.7% | $131,500 | 19.0% | 35.98% |
| 80 | Roswell, GA | 92,688 | 6.1% | $408,700 | 9.0% | 33.57% |
| 81 | Columbus, GA | 204,366 | 19.5% | $146,000 | 16.0% | 31.51% |
| 82 | Albany, GA | 70,748 | 28.5% | $101,200 | 20.0% | 29.11% |
| 83 | Vidalia, GA | 10,641 | 22.8% | $123,000 | 28.0% | 29.58% |
| 84 | Sandersville, GA | 5,774 | 23.0% | $92,500 | 23.0% | 33.29% |
| 85 | Statesboro, GA | 32,400 | 36.0% | $126,700 | 11.0% | 24.87% |
| 86 | Waynesboro, GA | 5,745 | 25.9% | $92,100 | 32.0% | 43.55% |
| 87 | Newnan, GA | 41,598 | 9.3% | $233,900 | 17.0% | 36.79% |
| 88 | Thomaston, GA | 9,665 | 38.5% | $89,600 | 20.0% | 30.91% |
| 89 | Jefferson, GA | 12,727 | 9.8% | $255,500 | 26.0% | 48.12% |
| 90 | Fitzgerald, GA | 9,028 | 24.0% | $85,100 | 22.0% | 31.75% |
| 91 | Commerce, GA | 7,213 | 11.8% | $180,500 | 35.0% | 45.18% |
| 92 | Jesup, GA | 9,902 | 20.7% | $135,000 | 28.0% | 36.23% |
| 93 | Americus, GA | 16,144 | 28.7% | $101,500 | 19.0% | 26.9% |
| 94 | Byron, GA | 5,554 | 19.9% | $171,000 | 23.0% | 44.97% |
| 95 | Dublin, GA | 16,067 | 33.8% | $127,300 | 20.0% | 34.72% |
| 96 | Waycross, GA | 13,898 | 34.3% | $71,800 | 18.0% | 29.94% |
| 97 | Douglas, GA | 11,680 | 28.2% | $109,600 | 21.0% | 38.36% |
| 98 | Gainesville, GA | 41,730 | 19.3% | $246,800 | 13.0% | 35.41% |
| 99 | Eatonton, GA | 6,278 | 20.8% | $91,900 | 31.0% | 23.61% |
| 100 | Pooler, GA | 25,284 | 3.7% | $234,100 | 18.0% | 27.35% |