
Most African American cities in Iowa research summary. We used Saturday Night Science to analyze Iowa’s most recent Census data to determine the blackest cities in Iowa based on the percentage of Black residents. Here are the results of our analysis:
-
The city with the largest African American population in Iowa is Waterloo based on the most recent Census data.
-
Waterloo is 16.42% Black.
-
The least African American city in Iowa is Norwalk.
-
Norwalk is 0.06% Black.
-
Iowa is 3.8% Black.
-
Iowa is the 36th blackest state in the United States.
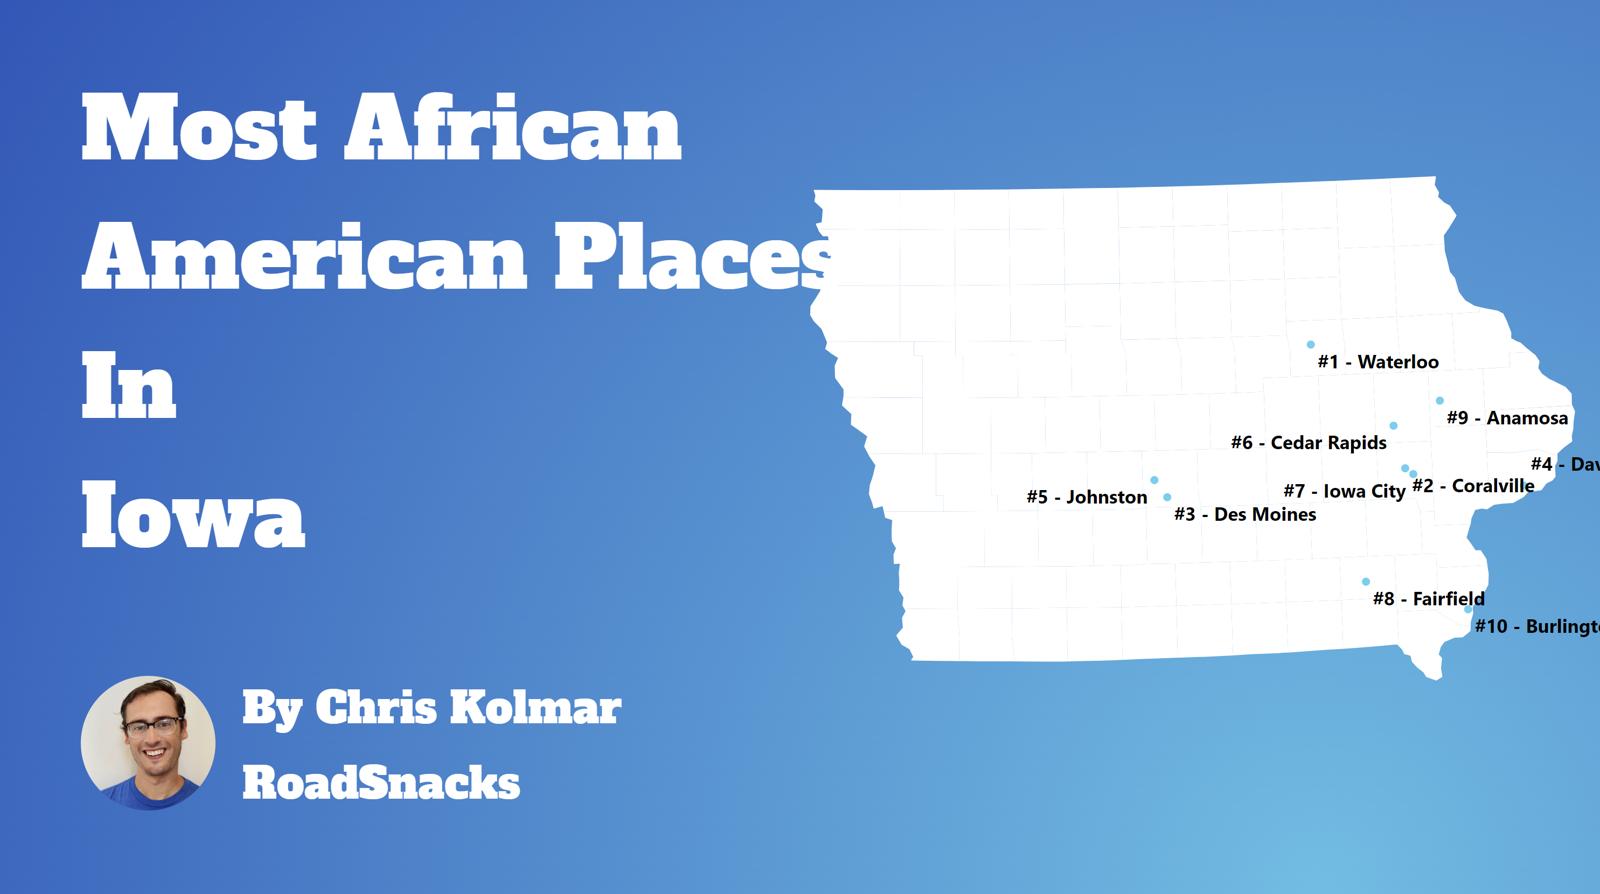
Table Of Contents: Top Ten | Methodology | Summary | Table
The Black community is one of the fastest-growing communities in America this decade.
Roughly 42 million people identifying as Black or African American live in the United States, making up 12% of the total population. According to the most recent American Community Survey, the Black population in Iowa is 121,705 – at 3.8% of the total population of Iowa.
The percentage growth of Blacks in America is the third largest percentage change for any race according to the Census’s race and ethnicity definition. Most scholars and historians agree that increasing diversity in America is a good thing.
We agree.
But how has the increase in the black population impacted Iowa? Which cities and towns in Iowa have seen the greatest increase in its Black population?
We broke down the most recent census data to determine the cities in Iowa with the largest African American population in 2026:
Most African American Places In Iowa
What’s the blackest city in Iowa? The city with the largest Black population in Iowa for 2026 is Waterloo. See if Waterloo ranked as one of the most african american places in America.
And if you already knew these places were Black, check out the best places to live in Iowa or the most diverse places in Iowa.
The 10 Blackest Cities In Iowa For 2026
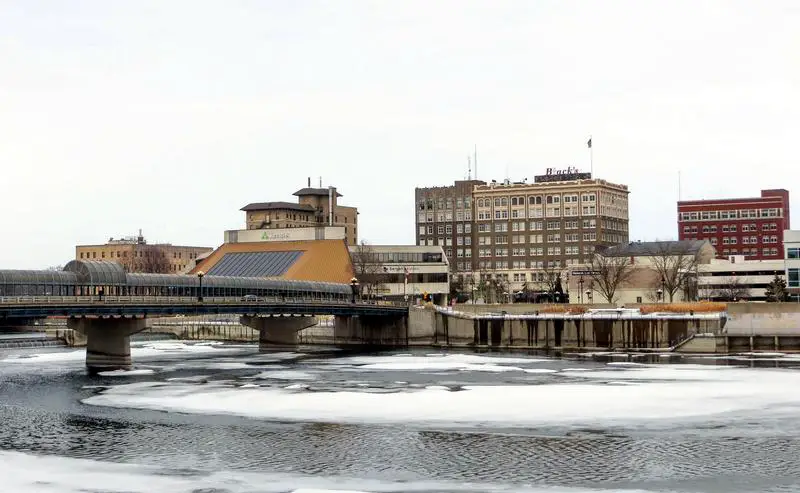
1. Waterloo
/10
Population: 67,008
% African American: 16.42%
# Of African American Residents: 11,004
Percent Change Since 2010: 8.37%
More on Waterloo: Data | Cost Of Living | Movers
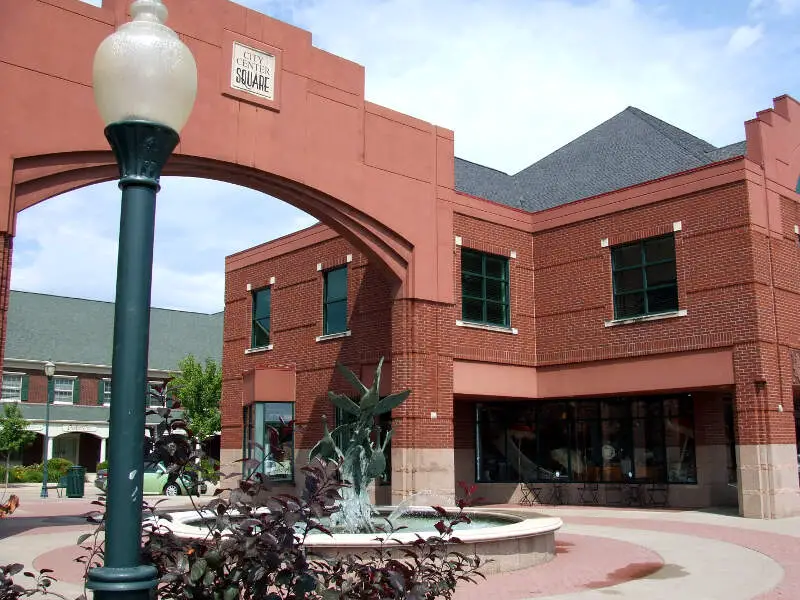
2. Coralville
/10
Population: 23,234
% African American: 13.4%
# Of African American Residents: 3,114
Percent Change Since 2010: 80.31%
More on Coralville: Data | Cost Of Living | Movers
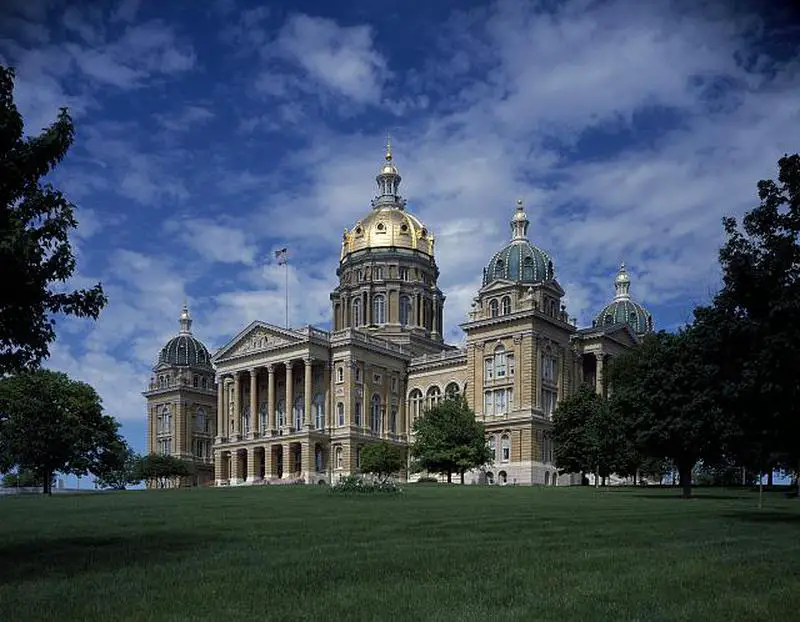
3. Des Moines
/10
Population: 212,421
% African American: 11.1%
# Of African American Residents: 23,574
Percent Change Since 2010: 21.78%
More on Des Moines: Data | Cost Of Living | Movers
4. Davenport
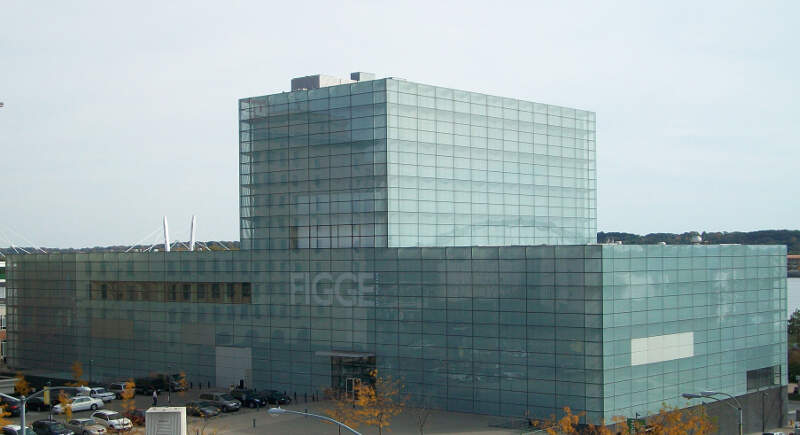
/10
Population: 100,913
% African American: 10.99%
# Of African American Residents: 11,086
Percent Change Since 2010: 8.88%
More on Davenport: Data | Cost Of Living | Movers
5. Johnston
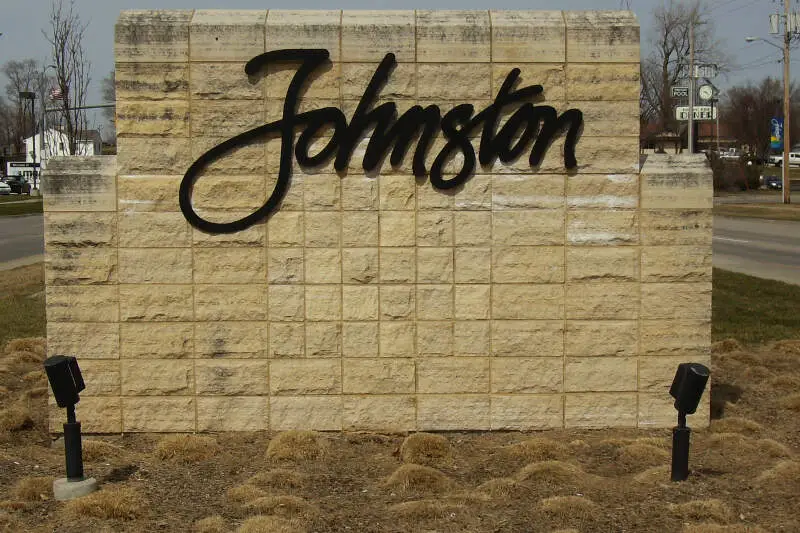
/10
Population: 24,384
% African American: 10.62%
# Of African American Residents: 2,590
Percent Change Since 2010: 6375.0%
More on Johnston: Data | Cost Of Living | Movers
6. Iowa City
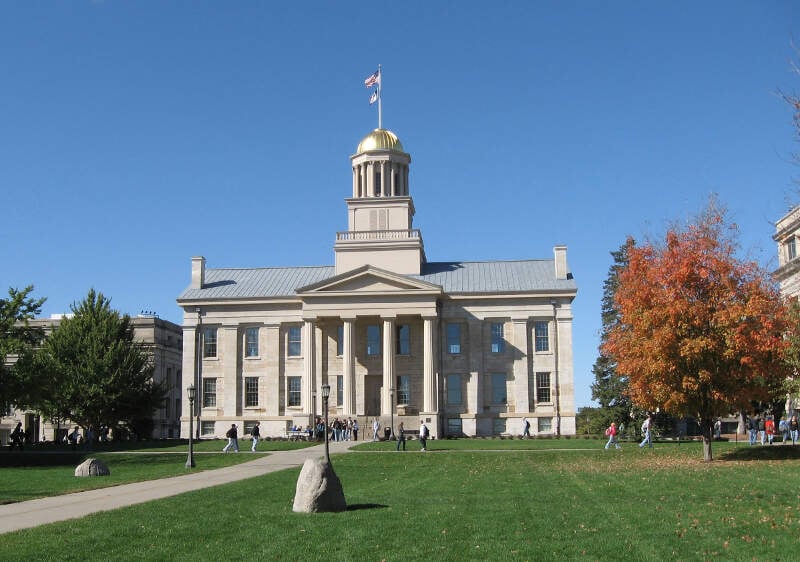
/10
Population: 75,752
% African American: 9.36%
# Of African American Residents: 7,093
Percent Change Since 2010: 146.71%
More on Iowa City: Data | Cost Of Living | Movers
7. Cedar Rapids
/10
Population: 137,264
% African American: 8.51%
# Of African American Residents: 11,682
Percent Change Since 2010: 76.31%
More on Cedar Rapids: Data | Cost Of Living | Movers
8. Hiawatha
/10
Population: 7,206
% African American: 6.76%
# Of African American Residents: 487
Percent Change Since 2010: 45.37%
More on Hiawatha: Data | Cost Of Living | Movers
9. Burlington
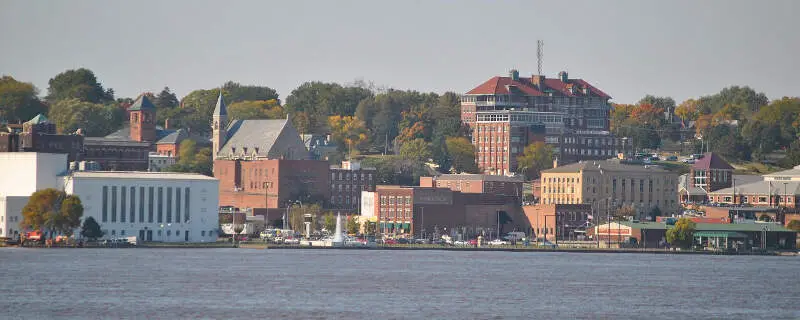
/10
Population: 23,728
% African American: 6.63%
# Of African American Residents: 1,573
Percent Change Since 2010: -9.6%
More on Burlington: Data | Cost Of Living | Movers
10. Grimes
/10
Population: 16,366
% African American: 6.18%
# Of African American Residents: 1,011
Percent Change Since 2010: inf%
More on Grimes: Data | Cost Of Living | Movers
Methodology: How We Determined The Cities In Iowa With The Largest Black Population For 2026
We still believe in the accuracy of data — especially from the Census. So that’s where we went to get the race breakdown across Iowa.
That leads us to the Census’s most recently available data, the 2020-2024 American Community Survey data from the US Census.
Specifically, we looked at table B03002: Hispanic OR LATINO ORIGIN BY RACE. Here are the category names as defined by the Census:
- Hispanic or Latino
- White alone*
- Black or African American alone*
- American Indian and Alaska Native alone*
- Asian alone*
- Native Hawaiian and Other Pacific Islander alone*
- Some other race alone*
- Two or more races*
Our particular column of interest was the number of people who identified as Black or African American.
We limited our analysis to non-CDPs with a population greater than 5,000 people in Iowa. That left us with 76 cities.
We then calculated the percentage of residents that are Black or African American. The percentages ranked from 16.4% to 0.1%.
Finally, we ranked each city based on the percentage of the Black population, with a higher score being more Black than a lower score. Waterloo took the distinction of being the most Black, while Norwalk was the least African American city.
We updated this article for 2026. This is our eleventh time ranking the cities in Iowa with the largest African American population.
Read on for more information on how the cities in Iowa ranked by population of African American residents or, for a more general take on diversity in America, head over to our ranking of the most diverse cities in America.
Summary: Black Populations Across Iowa
If you’re looking for a breakdown of African American populations across Iowa according to the most recent data, this is an accurate list.
The blackest cities in Iowa are Waterloo, Coralville, Des Moines, Davenport, Johnston, Iowa City, Cedar Rapids, Hiawatha, Burlington, and Grimes.
If you’re curious enough, here are the least African American places in Iowa:
- Norwalk
- Oelwein
- Glenwood
For more Iowa reading, check out:
African American Population By City In Iowa
| Rank | City | Population | African American Population | % African American |
|---|---|---|---|---|
| 1 | Waterloo | 67,008 | 11,004 | 16.42% |
| 2 | Coralville | 23,234 | 3,114 | 13.4% |
| 3 | Des Moines | 212,421 | 23,574 | 11.1% |
| 4 | Davenport | 100,913 | 11,086 | 10.99% |
| 5 | Johnston | 24,384 | 2,590 | 10.62% |
| 6 | Iowa City | 75,752 | 7,093 | 9.36% |
| 7 | Cedar Rapids | 137,264 | 11,682 | 8.51% |
| 8 | Hiawatha | 7,206 | 487 | 6.76% |
| 9 | Burlington | 23,728 | 1,573 | 6.63% |
| 10 | Grimes | 16,366 | 1,011 | 6.18% |
| 11 | Anamosa | 5,629 | 338 | 6.0% |
| 12 | Sioux City | 86,101 | 5,117 | 5.94% |
| 13 | Le Mars | 10,640 | 590 | 5.55% |
| 14 | Clinton | 24,322 | 1,290 | 5.3% |
| 15 | Altoona | 21,495 | 1,106 | 5.15% |
| 16 | Waukee | 29,236 | 1,478 | 5.06% |
| 17 | West Des Moines | 71,083 | 3,581 | 5.04% |
| 18 | Urbandale | 46,595 | 2,214 | 4.75% |
| 19 | Mount Pleasant | 8,951 | 424 | 4.74% |
| 20 | Fort Dodge | 24,827 | 1,149 | 4.63% |
| 21 | Clarinda | 5,353 | 223 | 4.17% |
| 22 | Dubuque | 59,174 | 2,426 | 4.1% |
| 23 | North Liberty | 21,125 | 852 | 4.03% |
| 24 | Ottumwa | 25,430 | 1,023 | 4.02% |
| 25 | Fairfield | 9,456 | 368 | 3.89% |
| 26 | Pleasant Hill | 11,136 | 429 | 3.85% |
| 27 | Ames | 67,669 | 2,579 | 3.81% |
| 28 | Storm Lake | 11,428 | 431 | 3.77% |
| 29 | Muscatine | 23,489 | 839 | 3.57% |
| 30 | Fort Madison | 10,133 | 354 | 3.49% |
| 31 | Keokuk | 9,662 | 308 | 3.19% |
| 32 | Red Oak | 5,510 | 167 | 3.03% |
| 33 | Clive | 19,012 | 548 | 2.88% |
| 34 | Mason City | 27,050 | 772 | 2.85% |
| 35 | Council Bluffs | 62,586 | 1,671 | 2.67% |
| 36 | Sheldon | 5,474 | 143 | 2.61% |
| 37 | Marion | 41,896 | 1,078 | 2.57% |
| 38 | Bettendorf | 39,647 | 1,010 | 2.55% |
| 39 | Ankeny | 72,615 | 1,807 | 2.49% |
| 40 | Waverly | 10,494 | 256 | 2.44% |
| 41 | Maquoketa | 6,075 | 142 | 2.34% |
| 42 | Marshalltown | 27,626 | 586 | 2.12% |
| 43 | Estherville | 5,839 | 117 | 2.0% |
| 44 | Charles City | 7,232 | 141 | 1.95% |
| 45 | Iowa Falls | 5,038 | 91 | 1.81% |
| 46 | Atlantic | 6,763 | 118 | 1.74% |
| 47 | Oskaloosa | 11,504 | 195 | 1.7% |
| 48 | Grinnell | 9,505 | 148 | 1.56% |
| 49 | Denison | 8,260 | 123 | 1.49% |
| 50 | Newton | 15,700 | 228 | 1.45% |
| 51 | Winterset | 5,416 | 74 | 1.37% |
| 52 | Cedar Falls | 40,888 | 555 | 1.36% |
| 53 | Independence | 6,164 | 82 | 1.33% |
| 54 | Boone | 12,424 | 160 | 1.29% |
| 55 | Orange City | 6,426 | 77 | 1.2% |
| 56 | Webster City | 7,769 | 91 | 1.17% |
| 57 | Decorah | 7,535 | 81 | 1.07% |
| 58 | Centerville | 5,372 | 54 | 1.01% |
| 59 | Indianola | 16,044 | 160 | 1.0% |
| 60 | Eldridge | 6,818 | 64 | 0.94% |
| 61 | Creston | 7,435 | 68 | 0.91% |
| 62 | Carroll | 10,208 | 80 | 0.78% |
| 63 | Perry | 7,985 | 56 | 0.7% |
| 64 | Washington | 7,290 | 51 | 0.7% |
| 65 | Sioux Center | 8,454 | 53 | 0.63% |
| 66 | Nevada | 6,983 | 35 | 0.5% |
| 67 | Pella | 10,720 | 41 | 0.38% |
| 68 | Spencer | 11,400 | 40 | 0.35% |
| 69 | Cherokee | 5,154 | 18 | 0.35% |
| 70 | Knoxville | 7,473 | 20 | 0.27% |
| 71 | Clear Lake | 7,607 | 18 | 0.24% |
| 72 | Algona | 5,377 | 12 | 0.22% |
| 73 | Manchester | 5,191 | 11 | 0.21% |
| 74 | Glenwood | 5,144 | 8 | 0.16% |
| 75 | Oelwein | 5,834 | 7 | 0.12% |
| 76 | Norwalk | 14,183 | 9 | 0.06% |