
Most African American cities in Maryland research summary. We used Saturday Night Science to analyze Maryland’s most recent Census data to determine the blackest cities in Maryland based on the percentage of Black residents. Here are the results of our analysis:
The city with the largest African American population in Maryland is District Heights based on the most recent Census data.
District Heights is 82.3% Black.
The least African American city in Maryland is Thurmont.
Thurmont is 1.3% Black.
Maryland is 28.9% Black.
Maryland is the 4th blackest state in the United States.
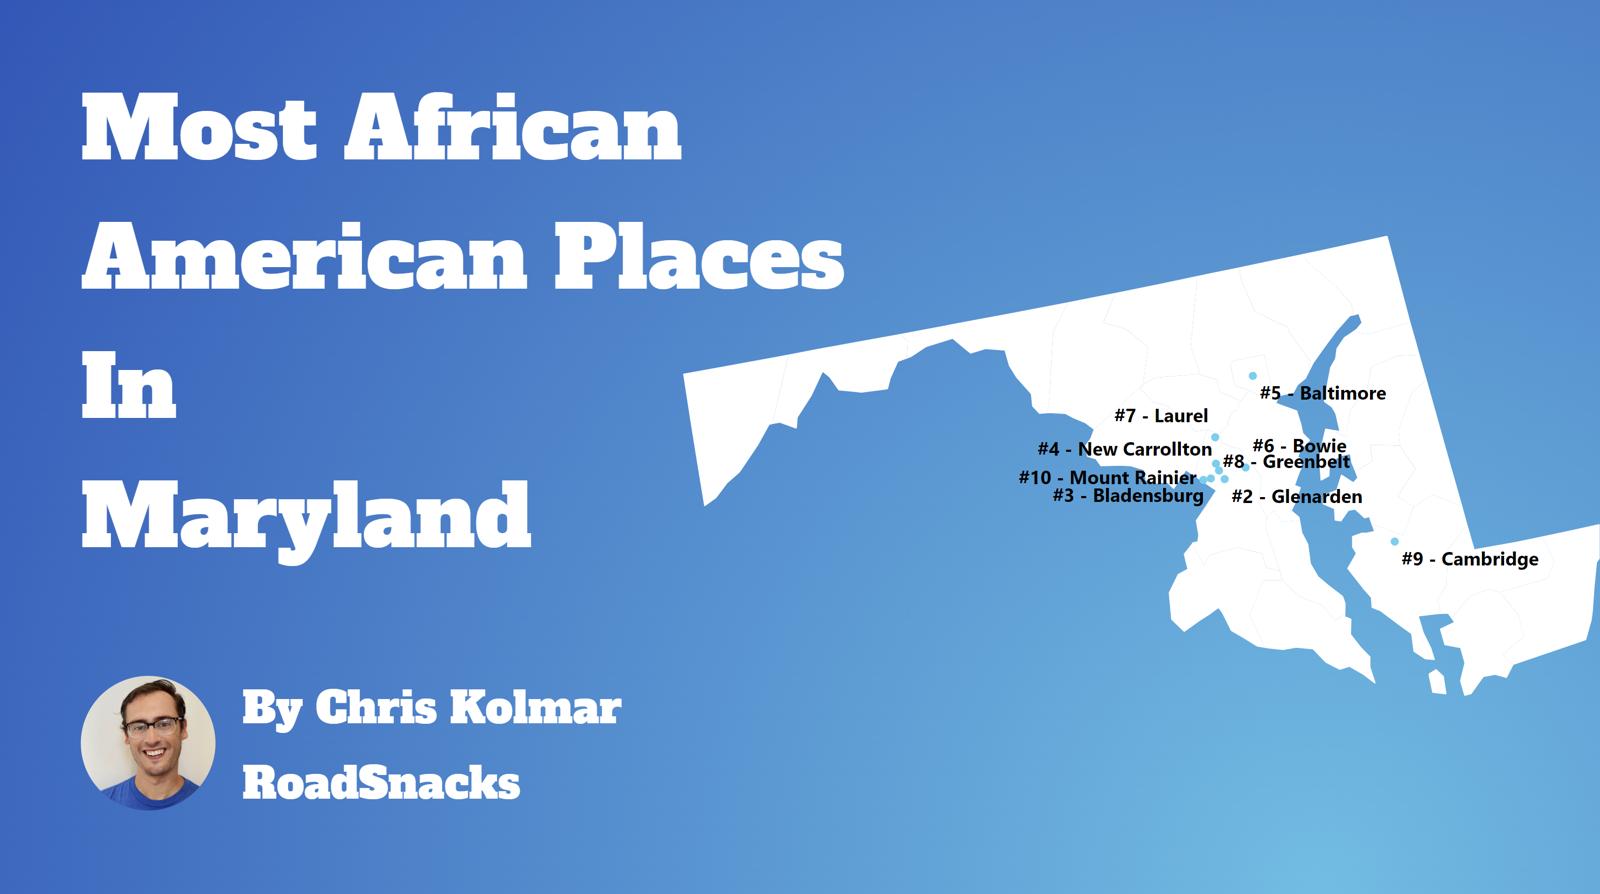
Table Of Contents: Top Ten | Methodology | Summary | Table
The Black community is one of the fastest-growing communities in America this decade.
Roughly 42 million people identifying as Black or African American live in the United States, making up 12% of the total population. According to the most recent American Community Survey, the Black population in Maryland is 1,796,433 – at 28.9% of the total population of Maryland.
The percentage growth of Blacks in America is the third largest percentage change for any race according to the Census’s race and ethnicity definition. Most scholars and historians agree that increasing diversity in America is a good thing.
We agree.
But how has the increase in the black population impacted Maryland? Which cities and towns in Maryland have seen the greatest increase in its Black population?
We broke down the most recent census data to determine the cities in Maryland with the largest African American population in 2026:
Most African American Places In Maryland
What’s the blackest city in Maryland? The city with the largest Black population in Maryland for 2026 is District Heights. See if District Heights ranked as one of the most african american places in America.
And if you already knew these places were Black, check out the best places to live in Maryland or the most diverse places in Maryland. Population: 5,891 Population: 6,344 Population: 573,243 Population: 13,564 Population: 9,583 Population: 57,926 Population: 29,798 Population: 24,678 Population: 6,096 Population: 13,152The 10 Blackest Cities In Maryland For 2026
1. District Heights
/10
% African American: 82.3%
# Of African American Residents: 4,848
Percent Change Since 2010: -6.81%
More on District Heights: Data | Cost Of Living | Movers2. Glenarden
/10
% African American: 73.41%
# Of African American Residents: 4,657
Percent Change Since 2010: -15.73%
More on Glenarden: Data | Cost Of Living | Movers3. Baltimore
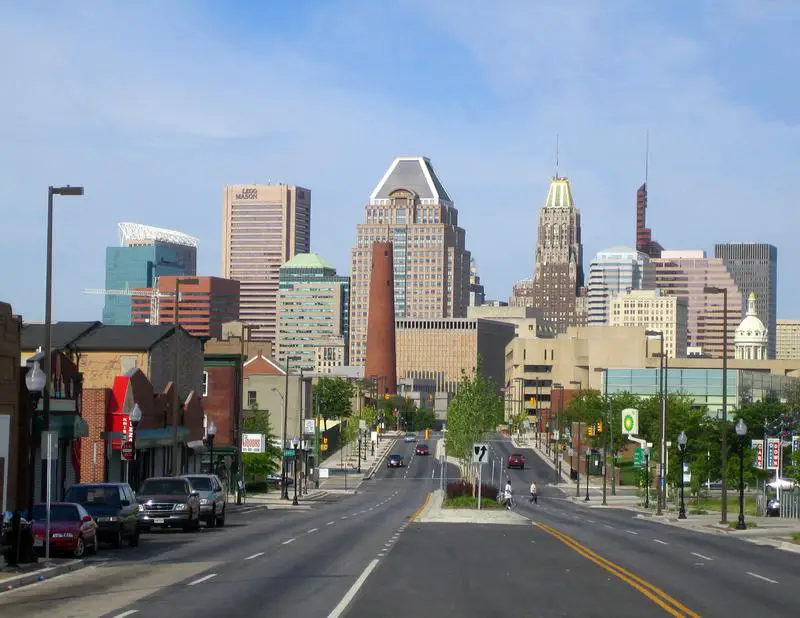
/10
% African American: 58.52%
# Of African American Residents: 335,489
Percent Change Since 2010: -15.52%
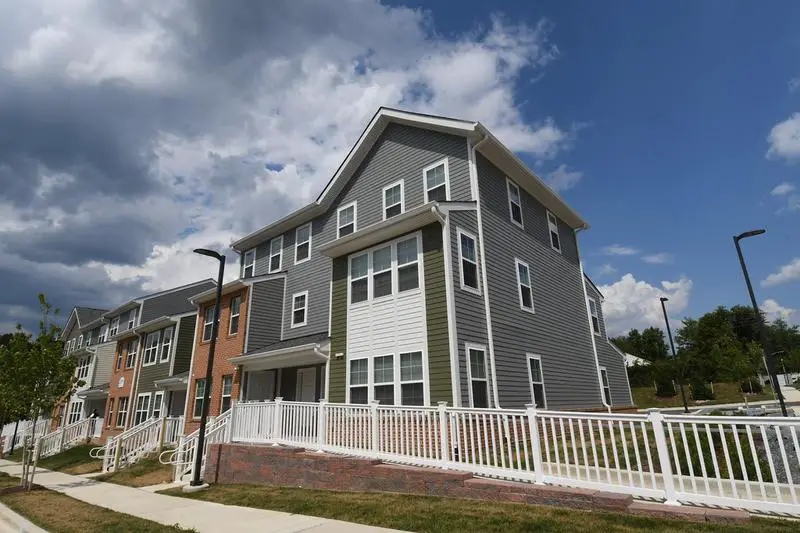
More on Baltimore: Data | Cost Of Living | Movers4. New Carrollton
/10
% African American: 55.94%
# Of African American Residents: 7,588
Percent Change Since 2010: 12.48%
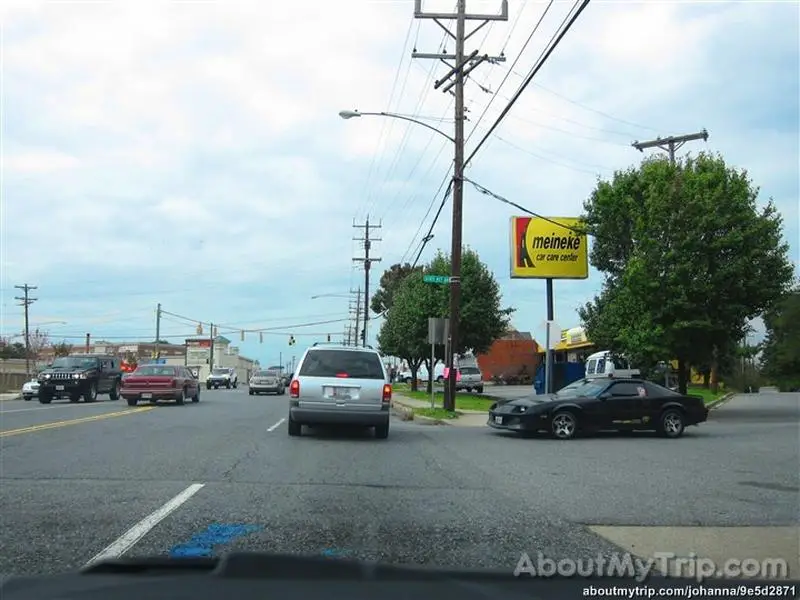
More on New Carrollton: Data | Cost Of Living | Movers5. Bladensburg
/10
% African American: 53.64%
# Of African American Residents: 5,140
Percent Change Since 2010: -12.36%
More on Bladensburg: Data | Cost Of Living | Movers6. Bowie
/10
% African American: 53.37%
# Of African American Residents: 30,914
Percent Change Since 2010: 24.26%
More on Bowie: Data | Cost Of Living | Movers7. Laurel
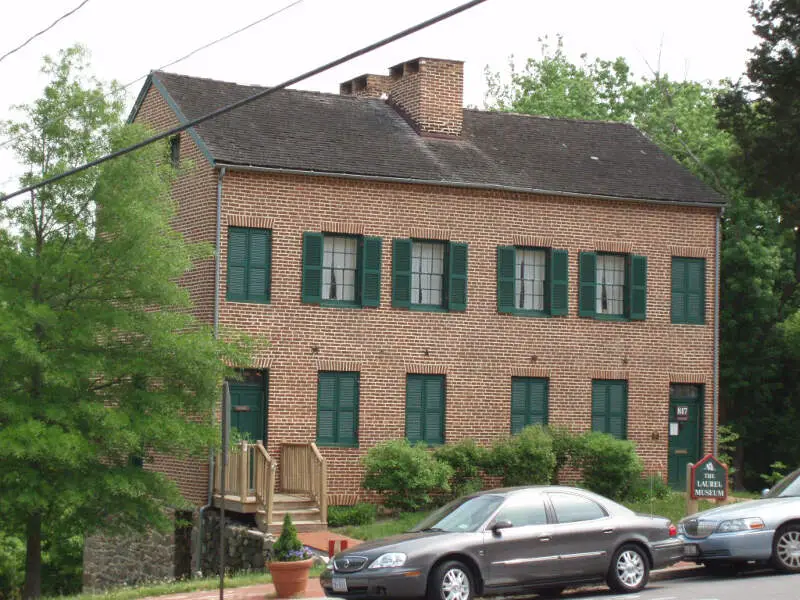
/10
% African American: 52.31%
# Of African American Residents: 15,588
Percent Change Since 2010: 35.01%
More on Laurel: Data | Cost Of Living | Movers8. Greenbelt
/10
% African American: 47.95%
# Of African American Residents: 11,832
Percent Change Since 2010: 6.61%
More on Greenbelt: Data | Cost Of Living | Movers9. Cheverly
/10
% African American: 44.7%
# Of African American Residents: 2,725
Percent Change Since 2010: -12.24%
More on Cheverly: Data | Cost Of Living | Movers10. Cambridge
/10
% African American: 43.67%
# Of African American Residents: 5,744
Percent Change Since 2010: 4.61%
More on Cambridge: Data | Cost Of Living | Movers
We still believe in the accuracy of data — especially from the Census. So that’s where we went to get the race breakdown across Maryland. That leads us to the Census’s most recently available data, the 2020-2024 American Community Survey data from the US Census. Specifically, we looked at table B03002: Hispanic OR LATINO ORIGIN BY RACE. Here are the category names as defined by the Census: Our particular column of interest was the number of people who identified as Black or African American. We limited our analysis to non-CDPs with a population greater than 5,000 people in Maryland. That left us with 39 cities. We then calculated the percentage of residents that are Black or African American. The percentages ranked from 82.3% to 1.3%. Finally, we ranked each city based on the percentage of the Black population, with a higher score being more Black than a lower score. District Heights took the distinction of being the most Black, while Thurmont was the least African American city. We updated this article for 2026. This is our eleventh time ranking the cities in Maryland with the largest African American population. Read on for more information on how the cities in Maryland ranked by population of African American residents or, for a more general take on diversity in America, head over to our ranking of the most diverse cities in America.Methodology: How We Determined The Cities In Maryland With The Largest Black Population For 2026
Summary: Black Populations Across Maryland
If you’re looking for a breakdown of African American populations across Maryland according to the most recent data, this is an accurate list.
The blackest cities in Maryland are District Heights, Glenarden, Baltimore, New Carrollton, Bladensburg, Bowie, Laurel, Greenbelt, Cheverly, and Cambridge.
If you’re curious enough, here are the least African American places in Maryland:
- Thurmont
- Ocean City
- Mount Airy
For more Maryland reading, check out:
- Cheapest Places To Live In Maryland
- Best Places To Live In Maryland
- Best Places To Raise A Family In Maryland
African American Population By City In Maryland
| Rank | City | Population | African American Population | % African American |
|---|---|---|---|---|
| 1 | District Heights | 5,891 | 4,848 | 82.3% |
| 2 | Glenarden | 6,344 | 4,657 | 73.41% |
| 3 | Baltimore | 573,243 | 335,489 | 58.52% |
| 4 | New Carrollton | 13,564 | 7,588 | 55.94% |
| 5 | Bladensburg | 9,583 | 5,140 | 53.64% |
| 6 | Bowie | 57,926 | 30,914 | 53.37% |
| 7 | Laurel | 29,798 | 15,588 | 52.31% |
| 8 | Greenbelt | 24,678 | 11,832 | 47.95% |
| 9 | Cheverly | 6,096 | 2,725 | 44.7% |
| 10 | Cambridge | 13,152 | 5,744 | 43.67% |
| 11 | Mount Rainier | 8,245 | 3,560 | 43.18% |
| 12 | Salisbury | 33,285 | 13,493 | 40.54% |
| 13 | La Plata | 10,683 | 3,820 | 35.76% |
| 14 | Takoma Park | 17,632 | 5,148 | 29.2% |
| 15 | Aberdeen | 17,298 | 4,995 | 28.88% |
| 16 | Riverdale Park | 7,270 | 1,789 | 24.61% |
| 17 | Hyattsville | 20,966 | 5,088 | 24.27% |
| 18 | College Park | 34,540 | 8,151 | 23.6% |
| 19 | Cheste | 5,594 | 1,237 | 22.11% |
| 20 | Hagerstown | 43,665 | 9,150 | 20.95% |
| 21 | Annapolis | 40,720 | 8,236 | 20.23% |
| 22 | Havre De Grace | 14,994 | 2,852 | 19.02% |
| 23 | Frederick | 83,395 | 14,204 | 17.03% |
| 24 | Elkton | 15,910 | 2,635 | 16.56% |
| 25 | Easton | 17,308 | 2,719 | 15.71% |
| 26 | Gaithersburg | 69,825 | 10,219 | 14.64% |
| 27 | Frostburg | 6,977 | 799 | 11.45% |
| 28 | Rockville | 67,671 | 7,462 | 11.03% |
| 29 | Taneytown | 7,932 | 732 | 9.23% |
| 30 | Brunswick | 8,450 | 708 | 8.38% |
| 31 | Westminster | 20,445 | 1,634 | 7.99% |
| 32 | Chesapeake Beach | 6,456 | 493 | 7.64% |
| 33 | Walkersville | 6,414 | 481 | 7.5% |
| 34 | Bel Air | 10,585 | 459 | 4.34% |
| 35 | Cumberland | 18,804 | 767 | 4.08% |
| 36 | Hampstead | 6,251 | 205 | 3.28% |
| 37 | Mount Airy | 9,805 | 251 | 2.56% |
| 38 | Ocean City | 6,903 | 107 | 1.55% |
| 39 | Thurmont | 6,254 | 81 | 1.3% |
Wanting more illiterate and violent people in the name of diversity is about as stupid as it gets. The author of this idiotic article is a moron.
The author has provided a valuable perspective on race in Maryland. Knowing that ten significant cities in the state have a substantial Black population underlines the diversity in the state and hopefully a decline in white nationalism. As for the previous comment the most violent people in the country and the state are probably gun loving whites who unfortunately kill themselves as the suicide rates vastly out strip the homicide rates. Go figure.