
No one wants to believe that they live in a dangerous city. But the fact is that your city may not be as safe as the city next door.
But instead of running and hiding under the covers, it’s better to get informed — which cities in America should you pay a little more attention to your surroundings as you walk home from work?
What is the most dangerous city in America? It turns out that, based on the most recent FBI Crime data, Memphis, TN has attained the throne of the city with the highest crime rate. It ranked as the most dangerous city in America for 2026 based on the data.
This is our tenth time ranking the most dangerous cities in the United States using Saturday Night Science.
Table Of Contents: Top Ten | Methodology | Summary | Table
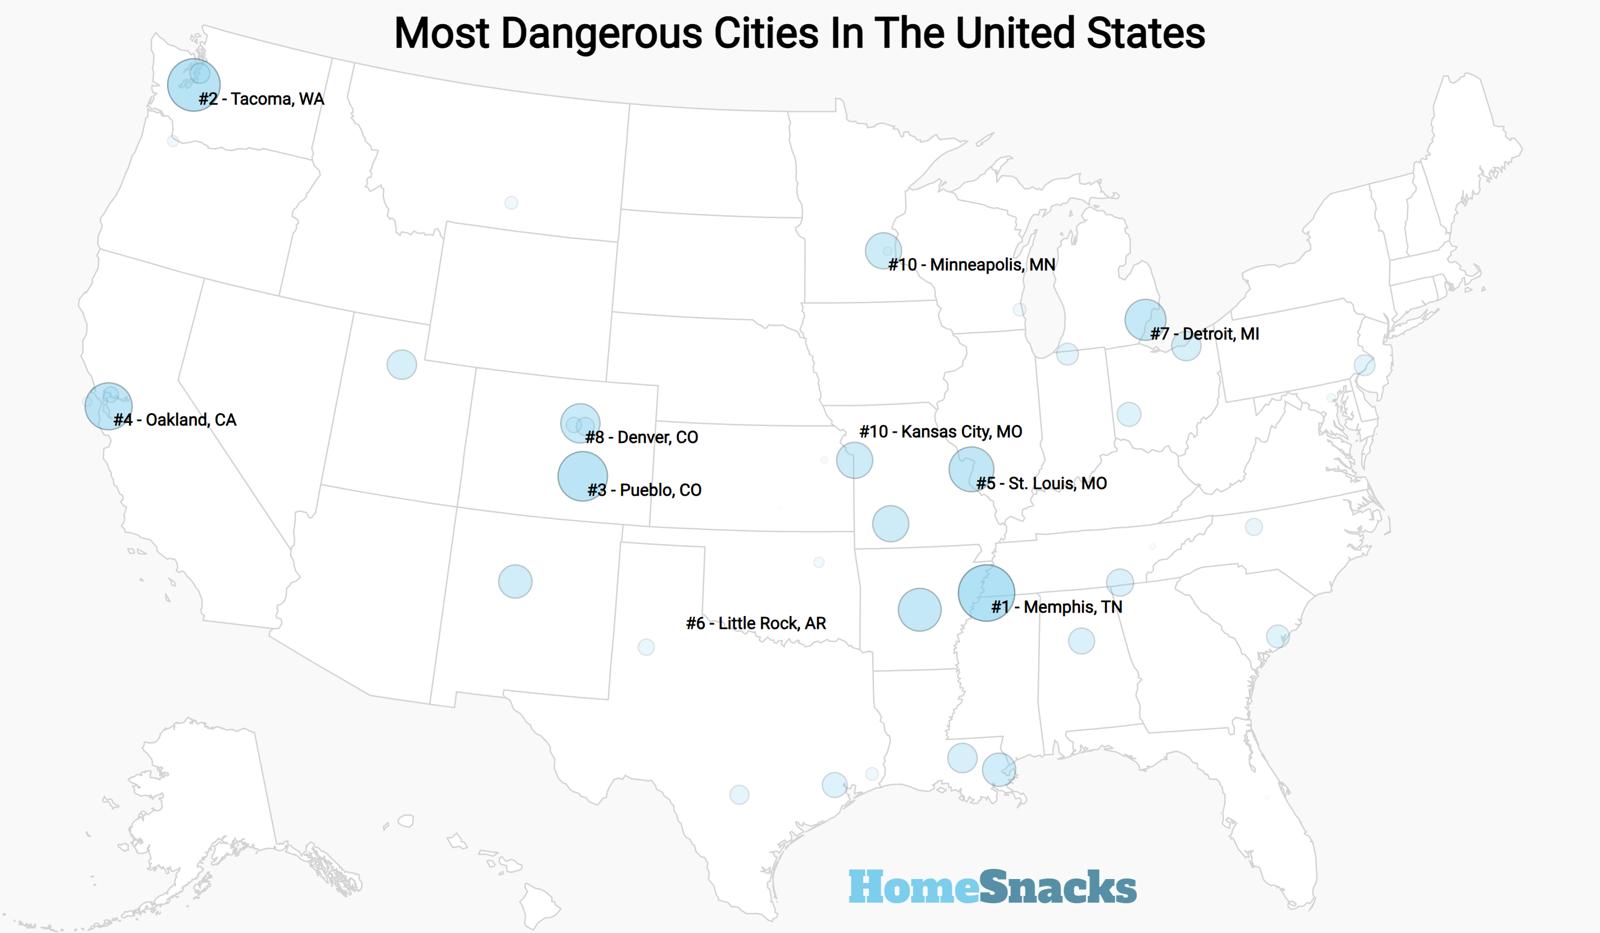
The 10 Most Dangerous Cities In The US For 2026
You might be thinking to yourself at this point — where’s Chicago? Isn’t that some kind of post-apocalyptic, world war 3 type city?
Well, it actually ranks outside the top 100 on the most dangerous list with a pretty normal overall crime rate.
And while these places are some of the most dangerous in America, you have to remember America is a safe place to live relative to the rest of the world. Be glad you don’t live in Caracas, Venezuela where the murder rate is 2x higher than any US City (Here’s looking at you Detroit).
Read on to learn more about our methodology or skip to the end for a full chart of the data with the crime rate for each city.
Or for more reading on places across America check out:
- Safest Cities By State
- Best Places By State
- Top 20 Best Cities To Retire To In America
- Best States To Raise A Family In America
- Best Places For Families By State
The 10 Most Dangerous Cities In The United States For 2026


/10
Population: 613,207
Violent Crimes Per 100k: 2,501 (most dangerous)
Property Crimes Per 100k: 6,898 (2nd most dangerous)
More on Memphis: Data | Crime | Cost Of Living | Real Estate
Now to Tennessee we go, and we visit Memphis, the most dangerous city in America. Memphis is the largest city in the top ten, and it’s also the most violent of all the cities we’re going to talk about.
That means Memphis is rough.
Memphis may just be the worst city in America in many categories. Residents faced a 1 in 49 chance of being raped, assaulted, or murdered last year which is a 5% higher rate than the previous reporting year. There are perhaps 10,000 gang members in Shelby County. Why is Tennessee so violent? Like many of the states we’ve discussed earlier, poverty, high drug use and a lack of solid jobs are all contributing factors. A lot of property crime from druggies and other low lifes breaking into property, looking for drugs or money for drugs
Seems like they can’t find enough cops in Memphis to deal with the some of the people who make their city such a dangerous one.

I live in memphis and I’ve never seen a single shooting happen near me. I must be in a calmer area

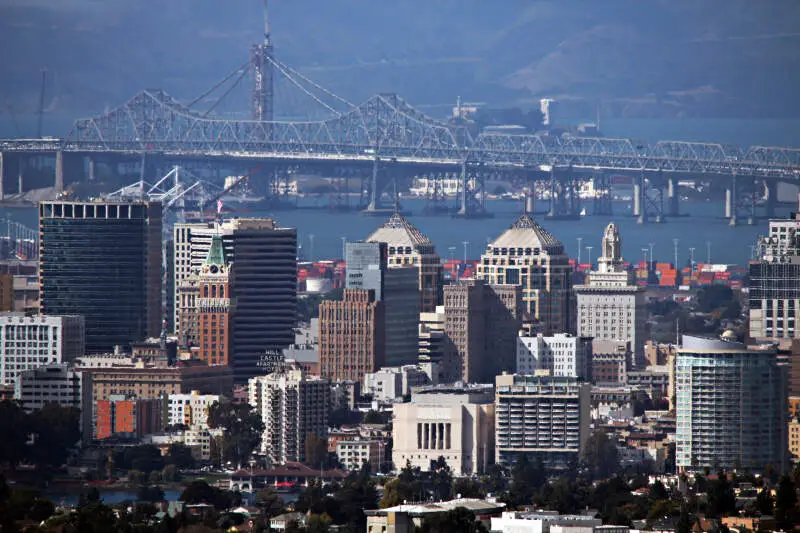
/10
Population: 435,042
Violent Crimes Per 100k: 1,925 (2nd most dangerous)
Property Crimes Per 100k: 7,230 (most dangerous)
More on Oakland: Data | Crime | Cost Of Living | Real Estate
Oakland, Oaktown, O-Town, Bump City. You get the point.
While people continue to migrate from San Francisco to Oakland to avoid insane property prices, they aren’t moving to avoid crime. Oakland ranks over thirty spots higher than San Francisco on the crime ranking. Oakland has the 10th highest violent crime rank in the country and the fifteenth highest property crime rate. There’s even a Wikipedia page devoted to crime in Oakland.
In many areas of Oakland, you don’t want to drive through at night. About 80 people a year get killed in Oakland – which is about once every four days. If you’re young, black and poor, statistically, you will look like you’re in a gang. And if you’re a white guy driving a Prius, looking for directions, well, that just won’t go over very well.
To everybody thinking about moving to Oakland : It’s dreadful, horrible chaos. Please just stay where you are.
Actually, Oakland s a wonderful place to live. We just don’t need any more people here. Really.
Bad: weather. Bad: diverse, fun population. You’ve been warned. Lol

/10
Population: 204,247
Violent Crimes Per 100k: 1,671 (4th most dangerous)
Property Crimes Per 100k: 5,214 (7th most dangerous)
More on Little Rock: Data | Crime | Cost Of Living | Real Estate
We go a couple of states over, in Arkansas, where we visit Little Rock.
Arkansas is another poor state in the south with a far-higher than average number of murders, rapes, assaults and robberies per capita. If you live in the Natural State, don’t leave your car doors unlocked; there were more than 7,100 vehicles stolen in the state of Arkansas in 2017.
Little Rock is rough. It’s in the top 5 for both violent AND property crimes in America. It’s always on some list of most dangerous places in the US for one year or another. For a city its size, 50 murders a year is sky high. It’s not Memphis rough, but in a lot of places, it’s straight dangerous.

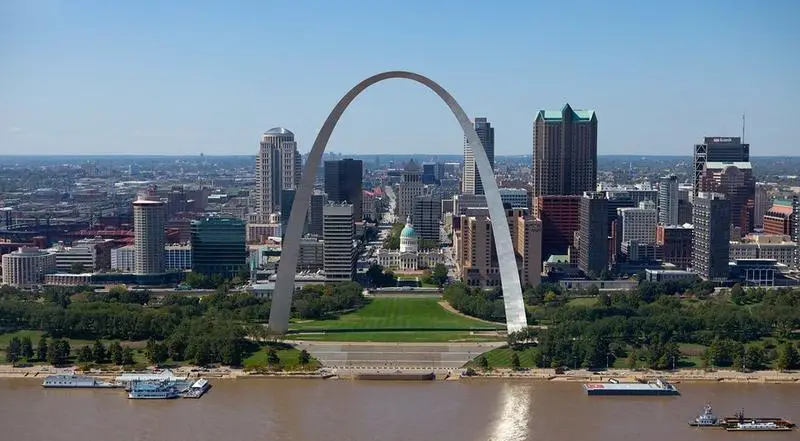
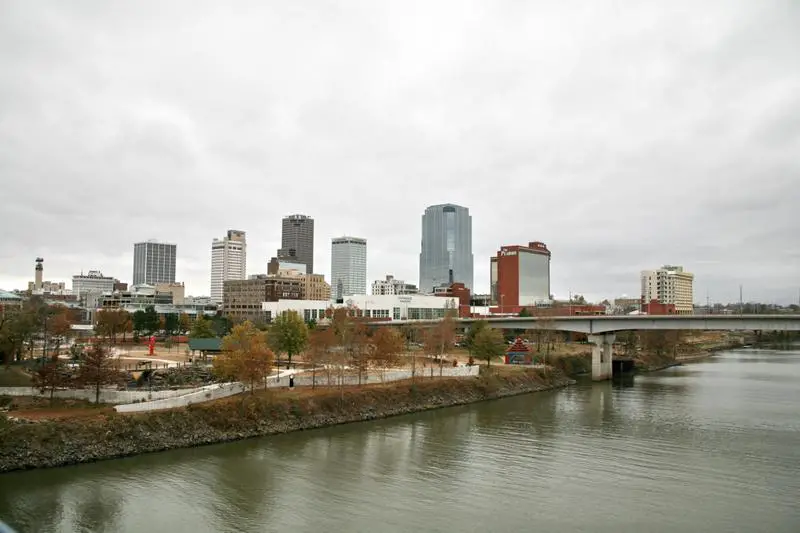
/10
Population: 277,294
Violent Crimes Per 100k: 1,367 (10th most dangerous)
Property Crimes Per 100k: 5,706 (3rd most dangerous)
More on St. Louis: Data | Crime | Cost Of Living | Real Estate
And where’s the 4th most dangerous city in the United States? That would be St. Louis.
St. Louis ranks as the 10th most violent place you can live in the nation. And have you ever heard of East St. Louis? That’s not even in the same state of St. Louis, and that place makes most small towns look like a fairytale. Last year, more than 200 people were murdered in St Louis. That’s like 2 out of three days that someone here gets ghosted.
Sure, most of the crimes that happen here are between rival gangs, and within certain neighborhoods. But that doesn’t mean the violence doesn’t spill into other parts of St. Louis. Fact is, if you live in St. Louis, you can’t feel safe at all.
As the sun sets in St. Louis each day, MOST of the city’s hard working, church going, community loving people are safe. But never really safe.
Being in a new place is so different,everything is different but the people are great. I got tot meet some really good people along the way.
Of course the Arch stands out more than anything else in St. Louis. There is no bad side to it at all


/10
Population: 110,805
Violent Crimes Per 100k: 1,424 (9th most dangerous)
Property Crimes Per 100k: 4,942 (11th most dangerous)
More on Pueblo: Data | Crime | Cost Of Living | Real Estate
Making our way out west, we take a quick stop in the city of Pueblo, Colorado.
There are many people who live in Colorado, who defend Colorado, but you can’t defend Pueblo. This small city of around 100,000 people ranks as the 11th worst place in the nation for property crimes. That means lots of stolen cars, cell phones and even toys.
Now if you read the forums, it sounds like people who live in Pueblo are pretty defensive about their city being classified as dangerous. Either they’re in denial, or they don’t really seem to notice how bad things really are in their city. Hopefully the people who do want Pueblo to clean up its act get the support from their law enforcement agencies.
I live in Pueblo. I knew it was gonna be #1 !,


/10
Population: 511,535
Violent Crimes Per 100k: 1,547 (7th most dangerous)
Property Crimes Per 100k: 4,676 (16th most dangerous)
More on Kansas City: Data | Crime | Cost Of Living | Real Estate

/10
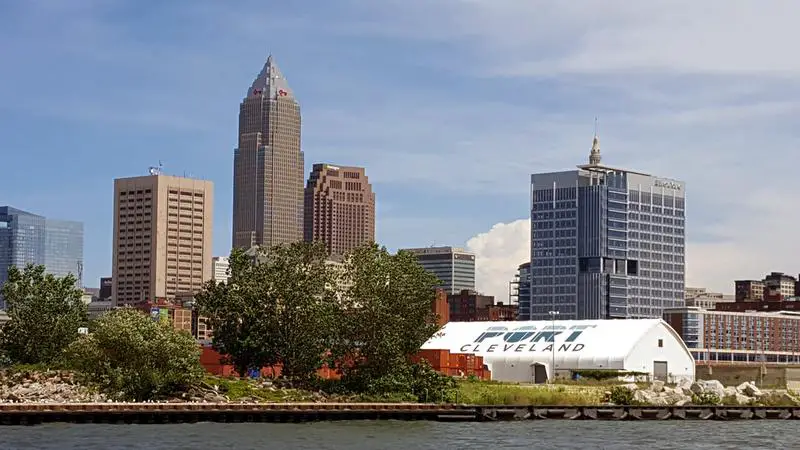
Population: 362,762
Violent Crimes Per 100k: 1,561 (6th most dangerous)
Property Crimes Per 100k: 4,426 (20th most dangerous)
More on Cleveland: Data | Crime | Cost Of Living | Real Estate
Like many former industrial hubs scattered along the Great Lakes, Cleveland has faced economic dislocation in recent decades. The changing financial situation has manifested itself in increased crime, leaving this city of 362,762 one of the country’s most violent places.
Violent crimes happen at a rate of 1,561 per 100k people. That means that over the course of a year, Cleveland will see 5,663 such incidents. This includes 109 murders.
Still, life in Cleveland isn’t all bad. The city has its attractions, such as the Rock and Roll Hall of Fame and the Cleveland Museum of Art.
I love the city i live in because of the people and the schools system are good for my children.
My city have the rock&roll hall of fame and tower city. Also we have lake erie where i go fishing.

/10
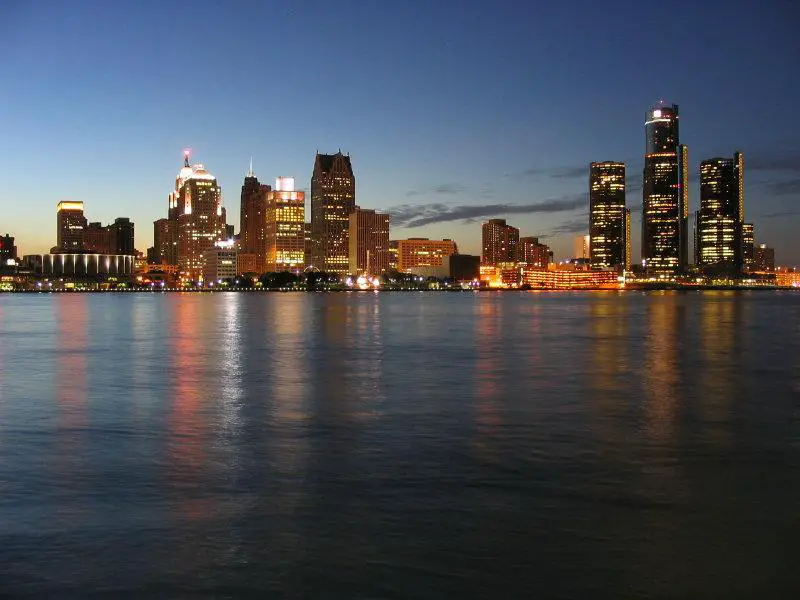
Population: 651,171
Violent Crimes Per 100k: 1,781 (3rd most dangerous)
Property Crimes Per 100k: 4,305 (23rd most dangerous)
More on Detroit: Data | Crime | Cost Of Living | Real Estate
Despite the downfalls the city has/is facing it is still a place full of culture and history. I LOVE the fact that they are so sports orientated. I grew up being a huge fan of sports and there is no bigger sports town than Detroit. Redwings, Pistons, Tigers and Lions are all supported with large amounts of pride!
Joe Louis Arena, Comerica Park, the new football and hockey arenas. The hockeytown cafe all the casinos and the theater. There is so much history and so much pride in the historical places still!

/10
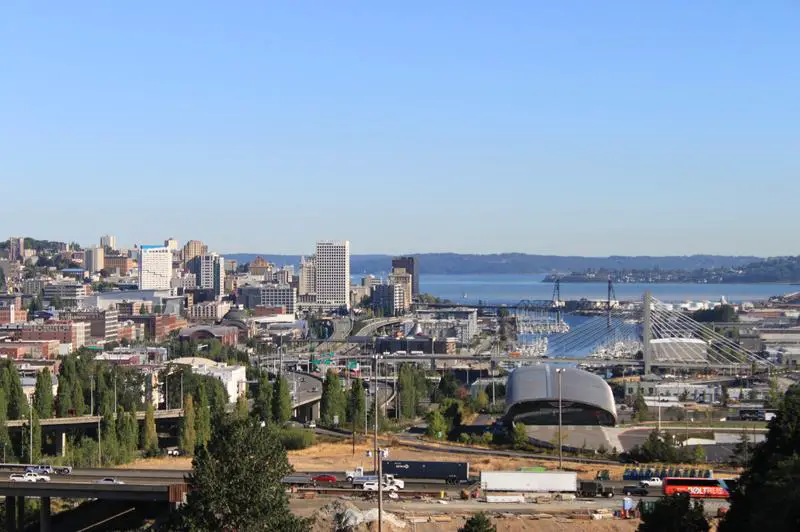
Population: 223,980
Violent Crimes Per 100k: 1,063 (24th most dangerous)
Property Crimes Per 100k: 5,603 (4th most dangerous)
More on Tacoma: Data | Crime | Cost Of Living | Real Estate
i live in Tacoma, and it really isn’t that bad imo

/10
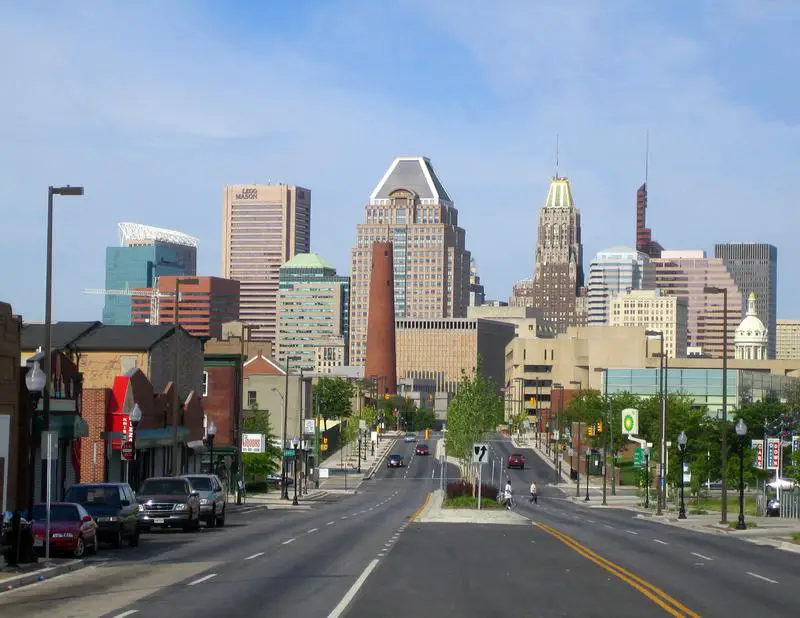
Population: 566,632
Violent Crimes Per 100k: 1,606 (5th most dangerous)
Property Crimes Per 100k: 4,157 (28th most dangerous)
More on Baltimore: Data | Crime | Cost Of Living | Real Estate
The city has a crime problem, but the citizens of Baltimore are actively working to make their city better. Inner Harbor is beautiful, of course, but the city as a whole is crammed with interesting places to eat and shop. Some of the markets are excellent for people-watching as well as shopping.
Patapsco flea market! Seafood! Ram’s Head Live! Reasonable parking rates!
Methodology: How We Determined The Most Dangerous Cities In The US For 2026
Every year the FBI release two crime datasets, a preliminary dataset limited to the biggest cities in the country, followed by a more detailed release at the end of the year.
For our analysis, we used Saturday Night Science and focused on the recently released Uniform Crime Report.
So what criteria did we use? Have a look:
- Violent Crimes Per Capita
- Property Crimes Per Capita
We ranked each city from 1 to 214 for the two criteria with 1 being the most dangerous score. We then averaged the two rankings into one “Dangerous Index”.
Finally, we ranked every city on the “Dangerous Index” with the lowest index being the most dangerous in the country — Memphis. Read on for a bit more on why these cities have such high crime rates.
We updated this article for 2026. This is our eleventh time ranking the most dangerous cities in America. This article is an opinion based on facts and is meant as infotainment — don’t freak out.
Or check out the safest cities in America.
Summary: The Most Dangerous Cities In The US
The final returns from the FBI’s data set show that Memphis ranks as the most dangerous city in America for 2026.
The most dangerous cities in the United States are Memphis, TN, Oakland, CA, Little Rock, AR, St. Louis, MO, Pueblo, CO, Kansas City, MO, Cleveland, OH, Detroit, MI, Tacoma, WA, and Baltimore, MD.
However, there will be a new data set coming out early this year. At that point we can revisit Memphis’s status — that is if they haven’t beaten us all up already.
Here’s a look at the safest cities in America according to the data:
- Worcester
- Savannah
- Fishers
For more reading on the dangerous side check out:
Most Dangerous Cities In The United States For 2026
| Rank | City | Previous Rank | Population | Violent Crimes Per 100k | Property Crimes Per 100k | ||||
|---|---|---|---|---|---|---|---|---|---|
| 1 | Memphis, TN | 2 | 613,207 | 2,501 | 6,898 | ||||
| 2 | Oakland, CA | 1 | 435,042 | 1,925 | 7,230 | ||||
| 3 | Little Rock, AR | 4 | 204,247 | 1,671 | 5,214 | ||||
| 4 | St. Louis, MO | 3 | 277,294 | 1,367 | 5,706 | ||||
| 5 | Pueblo, CO | 6 | 110,805 | 1,424 | 4,942 | ||||
| 6 | Kansas City, MO | 9 | 511,535 | 1,547 | 4,676 | ||||
| 7 | Cleveland, OH | 8 | 362,762 | 1,561 | 4,426 | ||||
| 8 | Detroit, MI | 7 | 651,171 | 1,781 | 4,305 | ||||
| 9 | Tacoma, WA | 5 | 223,980 | 1,063 | 5,603 | ||||
| 10 | Baltimore, MD | 15 | 566,632 | 1,606 | 4,157 | ||||
| 11 | Albuquerque, NM | 14 | 558,745 | 1,181 | 4,628 | ||||
| 12 | Dayton, OH | 19 | 134,857 | 1,339 | 4,334 | ||||
| 13 | Peoria, IL | 25 | 109,677 | 1,344 | 4,284 | ||||
| 14 | Houston, TX | 22 | 2,319,160 | 1,148 | 4,293 | ||||
| 15 | Birmingham, AL | 11 | 195,418 | 1,246 | 4,031 | ||||
| 16 | Lafayette, LA | 34 | 121,471 | 1,066 | 4,347 | ||||
| 17 | Denver, CO | 13 | 722,031 | 993 | 4,761 | ||||
| 18 | Springfield, MO | 24 | 170,527 | 1,178 | 4,184 | ||||
| 19 | Shreveport, LA | 44 | 175,092 | 1,228 | 3,990 | ||||
| 20 | Salt Lake City, UT | 21 | 212,675 | 864 | 5,199 | ||||
| 21 | Springfield, IL | 32 | 111,965 | 901 | 4,911 | ||||
| 22 | Evansville, IN | 31 | 114,660 | 1,206 | 3,678 | ||||
| 23 | Philadelphia, PA | 20 | 1,549,259 | 908 | 4,548 | ||||
| 24 | Lakewood, CO | 45 | 155,868 | 787 | 5,093 | ||||
| 25 | Seattle, WA | 30 | 760,058 | 775 | 5,007 | ||||
| 26 | Kansas City, KS | 30 | 153,363 | 1,047 | 3,606 | ||||
| 27 | Portland, OR | 28 | 623,066 | 720 | 5,526 | ||||
| 28 | Tulsa, OK | 35 | 411,310 | 941 | 3,627 | ||||
| 29 | Chattanooga, TN | 18 | 188,894 | 823 | 3,942 | ||||
| 30 | Washington, DC | 27 | 702,250 | 925 | 3,588 | ||||
| 31 | Cincinnati, OH | 52 | 311,599 | 845 | 3,829 | ||||
| 32 | Las Cruces, NM | 55 | 115,977 | 719 | 4,873 | ||||
| 33 | North Charleston, SC | 26 | 123,511 | 810 | 3,955 | ||||
| 34 | Beaumont, TX | 36 | 111,320 | 1,137 | 3,302 | ||||
| 35 | Syracuse, NY | 49 | 145,175 | 765 | 4,234 | ||||
| 36 | Topeka, KS | 29 | 125,156 | 856 | 3,642 | ||||
| 37 | Greensboro, NC | 53 | 304,306 | 923 | 3,383 | ||||
| 38 | Spokane, WA | 38 | 229,529 | 674 | 4,840 | ||||
| 39 | Vallejo, CA | 43 | 121,795 | 739 | 3,990 | ||||
| 40 | Berkeley, CA | 37 | 117,400 | 638 | 5,229 | ||||
| 41 | Indianapolis, IN | 41 | 890,685 | 877 | 3,336 | ||||
| 42 | Aurora, CO | 40 | 397,852 | 947 | 3,103 | ||||
| 43 | Buffalo, NY | 46 | 273,728 | 706 | 3,809 | ||||
| 44 | Milwaukee, WI | 69 | 560,416 | 1,430 | 2,700 | ||||
| 45 | San Antonio, TX | 42 | 1,514,458 | 594 | 4,623 | ||||
| 46 | Corpus Christi, TX | 66 | 316,108 | 863 | 3,011 | ||||
| 47 | Inglewood, CA | 56 | 101,399 | 674 | 3,614 | ||||
| 48 | Columbia, SC | 68 | 144,559 | 769 | 3,232 | ||||
| 49 | San Bernardino, CA | 47 | 224,283 | 897 | 2,897 | ||||
| 50 | Colorado Springs, CO | 74 | 491,474 | 715 | 3,448 | ||||
| 51 | Durham, NC | 78 | 300,208 | 619 | 3,799 | ||||
| 52 | Anchorage, AK | 75 | 286,958 | 1,014 | 2,765 | ||||
| 53 | San Francisco, CA | 33 | 802,856 | 596 | 3,929 | ||||
| 54 | Toledo, OH | 57 | 263,668 | 1,041 | 2,732 | ||||
| 55 | Long Beach, CA | 100 | 444,232 | 676 | 3,478 | ||||
| 56 | Akron, OH | 83 | 188,223 | 820 | 2,955 | ||||
| 57 | Fresno, CA | 84 | 546,722 | 735 | 3,271 | ||||
| 58 | Winston-Salem, NC | 71 | 254,041 | 809 | 2,921 | ||||
| 59 | Springfield, MA | 79 | 155,491 | 891 | 2,835 | ||||
| 60 | Billings, MT | 50 | 122,105 | 746 | 3,083 | ||||
| 61 | Richmond, CA | 54 | 113,418 | 923 | 2,762 | ||||
| 62 | Stockton, CA | 51 | 319,069 | 1,145 | 2,639 | ||||
| 63 | Lansing, MI | 64 | 111,965 | 1,345 | 2,498 | ||||
| 64 | Albany, NY | 48 | 102,095 | 816 | 2,848 | ||||
| 65 | Dallas, TX | 63 | 1,321,502 | 658 | 3,351 | ||||
| 66 | Des Moines, IA | 80 | 209,245 | 703 | 3,126 | ||||
| 67 | Rockford, IL | 77 | 145,280 | 1,079 | 2,517 | ||||
| 68 | Costa Mesa, CA | 77 | 107,235 | 737 | 2,836 | ||||
| 69 | Independence, MO | 267 | 120,271 | 571 | 3,523 | ||||
| 70 | Fayetteville, NC | 72 | 209,945 | 660 | 3,094 | ||||
| 71 | Vancouver, WA | 59 | 198,194 | 582 | 3,407 | ||||
| 72 | Greeley, CO | 107 | 113,757 | 670 | 3,019 | ||||
| 73 | Antioch, CA | 110 | 117,675 | 606 | 3,193 | ||||
| 74 | Tucson, AZ | 110 | 548,789 | 588 | 3,313 | ||||
| 75 | New Haven, CT | 90 | 137,243 | 534 | 3,587 | ||||
| 76 | Grand Rapids, MI | 73 | 195,913 | 910 | 2,480 | ||||
| 77 | Oklahoma City, OK | 102 | 709,456 | 676 | 2,893 | ||||
| 78 | Rochester, NY | 39 | 206,093 | 582 | 3,289 | ||||
| 79 | Fargo, ND | 86 | 135,682 | 498 | 3,696 | ||||
| 80 | Lubbock, TX | 70 | 269,900 | 821 | 2,628 | ||||
| 81 | Knoxville, TN | 76 | 200,457 | 740 | 2,721 | ||||
| 82 | Chicago, IL | 89 | 2,638,698 | 539 | 3,472 | ||||
| 83 | Kent, WA | 65 | 132,324 | 489 | 3,771 | ||||
| 84 | Gainesville, FL | 92 | 147,022 | 737 | 2,703 | ||||
| 85 | Pomona, CA | 98 | 143,726 | 715 | 2,753 | ||||
| 86 | Paterson, NJ | 97 | 158,903 | 978 | 2,351 | ||||
| 87 | Norfolk, VA | 87 | 230,460 | 469 | 3,772 | ||||
| 88 | Hayward, CA | 67 | 153,419 | 477 | 3,656 | ||||
| 89 | Sacramento, CA | 85 | 526,670 | 754 | 2,547 | ||||
| 90 | Wilmington, NC | 103 | 125,101 | 482 | 3,514 | ||||
| 91 | Victorville, CA | 103 | 140,309 | 1,015 | 2,128 | ||||
| 92 | Amarillo, TX | 82 | 203,039 | 690 | 2,655 | ||||
| 93 | South Bend, IN | 81 | 103,415 | 965 | 2,044 | ||||
| 94 | Riverside, CA | 96 | 320,148 | 589 | 2,832 | ||||
| 95 | Phoenix, AZ | 106 | 1,662,809 | 799 | 2,325 | ||||
| 96 | Newport News, VA | 95 | 183,563 | 735 | 2,416 | ||||
| 97 | Mesquite, TX | 91 | 148,803 | 501 | 2,976 | ||||
| 98 | Sioux Falls, SD | 154 | 210,926 | 526 | 2,915 | ||||
| 99 | Austin, TX | 104 | 984,613 | 466 | 3,241 | ||||
| 100 | San Jose, CA | 104 | 956,840 | 606 | 2,587 | ||||
Dangerous Places By State
Most Dangerous Cities In Alaska
Most Dangerous Cities In Alabama
Most Dangerous Places In Arkansas
Most Dangerous Cities In Arizona
Most Dangerous Cities In California
Most Dangerous Cities In Colorado
Most Dangerous Cities In Connecticut
Most Dangerous Cities In Delaware
Most Dangerous Places In Florida
Most Dangerous Places In Georgia
Most Dangerous Cities In Idaho
Most Dangerous Cities In Illinois
Most Dangerous Cities In Indiana
Most Dangerous Places In Kansas
Most Dangerous Cities In Massachusetts
Most Dangerous Cities In Maryland
Most Dangerous Cities In Maine
Most Dangerous Places In Michigan
Most Dangerous Cities In Minnesota
Most Dangerous Cities In Missouri
Most Dangerous Cities In Mississippi
Most Dangerous Cities In Montana
Most Dangerous Cities In North Carolina
Most Dangerous Cities In North Dakota
Most Dangerous Cities In Nebraska
Most Dangerous Cities In New Hampshire
Most Dangerous Cities In New Jersey
Most Dangerous Cities In New Mexico
5 Most Dangerous Cities In Nevada
Most Dangerous Cities In Oklahoma
Most Dangerous Cities In Oregon
Most Dangerous Cities In Pennsylvania
Most Dangerous Cities In Rhode Island
Most Dangerous Cities In South Carolina
Most Dangerous Cities In South Dakota
Most Dangerous Cities In Tennessee
Most Dangerous Places In Texas
Most Dangerous Cities In Virginia
Most Dangerous Cities In Vermont
Most Dangerous Cities In Washington
Most Dangerous Cities In Wisconsin
Where is L.A.?
The figures do not lie but liars figure. Sam Sparks must think that if one woman can have a baby in nine months, three women could do it in three.
I hate to even spend any time on this, but here are facts. The number of burglaries in a population does not equate to danger. Pueblo, CO has it’s city angst just as do others. Where your facts about unemployment come from are baffling; According to the Bureau of Labor Statistics, Pueblo’s rate of unemployment as of March was 3.7%, not 12%. The saddest part is that this kind of rubbish journalism brings down entire communities- and they start to believe it themselves.
If you’d like to ever stop by to experience our town, I’ll show you a burgeoning university that was Division II national football champions a couple of years ago. I’ll show you a great community college with a national ranking. I’ll show you great neighborhoods virtually untouched by crime. I’ll show you a fantastic arts center with a recognized children’s museum, and a slew of other great museums. I’ll take you to one of three independent theater companies. I’ll show you our convention center that is about to undergo a huge expansion, right on our beautiful and growing Riverwalk, Bith of which are funded by our citizens. I’ll introduce you to proud citizens that tax themselves to spur economic development. We have a beautiful parks system, zoo, and internationally accredited fire and police departments. We enjoy Broadway shows and concerts in our newly krestored city auditorium. The Colorado State Fair has called Pueblo home for over 100 years.
We are a rough and tumble, blue collar town that continues to survive the downturn of our steel industry while adding new green businesses.
Paul Harvey extolled the virtues of our city, as I am certain you would as well if you spent some time here.
Pueblo is a city that I am proud to call my home. And I refuse to let less than 1% of our population who choose to be criminals define who we are.
Please stop by, I’ll gladly show you my town!
Thank you so much for your comment. You said it better than I ever could have. I live in Springfield Missouri and this list is damaging to say the least. Springfield is a wonderful City and doesn’t deserve this rap.
As a fellow Springfield resident, the list does make Springfield to seem like some kind of hell on earth, but let’s be honest also: the burglary/theft rate is absolutely astronomical here at the moment. It’s sad, but every town has the problems. At least it’s property crime and not violent crime! 🙂
So did you just accidentally skip over or intentionally decide not consider the paragraph in bold on the FBI page this article links to? You know, the one that says this data is inaccurate and incomplete and should not be used for comparison or ranking because it would lead to inaccurate results that are misleading? It then gives you a link to learn how to do correctly apply statistics to crime data and also how to acquire complete data.
You sir, are part of the problem. Intentionally misleading people and keeping them ignorant, scared and angry. Hope your paycheck for this “false reporting” got you a couple of Chili’s dinners at least.
What a bunch of morons at this rag!!! It clearly says not for comparing cities by this data, yet they publish it and claim it as fact in bold print! Uggghhhhh! I hope no one graduated college that works roadsnacks as my faith in higher education is falling by the second!
This study is a joke! Chicago not on the list??? Really???
What about ranking by most murders per capita?
1. Chicago
2. Detroit
3. New Orleans
4. Jacksonville
5. Aurora
6. Los Angeles
7. Atlanta
8. Miami
9. North Omaha
10. Orlando
The real crime is using postal abbreviations for states in the copy of a story.
I do not believe this, I know that Macon, Ga. is not the place it was in the 90’s when I was a home health nurse there, I don’t even want to drive through it now…must less work as a home health nurse…too dangerous.
“America is a safe place to live relative to the rest of the world” ?
I live in Norway and the murder rates are much lower here.
Your so called Facts are absurd, Athens Tn.a small Country town is no.6 most violent crimes,Blaaaaaaa! I LIVED there 30 yrs my son still lives there! TOTAL BS!!!#! MEMPHIS Tn. I live here its absolutely the most Violent Racist City in America!
Train stops at Springfield for cheeseboards? . . . “BEST THING SINCE SLICED BREAD! Great idea and there will be lots of support. Go for it Springfield with all the ideas and energy you can muster !
I don’t see any mention of Texas cities where criminals are coyotes or MS-13 hit men from across the border. Are those criminals undocumented thereby not tallied in any locality?
I tripped over this site accidentally as a link turned up in search results while I was tracking down info on a couple of sickmaking murders w/a name in common (MT/perp & CA/victim), of course found the name intriguing – who doesn’t love to eat on the road? – and even got a little warm-fuzzy moment at its location since I have friends in Durham. It looked @ first promising as a source of information alternative to city-data. While in the stats at the end I was happy to see that my hometown of Washington has dropped to 27 from 44 in this category, before getting there on reading this 1 article, I was shocked at its sloppiness. I was given to wonder before reading the 5/9/17 comment by Mark as to this contributor Kolmar’s education level, but it’s long been my view that them as have some framed Piece of High-Class Toilet Paper [1976] on their wall somewhere, aka college diploma, whether on TV or in writing, routinely express themselves with jawdropping inarticulateness [e.g. TheWeatherChannel, which is busted out with such overeducated idiots]. I practically dread to see anymore of this site after this, since just this 1 sample is riddled with not only the most ridiculously easy-to-avoid/correct typos [FOUR!!! in ONE sentence alone! (4th paragraph)], but this Kolmar here addresses his readers in the most patronizing/condescending fashion, “how typical” of newsdummies, e.g. “It’s the dot way out to the top in the graph higher on the page” re: St. Louis. “Not exactly appetizing scenery” to either eat by or spark hunger for more. Kudos to the Snackers for their hardly easy work setting all this up, but if this 1 sample is demonstrative of its overall execution – including the other readers’ enlightening observations – then, as in the tearjerking yet uplifting 40-year-old G. Rafferty song [different context], they “still got a long way to go” to achieve solid legitimacy. But they’ll fall as short of that mark as a 75-yard field goal try if they merely go Screw ‘Em! & continue on their unmerry way farting out their common-senseless Kollege Knowledge, structurally & statistically. “That would be … unfortunate.”
To be fair, I haven’t researched data for all these cities but I disagree with your claim about Chicongo. According to City-Data.com the National average for all crime 280.2 per 100,000 people, Chicago is 510.7 per 100,000 people, almost double the National average. It also ranks quite high in violent crime rather than just petty crime and has some of the highest murder rates in the country. So No, it’s not about average and should be on the list in my opinion.
What about
Pittsburgh Pennsylvania
Reno Nevada
Compton California
I was recently in Memphis TN. The 1st time i was there. It is an absoulte hell hole. A policeman actually stopped and spoke to me and asked me to leave the city. He told me that he was amazed that i had not been shot and killed. I was in an area where there are alot of gang members and crack dealers. I was waiting to get into the post office. The complete city was a mess frim top to bottom. Honestly, if Elvis was alive today i really dont think he would still be living in Memphis.
This list seems pretty spot on, like actually, except for one thing: Where on earth is Cleveland?! That place has crime everywhere! Especially on the east side!
Other than that, like I said, the list seems accurate.
~ Gabriel
Your city list is misleading. Property Crimes Per Capita is generally an annoyance. Having your car broken into or your credit card stolen is not life threatening. Being caught in a random drive by shooting is. Stick to violent crimes as being dangerous.
Athens Tn.a small Country town is no.6 most violent crimes,Blaaaaaaa! I LIVED there 30 yrs my son still lives there! TOTAL BS!!!#! MEMPHIS Tn. I live here its absolutely the most Violent Racist City in America!
Im Surprised Jackson MS isn’t on THE list. Jackson is far more dangerous than Montgomery.