
America is pretty diverse. There are rich people, poor people, and in-between people (most of us)
Today, we are going to look at the poorest cities in the United States using Saturday Night Science to compare Census data on poverty rates.
We’re not judging. We’re just being observant.
As a point of reference for looking at these cities, the United States has 41,712,496 people living in poverty which is 12.50% of the population.
Table Of Contents: Top Ten | Methodology | Summary | Table
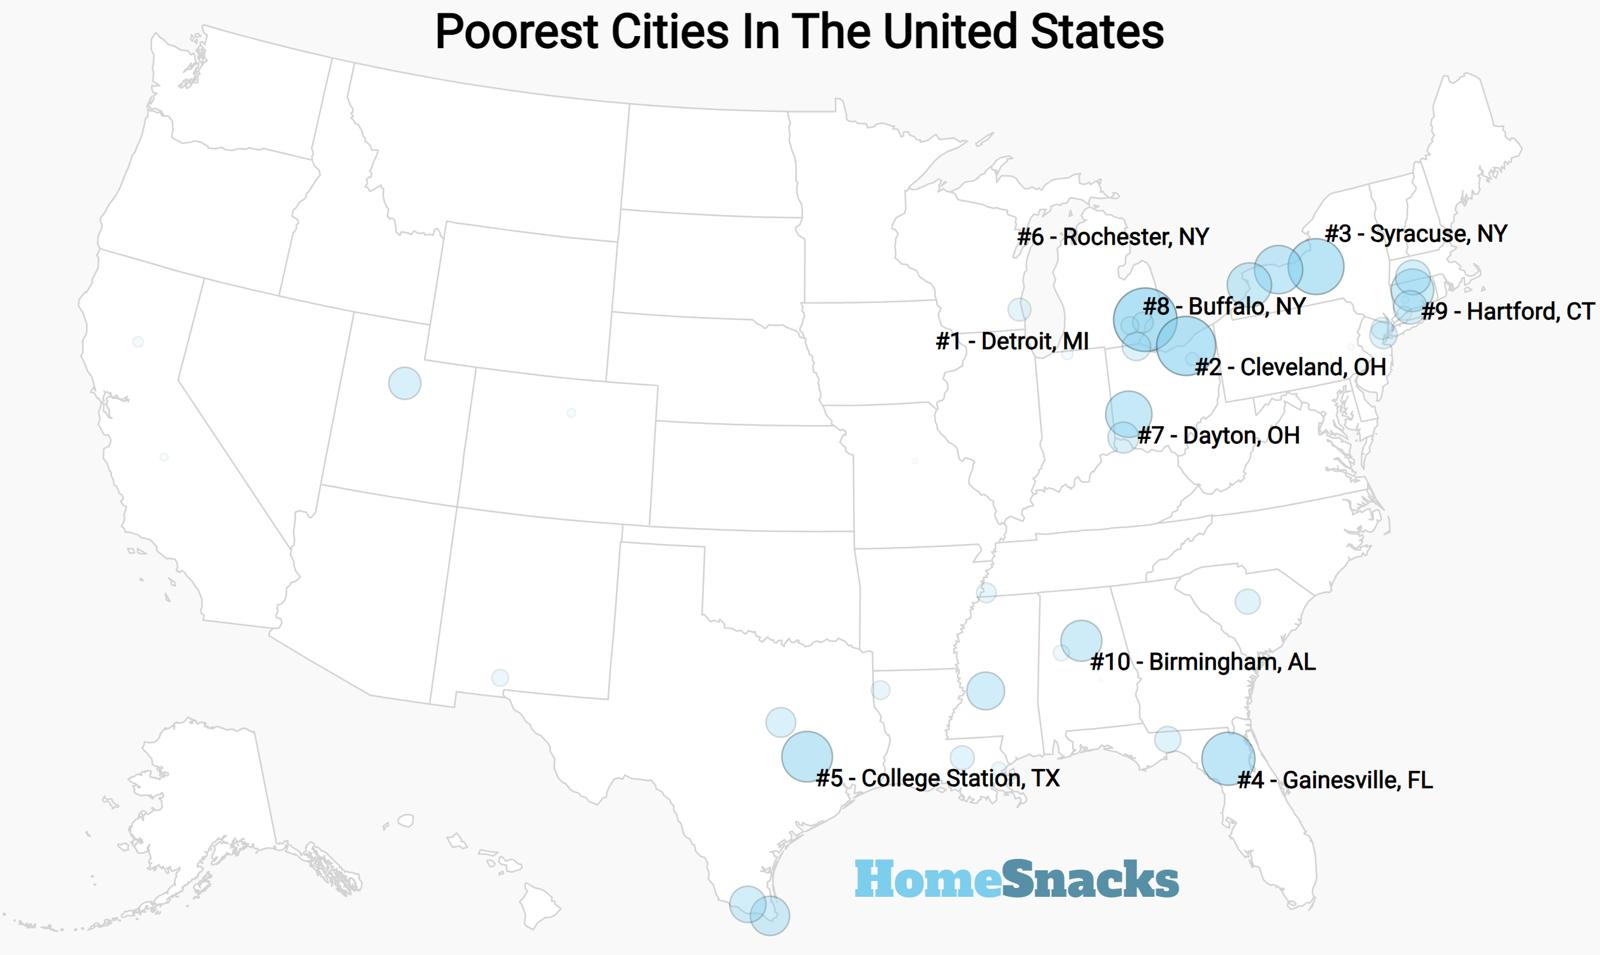
The 10 Poorest Cities In The US For 2026
- Detroit, MI – 32.7% poverty rate
- Gainesville, FL – 30.8% poverty rate
- Cleveland, OH – 30.6% poverty rate
- College Station, TX – 29.2% poverty rate
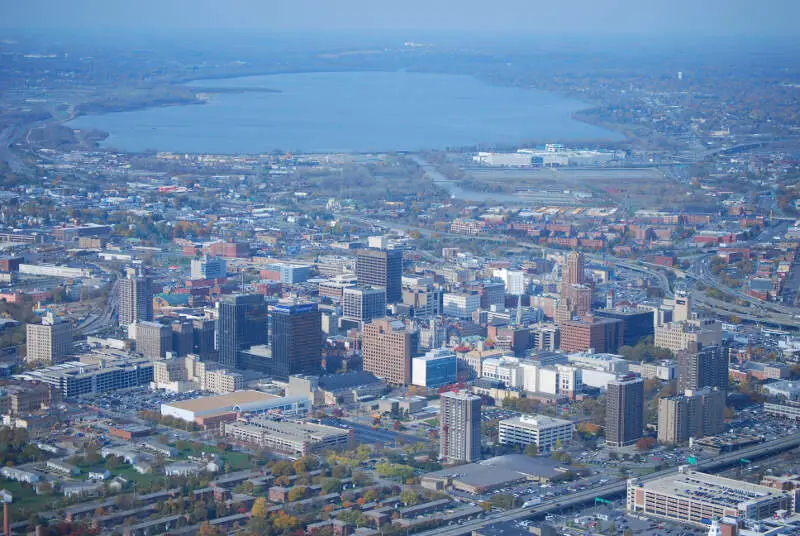
- Syracuse, NY – 28.8% poverty rate
- Jackson, MS – 27.9% poverty rate
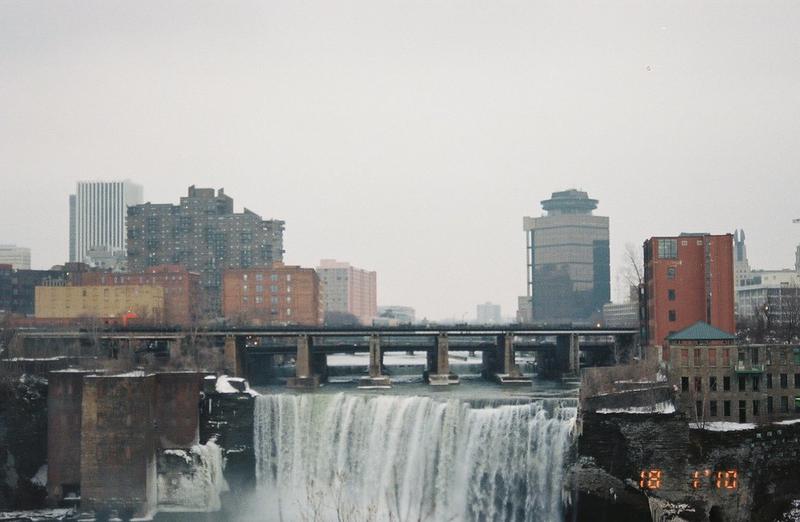
- Rochester, NY – 27.8% poverty rate
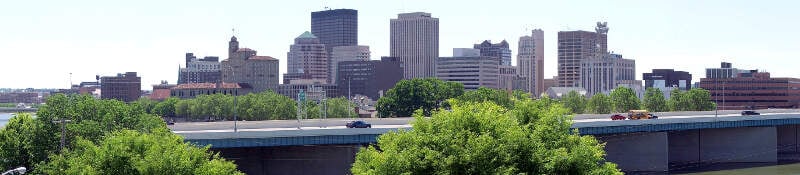
- Dayton, OH – 26.9% poverty rate
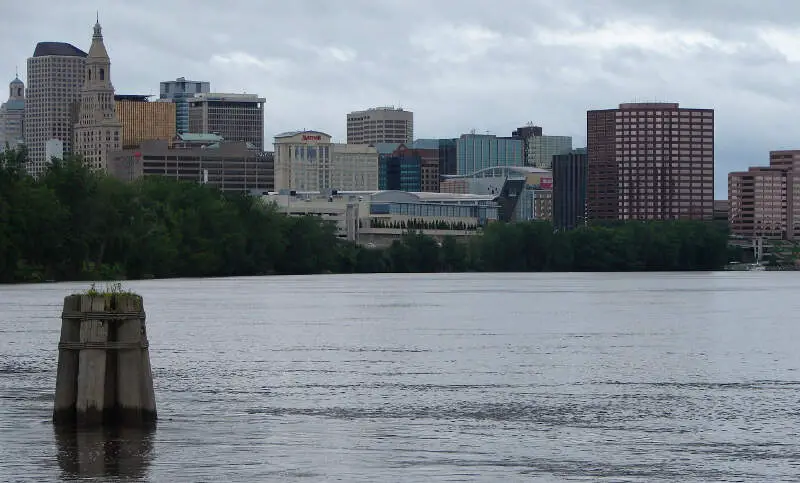
- Hartford, CT – 26.3% poverty rate
- Edinburg, TX – 26.0% poverty rate
According to the data, what’s the poorest big city in the United States? Per the most recent ACS data, the poorest city in America is Detroit, MI.
The richest city in America? That would be Centennial, CO.
To see exactly how we calculated these rankings, read on.
For additional research, see:
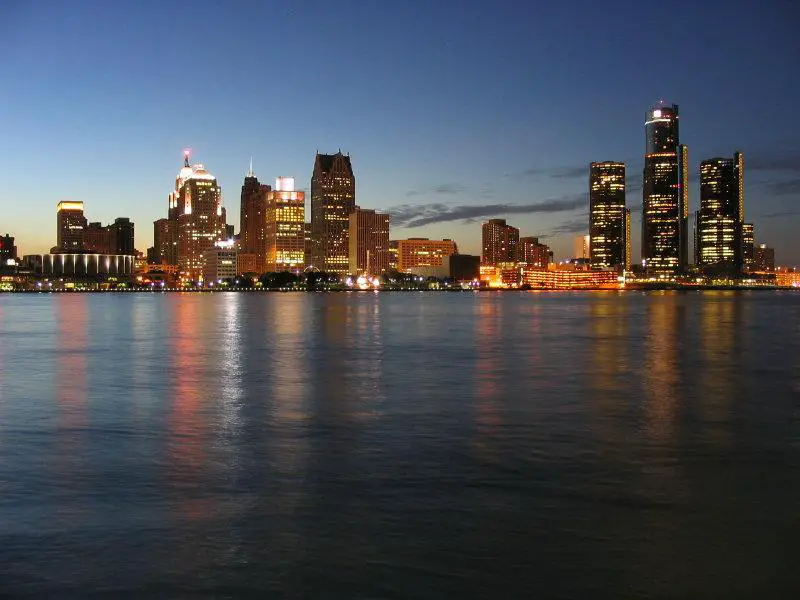
The 10 Poorest Cities In America For 2026

/10
Population: 638,530
Median Income: $39,938
Average Home Price: $75,357
Unemployment Rate: 14.0%
Poverty Rate: 32.7%
Rank Last Year: 1 (No Change)
People In Poverty: 208,863
More on Detroit: Data | Crime | Cost Of Living
Detroit – what else can we say. You’re literally the poorest, least employed and most poverty stricken place in the nation. And that’s despite the fact, that people keep saying Detroit is getting better. Of course, you could talk about the decline of Detroit starting when car companies pulled out of town. That’s part of it. You could spend an entire article talking about what happened in Detroit, but today, you can buy houses for $1, about 60% of the population is gone, and it’s straight rough in most parts.
Why Detroit? Chicago, Philly, Kansas City, Milwaukee and Cincinnati were all somewhat spared. And other rust belt towns like Pittsburgh and St. Louis – and heck even Cleveland, aren’t doing THAT bad.
Fact is, Detroit has a TON of catching up to do if it wants to somewhat resemble an actual American city at some point down the road.

MICHIGAN IS A VERY GOOD STATE IN THE GREAT LAKES. IN THIS CITY HAS A POPULATION OF ABOUT 10 MILLION.
YOU’VE BEEN ON A MICHIGAN FALL COLORS TOUR OR TAKEN A DRIVE THROUGH THE COUNTRY IN THE FALL JUST TO SEE THE LEAVES CHANGING.

/10
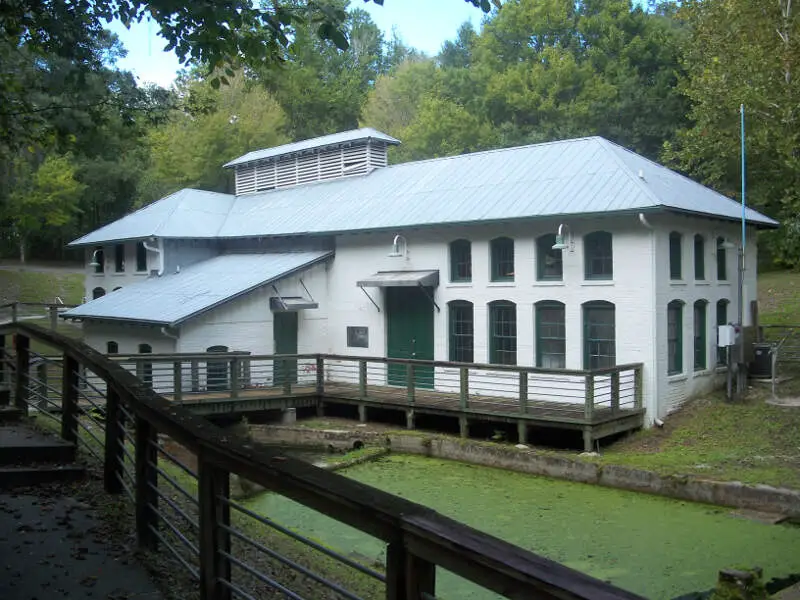
Population: 145,702
Median Income: $46,195
Average Home Price: $297,055
Unemployment Rate: 5.5%
Poverty Rate: 30.8%
Rank Last Year: 5 (Up 3)
People In Poverty: 44,832
More on Gainesville: Data | Crime | Cost Of Living
As the 2nd poorest city in the United States, Gainesville grapples with a poverty rate of 30.77%, leaving 44,832 residents navigating financial hardships. Despite a median income of $46,195 and an unemployment rate of 5.49%, a relatively large share of the population still struggles with poverty.
Gainesville is in the center of Florida and is home to the University of Florida’s main campus.
Bad schools, lots of bugs, not much to do, full of judgemental people, crackheads, and lots of college students. Highly suggest not moving here.
Lots of homeless and maybe not as much crime as other places

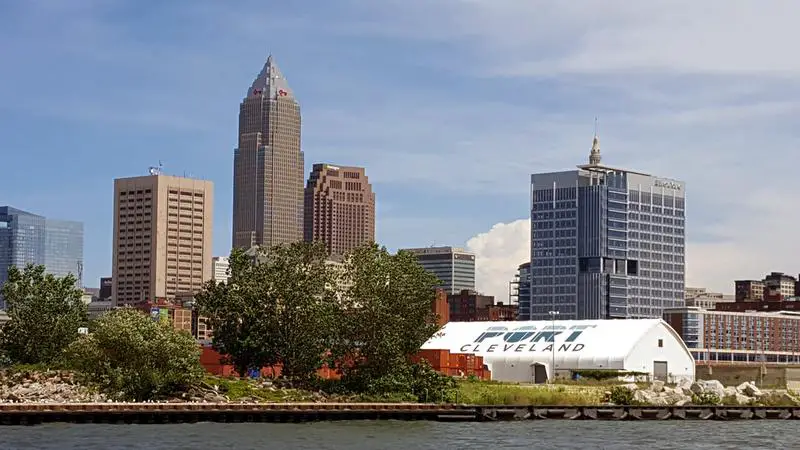
/10
Population: 366,097
Median Income: $40,801
Average Home Price: $115,536
Unemployment Rate: 10.8%
Poverty Rate: 30.6%
Rank Last Year: 2 (Down 1)
People In Poverty: 111,989
More on Cleveland: Data | Crime | Cost Of Living
Cleveland is straight broke. 30.59% of the city is poverty stricken, and the average family lives just outside of poverty. If you live there, this isn’t new news.
At least the Cleveland sports teams have been taking people’s minds off of being in the poor house. And there’s theaters, nice restaurants opening up and national orchestras in town – despite those being traditionally wealthy forms of entertainment. Can anyone weigh in on if a majority of Cleveland residents can afford to do these things?
Apparently, though, the more you look online, the more optimistic you see Clevelanders talking about how their city is improving each year. That’s great news, Cleveland. Like the other cities on this list, we’re pulling for ya. And best of all, Cleveland – at least you’re not Detroit.
Everything in Cleveland is terrible. The crime, the roads, the people, the weather. It is the worst place I have ever had the misfortune to live in.
The worst thing is the snow in the winter months and having to deal with all of cold and mess. Everybody is really cranky so you get no friendliness from people. The air quality s***s so you can never take a real breath. Just an awful place.


/10
Population: 124,570
Median Income: $50,900
Average Home Price: $349,040
Unemployment Rate: 5.1%
Poverty Rate: 29.2%
Rank Last Year: 4 (No Change)
People In Poverty: 36,374
More on College Station: Data | Crime | Cost Of Living
College Station faces economic challenges, ranking as the fifth poorest city in the U.S. With a median income of $50,900 and an average home price of $349,040, the city grapples with real estate accessibility issues. A 29.2% poverty rate, affecting 36,374 individuals, highlights the economic hurdles.
The one quirk of the data is that a large percentage of the city’s population is Texas A&M University. University students tend to fall below the poverty level because they are younger and not employed full-time.

/10
Population: 146,384
Median Income: $47,819
Average Home Price: $210,251
Unemployment Rate: 7.7%
Poverty Rate: 28.8%
Rank Last Year: 3 (Down 2)
People In Poverty: 42,129
More on Syracuse: Data | Crime | Cost Of Living
Our 5th poorest city in America is Syracuse, New York, where 1 in 3 people lives in poverty – the 5th highest rate in the US. Syracuse has actually become more poor than any other major city. A few years back, Syracuse was the 10th poorest, and now it’s the 5th poorest. Across America, poverty rates have ticked up in major cities, but overall, poverty rates have gone down overall, by quite a bit – about 10 percent more people are less poor nowadays.
On top of the poverty issue here in upstate New York, Syracuse actually gets more snowfall than any other place in America – with slightly more snow that Wooster Mass and nearby Buffalo. As such, Syracuse residents pay about 25% of their homeownership costs on utilities, with a big portion of that going to their heating bills. So for many months, it’s extra tough to get to one of four Syracuse area Super Walmarts, or one of four area Syracuse Targets. Since Targets groceries are about 15% more expensive than Walmarts, it’s safe to assume the poorer folks patronize Walmart.
Look at how many dollar stores are in the greater Syracuse region. Makes sense.
Syracuse, NY, is a blue collar rust belt city filled with history and character. It’s admittedly not for all, as it absolutely does lack the polish of many more prosperous cities, and it’s weather can be punishing. But, the city has a proud past that was instrumental in American history, ranging from being an integral part of the Erie Canal, to being the site where the basketball shot clock was invented, and much, much more in between. Syracuse also has several museums, a handful of sports teams, and the Syracuse University Orange, it’s pride and joy.
Good: The people, the history, the sports, and the general blue collar feel are fantastic.
Bad: The weather, the economy, and the crime rate could use some help.

/10
Population: 146,631
Median Income: $42,071
Average Home Price: $87,256
Unemployment Rate: 9.3%
Poverty Rate: 27.9%
Rank Last Year: 8 (Up 2)
People In Poverty: 40,939
More on Jackson: Data | Crime | Cost Of Living
If you’re judging horrible by really poor, than Jackson would be the reason Mississippi is horrible. Not that it’s horrible, but it’s certainly poor. Mississippi is the poorest state in the nation, you know.
Jackson is located along the western side of the state. And as you can see in this county by county map of poverty rates in America, a lot of western Mississippi is poo to the oor. Other poor hotspots include the US Mexico border in Texas, a large part of rural, mountainous Kentucky, and Native American reservations in both Arizona and South Dakota.
Jackson is known for many things, including the place where some guy broke the record for a Dr. Mario score. It used to be that you couldn’t make a lot of money playing video games, but hopefully, that guy has made a profitable career here today. He’d be an outlier, that’s for sure.
Do poor people play video games? What TV shows do they watch? Well, apparently, the poorer you are, the more video games you play – by about 12 minutes a day. So are poor people playing more video games because it’s cheaper than going out, or are they poor because they play video games more?
The TV show with the richest viewership? The Bachelorette.
horrible streets and roads, crime, businesses leaving the city or states, going out of business, losing airlines, low business environment, bad schools and less good doctors.
The horrible streets and roads the bad; which aren’t being repaired due to lack of funds in the budget.

/10
Population: 208,772
Median Income: $47,213
Average Home Price: $235,783
Unemployment Rate: 7.9%
Poverty Rate: 27.8%
Rank Last Year: 9 (Up 2)
People In Poverty: 58,059
More on Rochester: Data | Crime | Cost Of Living
Our next stop is in upstate New York. This time, we’re going to Rochester. One Rochester resident says, and I’ll paraphrase: Rochester used to be the headquarters for several large companies back in the 70s and 80s, and then a heavy tax burden businesses in the area. Now, a lot of the larger companies have left, taking the local economy with them.
Apparently, most of that is true – the language is kinda rough, but yes, Rochester was once a thriving city. It used to be a place where you could get your GED and make a pretty decent salary in what was considered a low-skilled job. Now, low high school graduation rates in Rochester make it tough to find the skills needed to entice companies. But they’re trying. The area is luring in new companies to the area these days.
Let’s all root for Rochester!
Rochester residents make a little less money than their Syracuse peers, but essentially, both have mostly poor to middle class residents. I wondered what type of music Rochester would listen to. And other poor communities. Apparently, there’s an answer for just about everything on the web. Poorer people like to listen to golden oldies, disco and rap. Richer people like classical, opera and rock.
Who listens to Taylor Swift then? 12 year olds?
I may not live in Rochester any more, but it will always be home!

/10
Population: 136,579
Median Income: $45,247
Average Home Price: $136,592
Unemployment Rate: 9.0%
Poverty Rate: 26.9%
Rank Last Year: 7 (Down 1)
People In Poverty: 36,780
More on Dayton: Data | Crime | Cost Of Living
There once was a guy from Dayton
His life he tried to straighten
In 2003,
He got a degree
Did he get a good job? He’s still waiting’
We’re almost to our poorest place in the USA, and we’ll take a couple quick stops in Ohio. Here in Dayton, things are a real mess. 1 in 3 residents lives in poverty, and people barely crack the $30k mark annually for salaries.
Dayton was listed as the 3rd worst city in the country…. I can’t believe there are 2 cities worse than mine
Junkies, junkies everywhere

/10
Population: 121,127
Median Income: $46,411
Average Home Price: $198,964
Unemployment Rate: 10.7%
Poverty Rate: 26.3%
Rank Last Year: 11 (Up 2)
People In Poverty: 31,832
More on Hartford: Data | Crime | Cost Of Living
Hartford is in the top ten in all three categories we measured, and it has a high unemployment rate at 10.74%. And its poverty rate is twice the national average. Yikes.
A pretty in depth article talked about Hartford’s fall from grace – noting that at one point, Hartford was very popular. To sum, Hartford is more expensive to live than lots of other places, people are leaving Hartford in droves these days, and crime is really high. When manufacturing left, so did the jobs, talent, and enthusiasm.
Hartford used to have a hockey team, but they moved to Raleigh. They have a baseball team called…the Yard Goats? Why are they called that? Anyways, I’m surprised Hartford residents have any supplemental income to go watch baseball games.
Hartford is a miserable crime riddled city without any positive attributes. The restaurants are sub-par. The crime rate is through the roof. It is not uncommon to see prostitutes and pimps. You can’t drive more than a couple blocks before you see a drug deal. The mayor is an idiot and is doing nothing to turn his awful city around. Now, the City of Hartford thinks the State of Connecticut should bail them out.
There is nothing worthwhile in this city. The baseball team is a complete joke. The restaurants are sub-par. The parks are heroine needle filled. The roads are full of potholes. The hospitals frequently treat people with gun shot wounds and stabbings. Avoid Hartford, Connecticut at all costs.

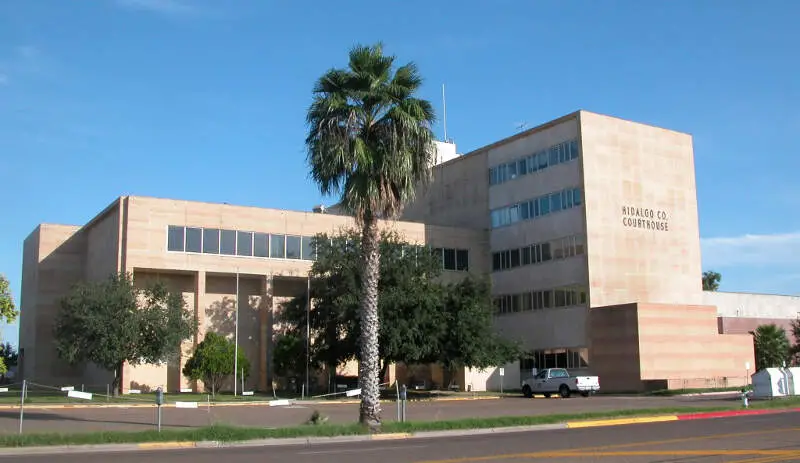
/10
Population: 104,550
Median Income: $59,466
Average Home Price: $217,344
Unemployment Rate: 6.1%
Poverty Rate: 26.0%
Rank Last Year: 10 (No Change)
People In Poverty: 27,162
More on Edinburg: Data | Crime | Cost Of Living
Methodology: How We Determined The Poorest Large Cities in The US For 2026
The first thing that comes to most people’s minds when they think about determining the poorest cities in the United States is simply the poverty rate. That is, the number of people living below a federally established income level for a household of a specific size.
We used Saturday Night Science to look at the poverty level from the newly released 2020-2024 American Community Survey:
And, to be clear, we measured the 322 largest cities in America with populations over 100,000. So, while your little small town might be broke, we only look at the most populated areas.
To score the cities, we ranked each one from 1 to 322 where one is the “poorest” and has the highest poverty level. We updated this article for 2026. This report is our eleventh time ranking the Poorest cities in America.
Summary: The Poorest Cities in The Us For 2026
After all the dust settled and the analysis was over, we crowned Detroit as the poorest city in America for 2026.
The cities in the United States with the highest poverty level are .
While it’s bad news for the cities we mentioned, we must acknowledge America’s richest cities. If you live in Centennial, CO, Frisco, or Carmel, , sounds like things are going pretty well right now.
It may be time for you to consider giving back to the community.
For more reading, check out:
Poverty Rate By City In The United States For 2026
| Rank | City | Population | Poverty Rate | Median Income | People In Poverty |
|---|---|---|---|---|---|
| 1 | Detroit, MI | 638,530 | 32.7% | $39,938 | 208,863 |
| 2 | Gainesville, FL | 145,702 | 30.8% | $46,195 | 44,832 |
| 3 | Cleveland, OH | 366,097 | 30.6% | $40,801 | 111,989 |
| 4 | College Station, TX | 124,570 | 29.2% | $50,900 | 36,374 |
| 5 | Syracuse, NY | 146,384 | 28.8% | $47,819 | 42,129 |
| 6 | Jackson, MS | 146,631 | 27.9% | $42,071 | 40,939 |
| 7 | Rochester, NY | 208,772 | 27.8% | $47,213 | 58,059 |
| 8 | Dayton, OH | 136,579 | 26.9% | $45,247 | 36,780 |
| 9 | Hartford, CT | 121,127 | 26.3% | $46,411 | 31,832 |
| 10 | Edinburg, TX | 104,550 | 26.0% | $59,466 | 27,162 |
| 11 | Buffalo, NY | 276,854 | 26.0% | $50,041 | 71,871 |
| 12 | Springfield, MA | 154,749 | 25.8% | $52,656 | 39,956 |
| 13 | Baton Rouge, LA | 222,771 | 25.7% | $49,994 | 57,252 |
| 14 | Cincinnati, OH | 311,224 | 25.5% | $52,909 | 79,268 |
| 15 | Tuscaloosa, AL | 111,038 | 25.1% | $51,464 | 27,903 |
| 16 | Birmingham, AL | 198,173 | 24.7% | $46,051 | 48,928 |
| 17 | Waterbury, CT | 114,869 | 24.7% | $51,886 | 28,338 |
| 18 | Toledo, OH | 267,463 | 24.3% | $49,724 | 65,100 |
| 19 | Dearborn, MI | 107,423 | 24.3% | $65,324 | 26,136 |
| 20 | Columbia, SC | 139,643 | 24.0% | $55,529 | 33,472 |
| 21 | New Haven, CT | 134,349 | 23.9% | $56,851 | 32,149 |
| 22 | Ann Arbor, MI | 122,036 | 23.8% | $82,212 | 29,081 |
| 23 | Brownsville, TX | 189,177 | 23.7% | $52,130 | 44,853 |
| 24 | Tallahassee, FL | 201,875 | 23.6% | $57,409 | 47,723 |
| 25 | Shreveport, LA | 180,982 | 23.5% | $48,699 | 42,603 |
| 26 | Newark, NJ | 310,178 | 23.4% | $52,060 | 72,705 |
| 27 | Akron, OH | 189,247 | 23.3% | $48,076 | 44,170 |
| 28 | Memphis, TN | 618,980 | 23.1% | $51,736 | 143,170 |
| 29 | Waco, TX | 143,570 | 23.1% | $54,365 | 33,179 |
| 30 | Provo, UT | 114,766 | 23.0% | $64,171 | 26,442 |
| 31 | Albany, NY | 100,492 | 22.9% | $61,986 | 23,052 |
| 32 | Milwaukee, WI | 566,973 | 22.8% | $54,234 | 129,156 |
| 33 | Chico, CA | 102,188 | 22.7% | $66,977 | 23,186 |
| 34 | Las Cruces, NM | 114,197 | 22.6% | $55,422 | 25,819 |
| 35 | New Orleans, LA | 371,853 | 22.6% | $56,631 | 84,038 |
| 36 | Montgomery, AL | 197,494 | 21.5% | $56,811 | 42,540 |
| 37 | Boulder, CO | 106,433 | 21.4% | $87,493 | 22,829 |
| 38 | Philadelphia, PA | 1,579,706 | 21.4% | $61,953 | 337,425 |
| 39 | Rockford, IL | 147,521 | 21.3% | $54,752 | 31,451 |
| 40 | Paterson, NJ | 158,735 | 21.2% | $55,997 | 33,731 |
| 41 | Beaumont, TX | 113,279 | 21.2% | $56,997 | 24,049 |
| 42 | Peoria, IL | 112,169 | 21.0% | $59,410 | 23,577 |
| 43 | Bridgeport, CT | 149,153 | 21.0% | $58,685 | 31,337 |
| 44 | Allentown, PA | 125,976 | 21.0% | $55,494 | 26,417 |
| 45 | Laredo, TX | 257,619 | 20.9% | $63,915 | 53,790 |
| 46 | South Bend, IN | 103,085 | 20.8% | $55,786 | 21,451 |
| 47 | Providence, RI | 191,767 | 20.7% | $68,119 | 39,772 |
| 48 | St. Louis, MO | 288,512 | 20.6% | $56,160 | 59,548 |
| 49 | New Bedford, MA | 100,998 | 20.6% | $56,981 | 20,755 |
| 50 | El Cajon, CA | 104,449 | 20.5% | $67,511 | 21,443 |
| 51 | Knoxville, TN | 195,185 | 20.2% | $54,039 | 39,388 |
| 52 | Lansing, MI | 113,023 | 20.1% | $54,382 | 22,762 |
| 53 | Fresno, CA | 545,970 | 20.1% | $70,991 | 109,630 |
| 54 | Pittsburgh, PA | 304,759 | 20.1% | $65,742 | 61,165 |
| 55 | McAllen, TX | 145,385 | 20.0% | $61,579 | 29,062 |
| 56 | Houston, TX | 2,328,253 | 19.9% | $64,813 | 463,322 |
| 57 | Baltimore, MD | 573,243 | 19.8% | $62,177 | 113,215 |
| 58 | Savannah, GA | 147,898 | 19.6% | $57,137 | 29,061 |
| 59 | Worcester, MA | 207,055 | 19.6% | $70,102 | 40,520 |
| 60 | Miami, FL | 459,745 | 19.4% | $62,462 | 88,960 |
| 61 | Columbia, MO | 128,548 | 19.2% | $66,498 | 24,745 |
| 62 | Chattanooga, TN | 185,783 | 19.1% | $64,523 | 35,577 |
| 63 | Columbus, GA | 203,711 | 19.1% | $58,073 | 38,806 |
| 64 | Eugene, OR | 179,591 | 19.0% | $66,562 | 34,194 |
| 65 | Pasadena, TX | 149,433 | 18.9% | $64,927 | 28,272 |
| 66 | Lubbock, TX | 264,814 | 18.9% | $60,895 | 50,076 |
| 67 | Tucson, AZ | 547,073 | 18.9% | $57,073 | 103,177 |
| 68 | Tulsa, OK | 413,794 | 18.7% | $59,838 | 77,503 |
| 69 | San Bernardino, CA | 222,724 | 18.6% | $67,415 | 41,471 |
| 70 | Springfield, MO | 169,954 | 18.4% | $49,311 | 31,271 |
| 71 | Mobile, AL | 203,416 | 18.4% | $53,558 | 37,408 |
| 72 | Evansville, IN | 116,116 | 18.4% | $53,387 | 21,353 |
| 73 | El Paso, TX | 680,130 | 18.4% | $59,745 | 124,871 |
| 74 | Victorville, CA | 137,627 | 18.4% | $74,410 | 25,254 |
| 75 | Lafayette, LA | 121,715 | 18.3% | $61,915 | 22,322 |
| 76 | Richmond, VA | 229,359 | 18.2% | $64,587 | 41,743 |
| 77 | Columbus, OH | 914,802 | 18.1% | $66,082 | 165,853 |
| 78 | New York, NY | 8,483,844 | 17.9% | $80,483 | 1,519,456 |
| 79 | Wichita Falls, TX | 102,581 | 17.7% | $60,177 | 18,197 |
| 80 | Winston-Salem, NC | 252,037 | 17.7% | $59,268 | 44,686 |
| 81 | Fayetteville, NC | 210,815 | 17.7% | $58,407 | 37,314 |
| 82 | Pueblo, CO | 111,561 | 17.5% | $56,664 | 19,545 |
| 83 | Little Rock, AR | 203,436 | 17.5% | $63,003 | 35,580 |
| 84 | El Monte, CA | 106,109 | 17.4% | $68,030 | 18,516 |
| 85 | Killeen, TX | 158,159 | 17.4% | $60,977 | 27,582 |
| 86 | Santa Maria, CA | 110,462 | 17.3% | $84,746 | 19,098 |
| 87 | Berkeley, CA | 120,257 | 17.3% | $108,092 | 20,756 |
| 88 | San Antonio, TX | 1,479,835 | 17.1% | $65,056 | 253,791 |
| 89 | Corpus Christi, TX | 317,419 | 17.1% | $67,394 | 54,405 |
| 90 | Hialeah, FL | 226,165 | 17.0% | $55,594 | 38,538 |
| 91 | Greensboro, NC | 301,198 | 17.0% | $61,515 | 51,233 |
| 92 | Hesperia, CA | 100,775 | 16.9% | $72,160 | 17,081 |
| 93 | Grand Rapids, MI | 198,535 | 16.9% | $69,108 | 33,631 |
| 94 | Atlanta, GA | 505,268 | 16.9% | $85,652 | 85,592 |
| 95 | Lowell, MA | 118,368 | 16.9% | $78,658 | 20,016 |
| 96 | Norman, OK | 129,672 | 16.8% | $67,704 | 21,823 |
| 97 | Springfield, IL | 113,330 | 16.8% | $66,064 | 19,073 |
| 98 | Chicago, IL | 2,711,226 | 16.8% | $77,902 | 456,299 |
| 99 | Dallas, TX | 1,307,930 | 16.7% | $70,518 | 218,685 |
| 100 | Boston, MA | 666,442 | 16.6% | $97,344 | 110,696 |
Poorest Places By State
Poorest Cities In Massachusetts
Poorest Cities In North Carolina
Poorest Cities In North Dakota
Thanks Rick, didn”t realize you were in the Indy area. Must try to get together next year or maybe at the Dayton show on April 7, 2018.
Birmingham, AL and San Bernardino, CA are switched.