
Like all states, Kentucky has certain places that are going on hard times. These Kentucky places have an above-average percentage of people living in poverty, out of work, or not making as much as they should be.
Even as the economy continues to improve, it’s worthwhile to look at the places in each state struggling to make ends meet. So we set our sites on locating the poorest places in Kentucky.
To do so, we used Saturday Night Science to analyze the newest Census data from the American Community Survey for the 80 cities in Kentucky with more than 5,000 people.
Table Of Contents: Top Ten | Methodology | Summary | Table
The 10 Poorest Places In Kentucky For 2025:
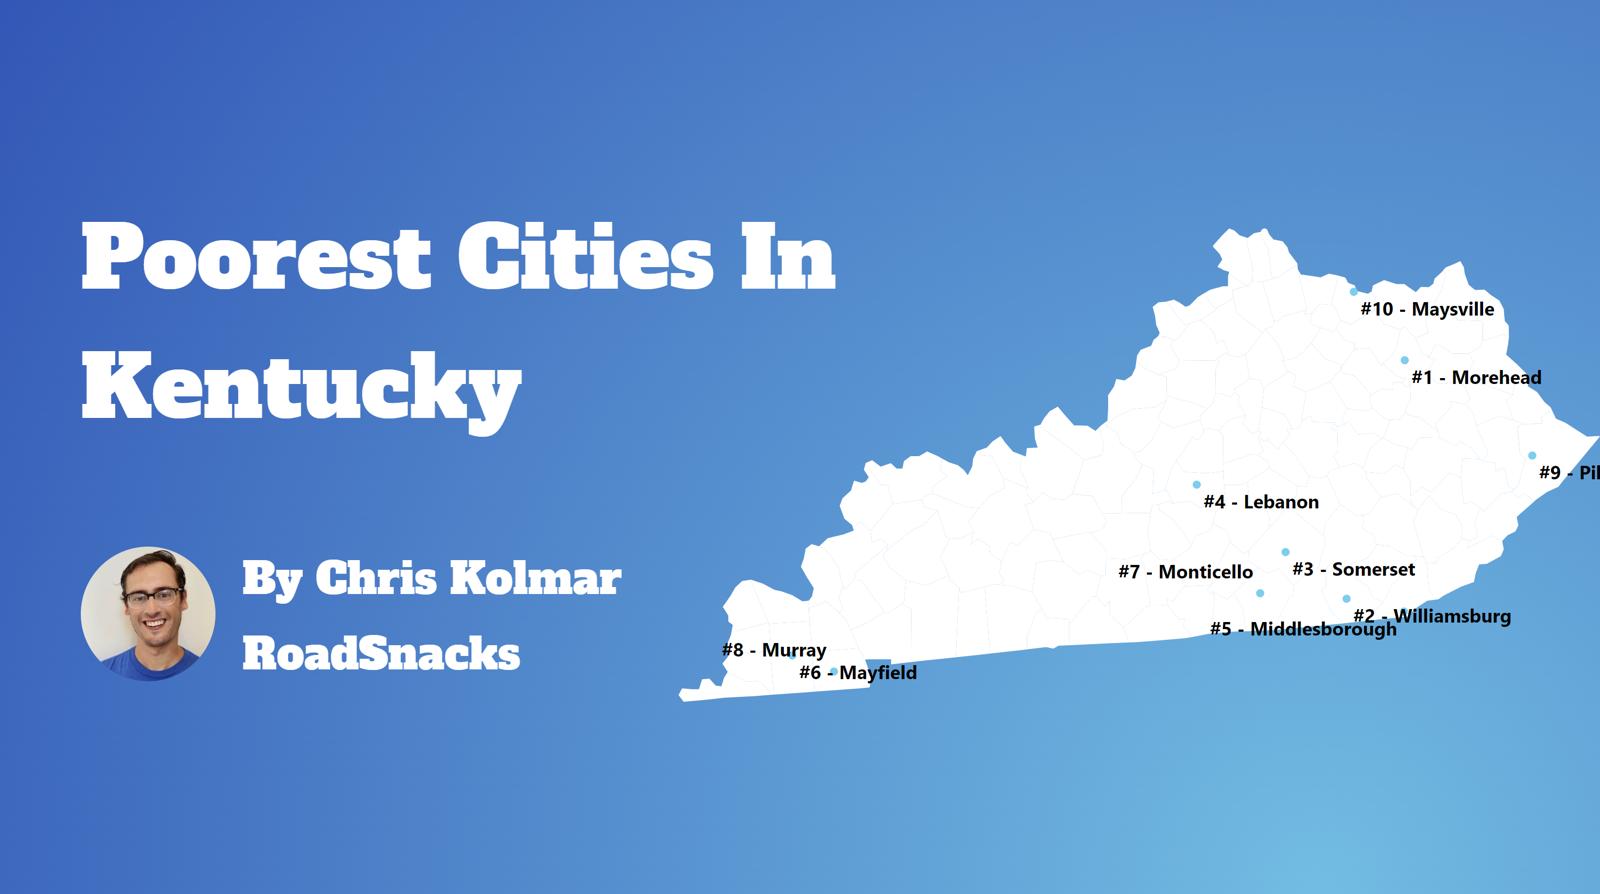
What’s the poorest city in Kentucky? According to the facts, Monticello is the poorest place in Kentucky for 2025.
This isn’t a commentary on the people that live there or the vibrant culture and traditions of these places. Instead, it’s just a look at the facts.
For more Kentucky reading, check out:
- Best Places To Live In Kentucky
- Cheapest Places To Live In Kentucky
- Most Dangerous Cities In Kentucky
- The poorest states in the US
- The poorest cities in the US
The 10 Poorest Cities In Kentucky For 2025
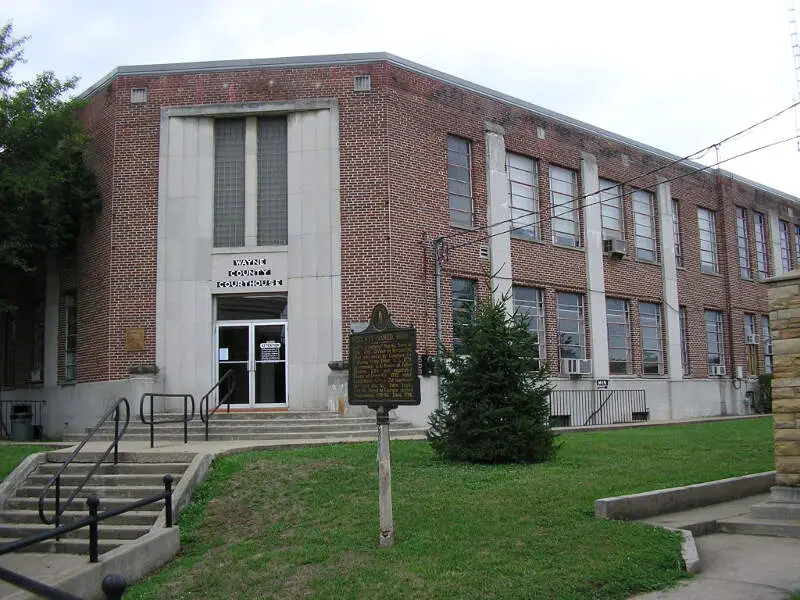
1. Monticello
/10
Population: 5,741
Rank Last Year: 7 (Up 6)
Median Income: $37,733 (5th lowest)
Poverty Rate: 34.9% (highest)
People In Poverty: 2,005
More on Monticello: Data
Monticello, unfortunately, ranks as the poorest place in Kentucky thanks to combination of low pay and and a lack of jobs.
The city of 5,741 people averages the 5th lowest median household income in Kentucky and the highest poverty rate. At the very least, the cost of living ranks in the bottom 15% of place in the state, so things like housing are relatively affordable.
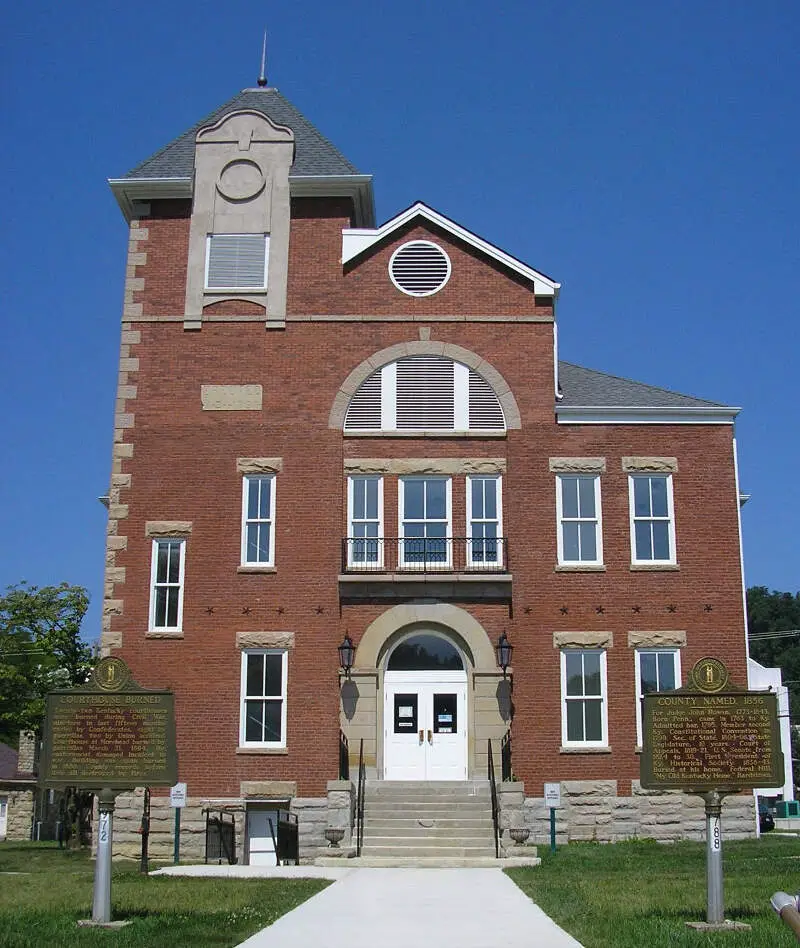
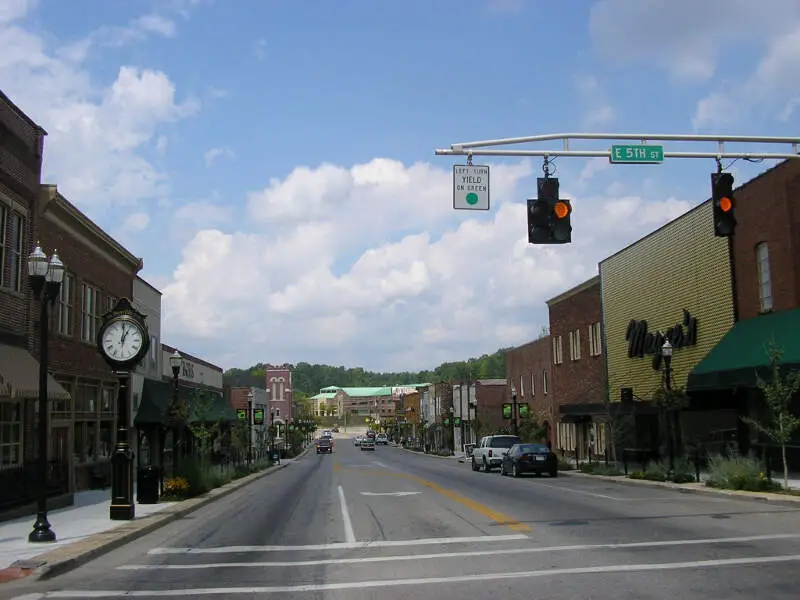
2. Morehead
/10
Population: 6,924
Rank Last Year: 1 (Down 1)
Median Income: $35,000 (4th lowest)
Poverty Rate: 34.4% (2nd highest)
People In Poverty: 2,379
More on Morehead: Data
The second poorest city in Kentucky is Morehead.
The city ranks as having the 2nd highest incidence of poverty and 4th lowest median household income. However, the unemployment rate ‘only’ ranks as the 20th highest in the Bluegrass State.
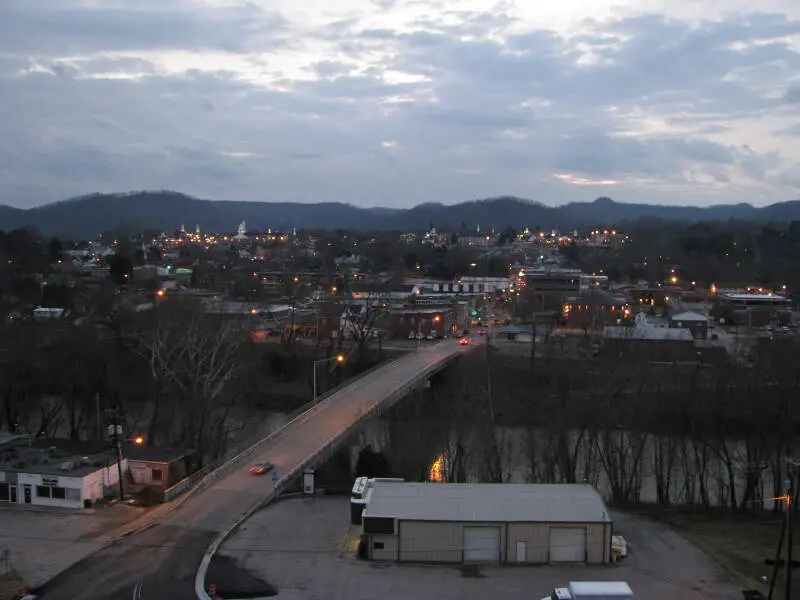
3. Williamsburg
/10
Population: 5,226
Rank Last Year: 2 (Down 1)
Median Income: $32,431 (lowest)
Poverty Rate: 31.6% (5th highest)
People In Poverty: 1,649
More on Williamsburg: Data
Placing as the third poorest city, Williamsburg’s median income ranks as the lowest.
And that’s a sign that there’s a relatively substantial jump in the quality of the economy from second to third place on our list. The poverty rate is 31.56% and ranks near the bottom of places in the state.
But what makes up for the relatively low incomes of the city is its low cost of living. The income you do make here goes further than in most parts of the Bluegrass State.
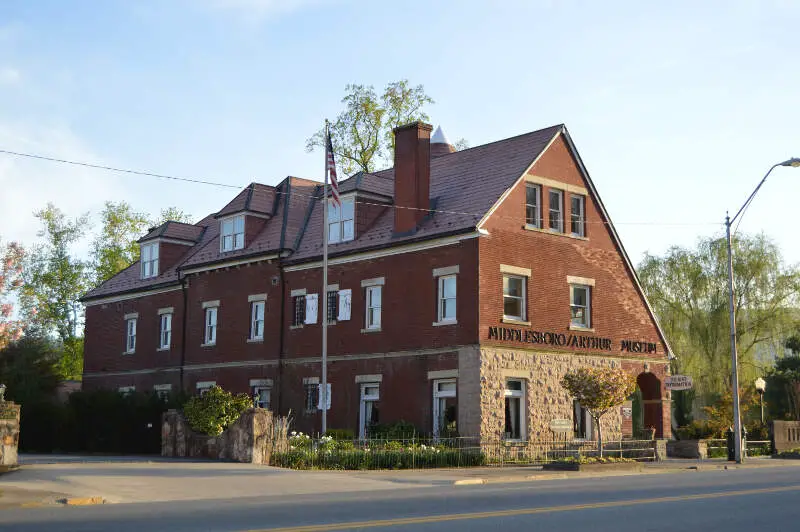
4. Middlesborough
/10
Population: 9,258
Rank Last Year: 5 (Up 1)
Median Income: $34,349 (3rd lowest)
Poverty Rate: 28.8% (8th highest)
People In Poverty: 2,669
More on Middlesborough: Data
Middlesborough ranks as the fourth poorest place in Kentucky.
The town ranks as having the 3rd lowest median household income and the 8th highest incidence of poverty in the state.
That being said, there’s still a ton of cultural diversity in the city as it hosts many events throughout the year.
5. Somerset
/10
Population: 12,108
Rank Last Year: 3 (Down 2)
Median Income: $32,910 (2nd lowest)
Poverty Rate: 28.7% (9th highest)
People In Poverty: 3,472
More on Somerset: Data
The fifth poorest city in Kentucky is Somerset.
The city ranks as having the 2nd lowest median income in the state. However, an extremely low cost of living prevents a good number of folks from living in poverty as the poverty rate only ranks as the 9th highest in Kentucky.
Still not the best news for Somerset.
6. Lebanon
/10
Population: 6,364
Rank Last Year: 4 (Down 2)
Median Income: $39,483 (7th lowest)
Poverty Rate: 31.6% (6th highest)
People In Poverty: 2,008
More on Lebanon: Data
Lebanon ranks as the sixth poorest place in the Bluegrass State.
It ranks as having the 6th highest incidence of poverty and the 18th highest unemployment rate.
7. Mayfield
/10
Population: 9,905
Rank Last Year: 6 (Down 1)
Median Income: $41,458 (9th lowest)
Poverty Rate: 30.6% (7th highest)
People In Poverty: 3,035
More on Mayfield: Data
Mayfield places as the seventh poorest city in Kentucky.
The city of over 9,905 ranks as having the 7th highest incidence of poverty in the state. However, it has a very low cost of living which helps to pay the bills each month.
8. Pikeville
/10
Population: 7,560
Rank Last Year: 9 (Up 1)
Median Income: $39,216 (6th lowest)
Poverty Rate: 28.2% (10th highest)
People In Poverty: 2,135
More on Pikeville: Data
Pikeville ranks as the eighth poorest city in Kentucky.
The big issue for the town is the unemployment rate which ranks as one of the highest in the state.
9. London
/10
Population: 7,576
Rank Last Year: 11 (Up 2)
Median Income: $45,850 (12th lowest)
Poverty Rate: 31.7% (4th highest)
People In Poverty: 2,403
More on London: Data
London couldn’t stay out of the top ten poorest places in Kentucky; it ranks number 9.
While the median income is the 12th lowest, there are a substantial number of people that live below the poverty line. Overall, London ranks as having the 4th most people living in poverty of all the places we analyzed in Kentucky.
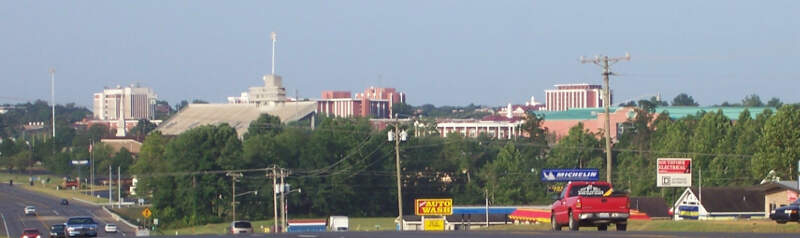
10. Murray
/10
Population: 17,888
Rank Last Year: 8 (Down 2)
Median Income: $40,348 (8th lowest)
Poverty Rate: 24.9% (13th highest)
People In Poverty: 4,450
More on Murray: Data
And rounding out the top ten poorest cities in Kentucky is Murray.
The city of 17,888 people ranks in the bottom 20% for both median income and poverty rate in the Bluegrass State.
Methodology: How We Determined The Poorest Places In Kentucky for 2025
The first thing that comes to most people’s minds when they think about determining the poorest places is to simply the poverty rate. That is, the number of people living below a federally established level of income for a household of a certain size.
However, we don’t think that one statistic wholly encompasses what it means to be one of the “poorest places”. So we used Saturday Night Science to look at this set of criteria from the newly released 2019-2023 American Community Survey:
- Poverty Level
- Median Household Income
After we collected the data for all 80 places with more than 5,000 people in Kentucky, we ranked each place from 1 to 80 for each of the criteria, with 1 being the poorest.
We then averaged all the rankings for a place into a “Poor Score” with the place having the lowest overall Poor Score, Monticello, crowned the “Poorest Place In Kentucky For 2025”.
This report has been updated for 2025, which is our tenth time ranking the poorest places in Kentucky.
Summary: The Poorest Cities In Kentucky For 2025
Like we said earlier, when we set out to identify the poorest places in Kentucky, we weren’t sure what we’d encounter, but it ended up being some of the best places to live in Kentucky.
When you look at the data, the cities and places mentioned above meet the criteria for being at the very bottom of the income ladder for everyone that lives there.
If you’re curious enough, here are the richest cities in Kentucky, according to data:
- Richest: Union
2nd Richest: Edgewood
3rd Richest: Villa Hills
For more Kentucky reading, check out:
- Richest Cities In Kentucky
- Safest Places In Kentucky
- Worst Places To Live In Kentucky
- Most Expensive Places To Live In Kentucky
Detailed List Of The Poorest Places To Live In Kentucky
| Rank | City | Population | Poverty Rate | Median Income | People In Poverty |
|---|---|---|---|---|---|
| 1 | Monticello | 5,741 | 34.9% | $37,733 | 2,005 |
| 2 | Morehead | 6,924 | 34.4% | $35,000 | 2,379 |
| 3 | Williamsburg | 5,226 | 31.6% | $32,431 | 1,649 |
| 4 | Middlesborough | 9,258 | 28.8% | $34,349 | 2,669 |
| 5 | Somerset | 12,108 | 28.7% | $32,910 | 3,472 |
| 6 | Lebanon | 6,364 | 31.6% | $39,483 | 2,008 |
| 7 | Mayfield | 9,905 | 30.6% | $41,458 | 3,035 |
| 8 | Pikeville | 7,560 | 28.2% | $39,216 | 2,135 |
| 9 | London | 7,576 | 31.7% | $45,850 | 2,403 |
| 10 | Murray | 17,888 | 24.9% | $40,348 | 4,450 |
| 11 | Maysville | 8,778 | 23.8% | $41,923 | 2,087 |
| 12 | Glasgow | 15,141 | 23.1% | $42,417 | 3,490 |
| 13 | Bowling Green | 73,638 | 25.4% | $48,419 | 18,718 |
| 14 | Leitchfield | 6,434 | 22.3% | $47,168 | 1,433 |
| 15 | Central City | 5,736 | 24.7% | $49,025 | 1,417 |
| 16 | Cynthiana | 6,412 | 26.0% | $49,817 | 1,669 |
| 17 | Campbellsville | 11,523 | 24.1% | $49,389 | 2,778 |
| 18 | Richmond | 35,498 | 21.6% | $48,223 | 7,674 |
| 19 | Hopkinsville | 31,011 | 20.1% | $47,428 | 6,239 |
| 20 | Henderson | 27,994 | 19.7% | $47,176 | 5,517 |
| 21 | Oak Grove | 7,945 | 20.0% | $47,886 | 1,589 |
| 22 | Shively | 15,556 | 17.6% | $46,522 | 2,733 |
| 23 | Corbin | 8,430 | 22.1% | $51,795 | 1,863 |
| 24 | Ashland | 21,405 | 22.8% | $52,199 | 4,888 |
| 25 | Paducah | 26,894 | 21.5% | $51,243 | 5,792 |
| 26 | Mount Sterling | 7,549 | 19.9% | $50,843 | 1,504 |
| 27 | Harrodsburg | 9,126 | 15.8% | $46,821 | 1,443 |
| 28 | Russellville | 7,244 | 16.8% | $47,875 | 1,215 |
| 29 | Hazard | 5,105 | 32.6% | $68,582 | 1,663 |
| 30 | Owensboro | 60,112 | 19.9% | $53,295 | 11,956 |
| 31 | Madisonville | 19,442 | 20.9% | $56,902 | 4,063 |
| 32 | Covington | 40,902 | 21.8% | $58,814 | 8,904 |
| 33 | Paris | 10,107 | 16.8% | $49,464 | 1,697 |
| 34 | Highland Heights | 6,531 | 18.5% | $52,437 | 1,210 |
| 35 | Frankfort | 28,452 | 18.7% | $54,438 | 5,326 |
| 36 | Berea | 15,557 | 19.5% | $56,484 | 3,030 |
| 37 | Franklin | 10,254 | 17.4% | $55,552 | 1,785 |
| 38 | Newport | 14,039 | 17.7% | $58,422 | 2,482 |
| 39 | Princeton | 6,242 | 13.7% | $51,875 | 857 |
| 40 | Dayton | 5,703 | 18.3% | $62,500 | 1,044 |
| 41 | Danville | 17,235 | 15.1% | $53,370 | 2,600 |
| 42 | Flatwoods | 7,281 | 17.1% | $60,467 | 1,248 |
| 43 | Elizabethtown | 31,870 | 15.7% | $56,250 | 5,000 |
| 44 | Versailles | 10,382 | 16.9% | $58,834 | 1,750 |
| 45 | Shepherdsville | 14,351 | 20.6% | $71,250 | 2,957 |
| 46 | Winchester | 19,133 | 15.8% | $57,653 | 3,030 |
| 47 | Bardstown | 13,673 | 11.1% | $49,781 | 1,520 |
| 48 | Louisville/Jefferson County metro government (balance) | 627,210 | 16.1% | $64,731 | 101,168 |
| 49 | Elsmere | 9,151 | 14.7% | $61,427 | 1,344 |
| 50 | Radcliff | 22,967 | 13.3% | $60,976 | 3,052 |
| 51 | Lexington-Fayette urban county | 321,122 | 15.7% | $67,631 | 50,351 |
| 52 | Bellevue | 5,598 | 13.4% | $67,143 | 747 |
| 53 | Wilmore | 6,031 | 11.8% | $64,245 | 709 |
| 54 | Lawrenceburg | 11,838 | 11.8% | $63,690 | 1,393 |
| 55 | Nicholasville | 31,625 | 12.4% | $67,514 | 3,934 |
| 56 | Hillview | 8,735 | 11.2% | $65,732 | 980 |
| 57 | Vine Grove | 6,721 | 12.6% | $74,786 | 848 |
| 58 | Middletown | 9,622 | 11.7% | $74,129 | 1,127 |
| 59 | Shelbyville | 17,436 | 11.6% | $73,733 | 2,026 |
| 60 | Taylor Mill | 6,880 | 13.4% | $83,210 | 923 |
| 61 | Georgetown | 38,206 | 12.2% | $78,373 | 4,642 |
| 62 | Florence | 32,334 | 9.7% | $68,508 | 3,129 |
| 63 | Lyndon | 10,956 | 7.8% | $65,392 | 860 |
| 64 | Erlanger | 19,677 | 11.0% | $78,420 | 2,172 |
| 65 | Cold Spring | 6,298 | 10.2% | $80,172 | 641 |
| 66 | Walton | 5,513 | 7.9% | $76,375 | 436 |
| 67 | Fort Mitchell | 8,676 | 8.8% | $80,814 | 760 |
| 68 | Jeffersontown | 28,988 | 6.8% | $78,185 | 1,979 |
| 69 | St. Matthews | 17,491 | 8.0% | $80,716 | 1,397 |
| 70 | La Grange | 10,188 | 8.4% | $86,222 | 857 |
| 71 | Independence | 29,024 | 8.5% | $98,653 | 2,458 |
| 72 | Douglass Hills | 5,437 | 3.9% | $92,826 | 212 |
| 73 | Mount Washington | 18,228 | 4.6% | $93,852 | 842 |
| 74 | Fort Thomas | 17,242 | 4.8% | $100,819 | 836 |
| 75 | Crestwood | 6,275 | 5.7% | $101,086 | 357 |
| 76 | Alexandria | 10,430 | 6.4% | $103,750 | 666 |
| 77 | Fort Wright | 5,882 | 3.9% | $100,647 | 229 |
| 78 | Villa Hills | 7,378 | 3.4% | $108,750 | 251 |
| 79 | Edgewood | 8,429 | 3.0% | $121,045 | 257 |
| 80 | Union | 7,494 | 3.3% | $139,013 | 250 |
Have you ever been to Hazard, Kentucky? It should have been in the top five of the most ghetto.
Whitley City, KY and other cities in McCreary County is worse than all the ones you posted.
Cadiz Ky is also poor
Where is Beattyville on this list?