
Like all states, Michigan has certain places that are going on hard times. These Michigan places have an above-average percentage of people living in poverty, out of work, or not making as much as they should be.
Even as the economy continues to improve, it’s worthwhile to look at the places in each state struggling to make ends meet. So we set our sites on locating the poorest places in Michigan.
To do so, we used Saturday Night Science to analyze the newest Census data from the American Community Survey for the 154 cities in Michigan with more than 5,000 people.
Table Of Contents: Top Ten | Methodology | Summary | Table
The 10 Poorest Places In Michigan For 2025:
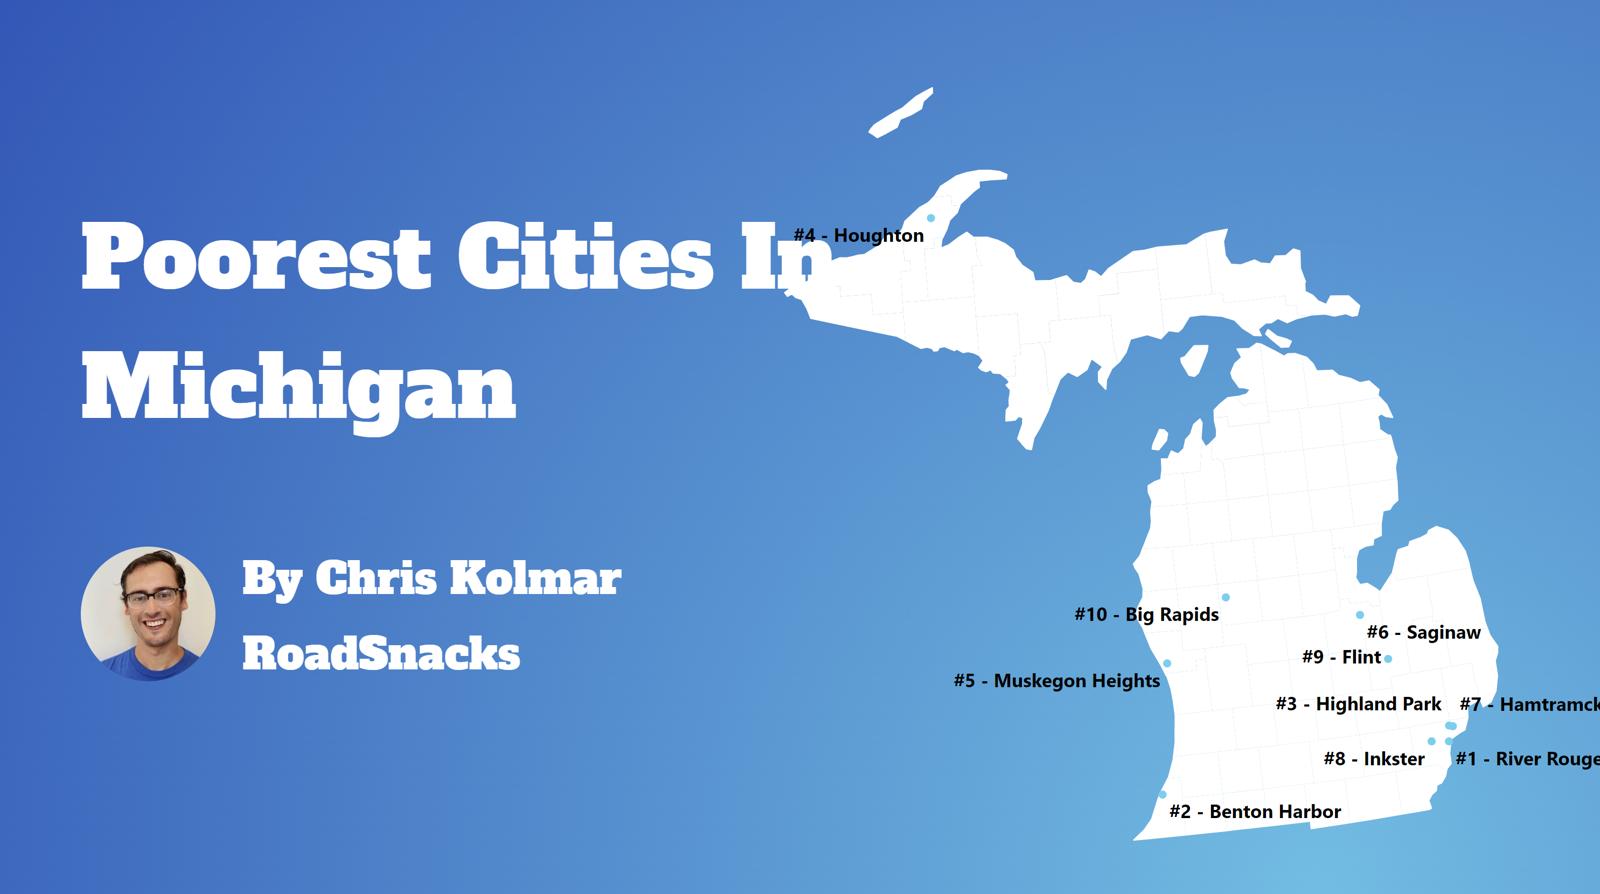
What’s the poorest city in Michigan? According to the facts, Highland Park is the poorest place in Michigan for 2025.
This isn’t a commentary on the people that live there or the vibrant culture and traditions of these places. Instead, it’s just a look at the facts.
For more Michigan reading, check out:
- Best Places To Live In Michigan
- Cheapest Places To Live In Michigan
- Most Dangerous Places in Michigan
- The poorest states in the US
- The poorest cities in the US
The 10 Poorest Cities In Michigan For 2025
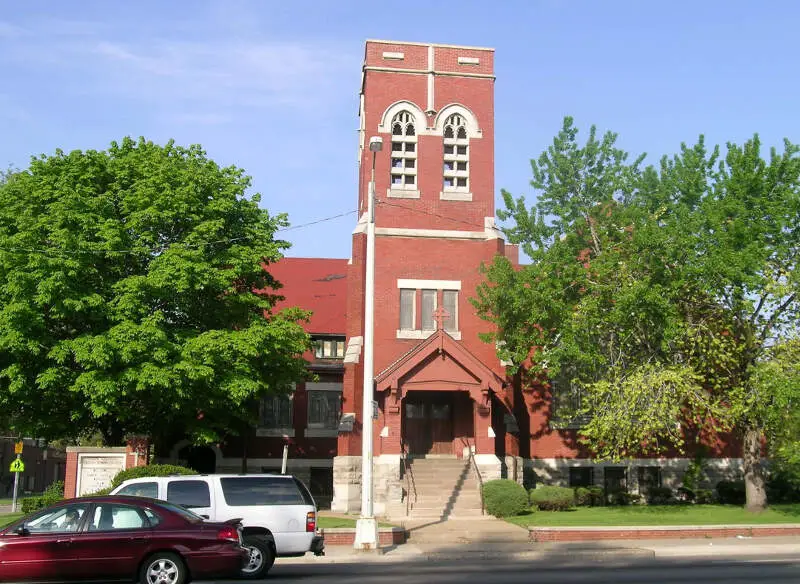
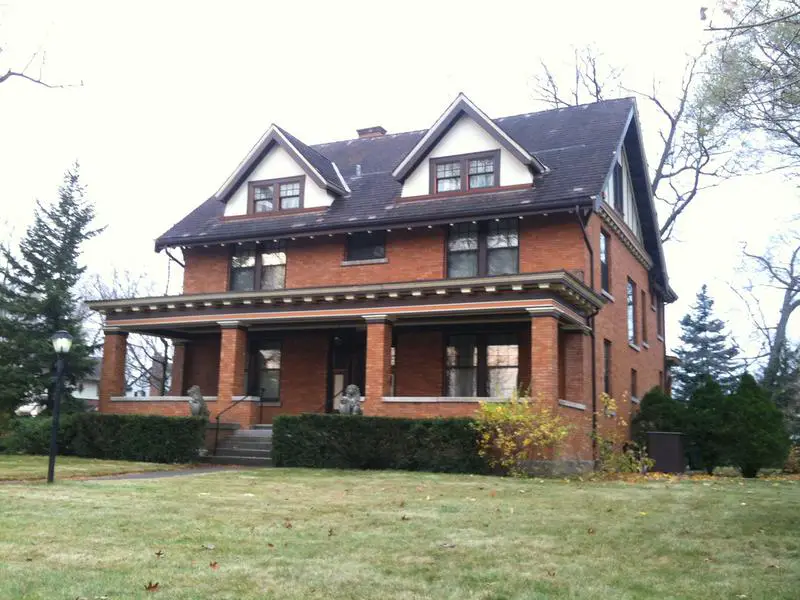
1. Highland Park
/10
Population: 8,798
Rank Last Year: 3 (Up 2)
Median Income: $27,582 (lowest)
Poverty Rate: 41.2% (2nd highest)
People In Poverty: 3,621
More on Highland Park: Data
Highland Park, unfortunately, ranks as the poorest place in Michigan thanks to combination of low pay and and a lack of jobs.
The city of 8,798 people averages the lowest median household income in Michigan and the 2nd highest poverty rate. At the very least, the cost of living ranks in the bottom 15% of place in the state, so things like housing are relatively affordable.
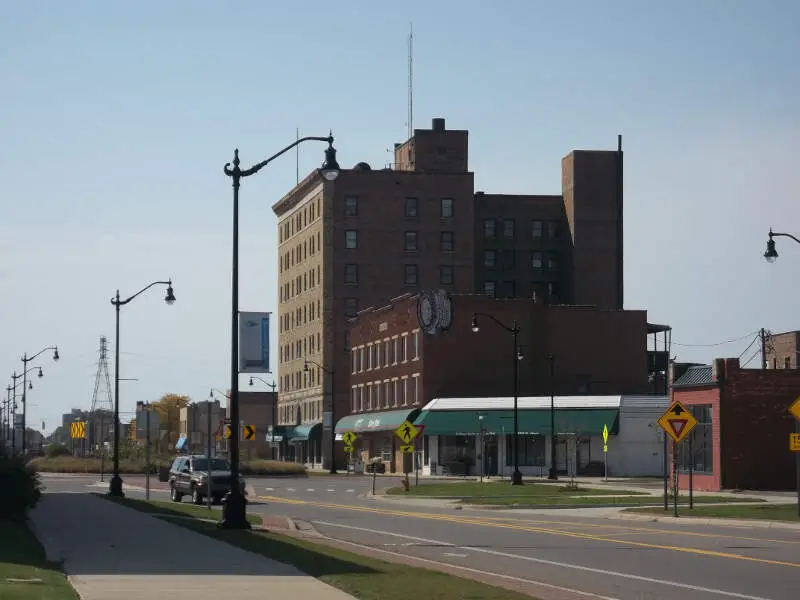
2. Benton Harbor
/10
Population: 9,023
Rank Last Year: 2 (No Change)
Median Income: $29,652 (2nd lowest)
Poverty Rate: 41.9% (highest)
People In Poverty: 3,784
More on Benton Harbor: Data
The second poorest city in Michigan is Benton Harbor.
The city ranks as having the highest incidence of poverty and 2nd lowest median household income. However, the unemployment rate ‘only’ ranks as the highest in the Wolverine State.
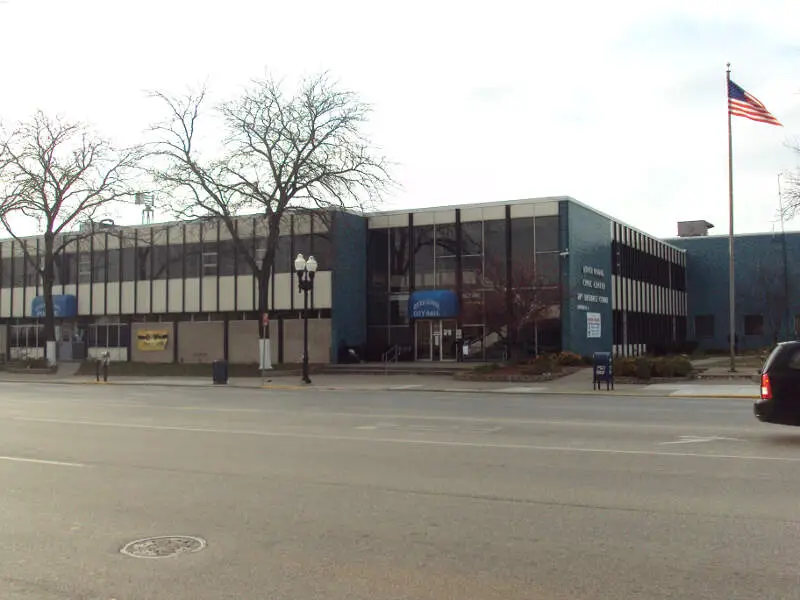
3. River Rouge
/10
Population: 7,092
Rank Last Year: 1 (Down 2)
Median Income: $32,568 (3rd lowest)
Poverty Rate: 40.0% (3rd highest)
People In Poverty: 2,838
More on River Rouge: Data
Placing as the third poorest city, River Rouge’s median income ranks as the 3rd lowest.
And that’s a sign that there’s a relatively substantial jump in the quality of the economy from second to third place on our list. The poverty rate is 40.02% and ranks near the bottom of places in the state.
But what makes up for the relatively low incomes of the city is its low cost of living. The income you do make here goes further than in most parts of the Wolverine State.
4. Muskegon Heights
/10
Population: 9,902
Rank Last Year: 5 (Up 1)
Median Income: $33,780 (4th lowest)
Poverty Rate: 37.1% (5th highest)
People In Poverty: 3,677
More on Muskegon Heights: Data
Muskegon Heights ranks as the fourth poorest place in Michigan.
The town ranks as having the 4th lowest median household income and the 5th highest incidence of poverty in the state.
That being said, there’s still a ton of cultural diversity in the city as it hosts many events throughout the year.
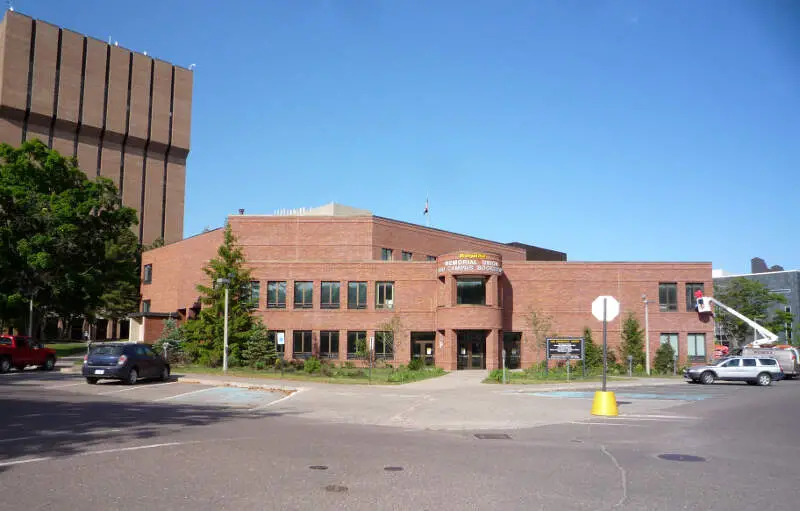
5. Houghton
/10
Population: 8,341
Rank Last Year: 4 (Down 1)
Median Income: $35,417 (5th lowest)
Poverty Rate: 34.9% (9th highest)
People In Poverty: 2,913
More on Houghton: Data
The fifth poorest city in Michigan is Houghton.
The city ranks as having the 5th lowest median income in the state. However, an extremely low cost of living prevents a good number of folks from living in poverty as the poverty rate only ranks as the 9th highest in Michigan.
Still not the best news for Houghton.
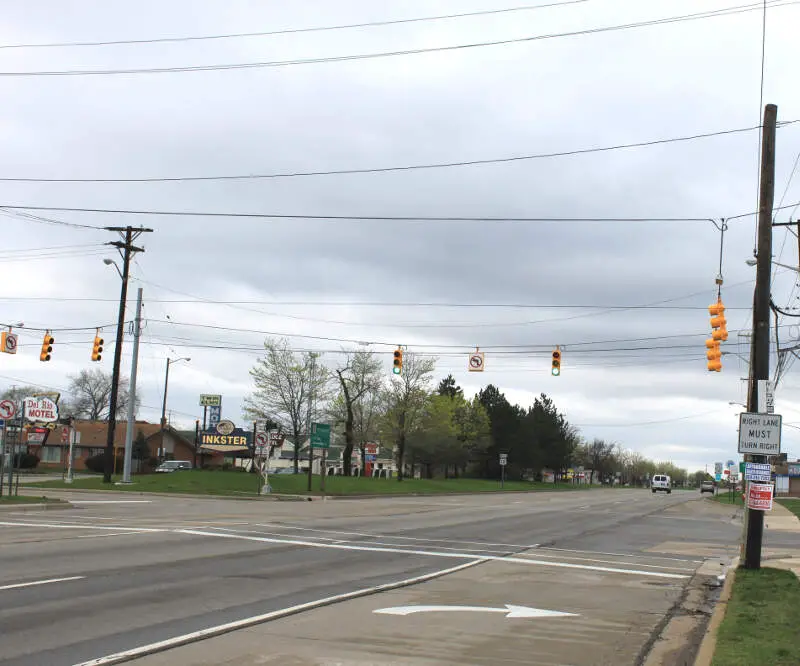
6. Inkster
/10
Population: 25,602
Rank Last Year: 7 (Up 1)
Median Income: $39,632 (11th lowest)
Poverty Rate: 36.3% (6th highest)
People In Poverty: 9,298
More on Inkster: Data
Inkster ranks as the sixth poorest place in the Wolverine State.
It ranks as having the 6th highest incidence of poverty and the 8th highest unemployment rate.
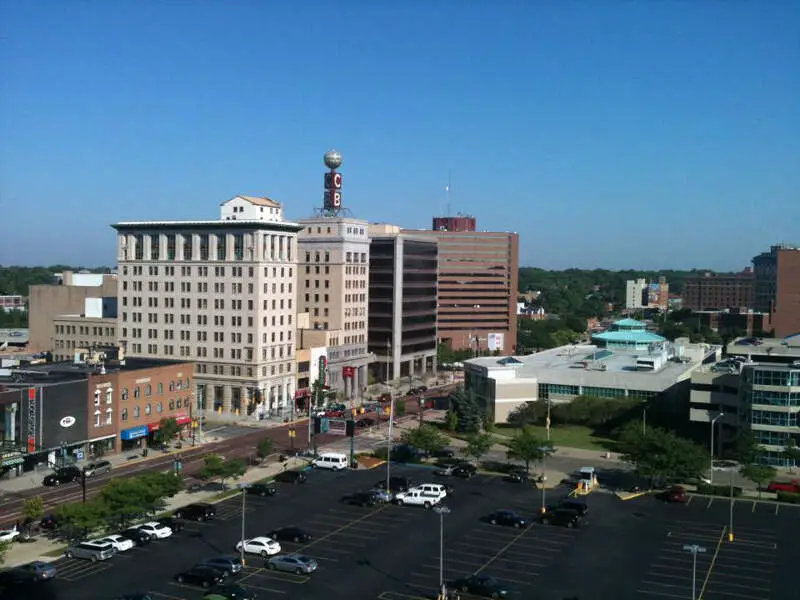
7. Flint
/10
Population: 80,835
Rank Last Year: 9 (Up 2)
Median Income: $36,194 (6th lowest)
Poverty Rate: 34.4% (11th highest)
People In Poverty: 27,791
More on Flint: Data
Flint places as the seventh poorest city in Michigan.
The city of over 80,835 ranks as having the 11th highest incidence of poverty in the state. However, it has a very low cost of living which helps to pay the bills each month.
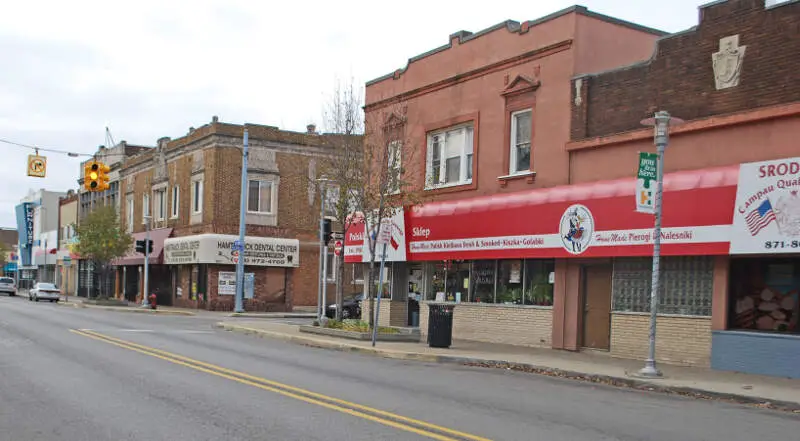
8. Hamtramck
/10
Population: 27,830
Rank Last Year: 8 (No Change)
Median Income: $40,103 (14th lowest)
Poverty Rate: 38.2% (4th highest)
People In Poverty: 10,633
More on Hamtramck: Data
Hamtramck ranks as the eighth poorest city in Michigan.
The big issue for the town is the unemployment rate which ranks as one of the highest in the state.
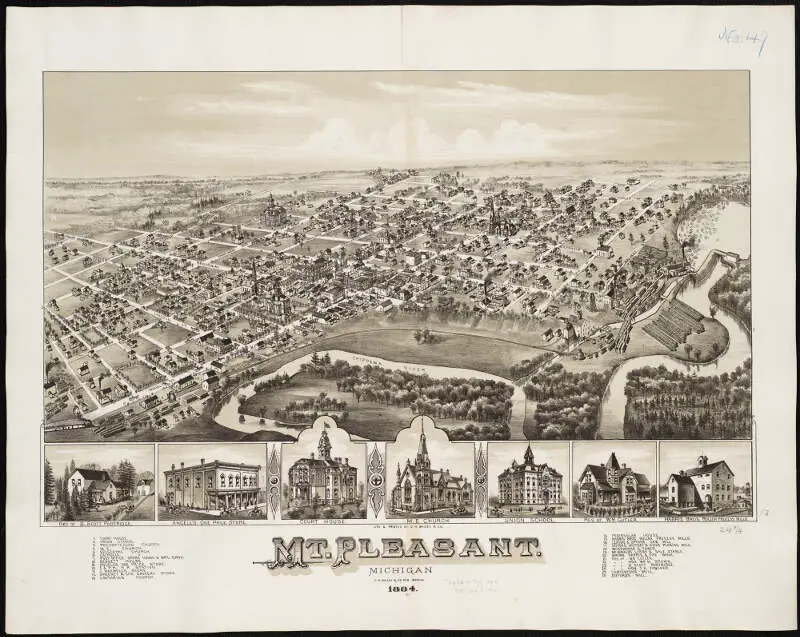
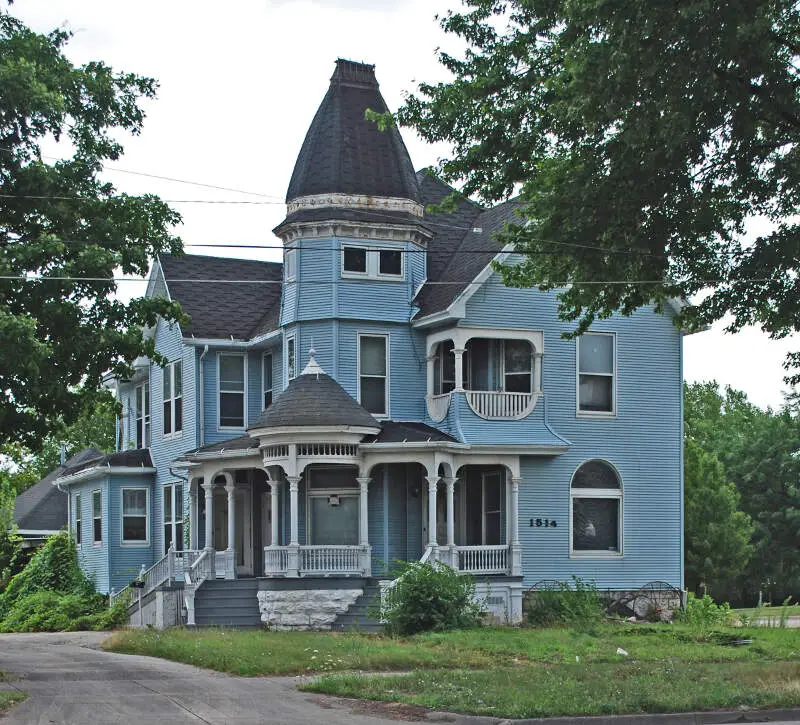
9. Mount Pleasant
/10
Population: 21,420
Rank Last Year: 13 (Up 4)
Median Income: $39,924 (12th lowest)
Poverty Rate: 35.8% (7th highest)
People In Poverty: 7,659
More on Mount Pleasant: Data
Mount Pleasant couldn’t stay out of the top ten poorest places in Michigan; it ranks number 9.
While the median income is the 12th lowest, there are a substantial number of people that live below the poverty line. Overall, Mount Pleasant ranks as having the 7th most people living in poverty of all the places we analyzed in Michigan.
10. Saginaw
/10
Population: 43,879
Rank Last Year: 6 (Down 4)
Median Income: $37,298 (8th lowest)
Poverty Rate: 33.5% (13th highest)
People In Poverty: 14,690
More on Saginaw: Data
And rounding out the top ten poorest cities in Michigan is Saginaw.
The city of 43,879 people ranks in the bottom 20% for both median income and poverty rate in the Wolverine State.
Methodology: How We Determined The Poorest Places In Michigan for 2025
The first thing that comes to most people’s minds when they think about determining the poorest places is to simply the poverty rate. That is, the number of people living below a federally established level of income for a household of a certain size.
However, we don’t think that one statistic wholly encompasses what it means to be one of the “poorest places”. So we used Saturday Night Science to look at this set of criteria from the newly released 2019-2023 American Community Survey:
- Poverty Level
- Median Household Income
After we collected the data for all 154 places with more than 5,000 people in Michigan, we ranked each place from 1 to 154 for each of the criteria, with 1 being the poorest.
We then averaged all the rankings for a place into a “Poor Score” with the place having the lowest overall Poor Score, Highland Park, crowned the “Poorest Place In Michigan For 2025”.
This report has been updated for 2025, which is our tenth time ranking the poorest places in Michigan.
Summary: The Poorest Cities In Michigan For 2025
Like we said earlier, when we set out to identify the poorest places in Michigan, we weren’t sure what we’d encounter, but it ended up being some of the best places to live in Michigan.
When you look at the data, the cities and places mentioned above meet the criteria for being at the very bottom of the income ladder for everyone that lives there.
If you’re curious enough, here are the richest cities in Michigan, according to data:
-
Richest: Huntington Woods
2nd Richest: Beverly Hills
3rd Richest: Grosse Pointe Farms
For more Michigan reading, check out:
- Richest Cities In Michigan
- Safest Places In Michigan
- Worst Places To Live In Michigan
- Most Expensive Places To Live In Michigan
Detailed List Of The Poorest Places To Live In Michigan
| Rank | City | Population | Poverty Rate | Median Income | People In Poverty |
|---|---|---|---|---|---|
| 1 | Highland Park | 8,798 | 41.2% | $27,582 | 3,621 |
| 2 | Benton Harbor | 9,023 | 41.9% | $29,652 | 3,784 |
| 3 | River Rouge | 7,092 | 40.0% | $32,568 | 2,838 |
| 4 | Muskegon Heights | 9,902 | 37.1% | $33,780 | 3,677 |
| 5 | Houghton | 8,341 | 34.9% | $35,417 | 2,913 |
| 6 | Inkster | 25,602 | 36.3% | $39,632 | 9,298 |
| 7 | Flint | 80,835 | 34.4% | $36,194 | 27,791 |
| 8 | Hamtramck | 27,830 | 38.2% | $40,103 | 10,633 |
| 9 | Mount Pleasant | 21,420 | 35.8% | $39,924 | 7,659 |
| 10 | Saginaw | 43,879 | 33.5% | $37,298 | 14,690 |
| 11 | Detroit | 636,644 | 31.5% | $39,575 | 200,606 |
| 12 | Big Rapids | 7,847 | 35.4% | $40,197 | 2,777 |
| 13 | Dowagiac | 5,677 | 30.4% | $38,433 | 1,724 |
| 14 | Melvindale | 12,605 | 34.4% | $41,356 | 4,334 |
| 15 | Albion | 7,608 | 27.2% | $40,040 | 2,068 |
| 16 | East Lansing | 45,394 | 34.1% | $43,547 | 15,502 |
| 17 | Pontiac | 61,914 | 25.6% | $42,791 | 15,868 |
| 18 | Jackson | 31,206 | 25.5% | $42,848 | 7,966 |
| 19 | Adrian | 20,493 | 23.7% | $42,851 | 4,852 |
| 20 | Ypsilanti | 19,937 | 25.5% | $44,141 | 5,083 |
| 21 | Ecorse | 9,170 | 24.0% | $45,082 | 2,200 |
| 22 | Escanaba | 12,374 | 21.1% | $40,169 | 2,607 |
| 23 | Ludington | 7,664 | 23.3% | $44,471 | 1,788 |
| 24 | Kalamazoo | 73,132 | 27.0% | $48,965 | 19,752 |
| 25 | Springfield | 5,295 | 22.1% | $43,681 | 1,170 |
| 26 | Hillsdale | 8,013 | 21.2% | $47,817 | 1,701 |
| 27 | Port Huron | 28,724 | 22.1% | $49,377 | 6,356 |
| 28 | Bay City | 32,445 | 21.5% | $47,904 | 6,972 |
| 29 | Niles | 11,838 | 20.9% | $47,815 | 2,469 |
| 30 | Muskegon | 37,203 | 20.2% | $46,342 | 7,500 |
| 31 | Alma | 9,421 | 21.9% | $50,506 | 2,064 |
| 32 | Ironwood | 5,004 | 14.9% | $37,191 | 747 |
| 33 | Alpena | 10,178 | 19.2% | $47,604 | 1,957 |
| 34 | Coldwater | 13,847 | 19.9% | $50,084 | 2,751 |
| 35 | Allegan | 5,182 | 15.1% | $42,261 | 780 |
| 36 | Lapeer | 9,053 | 21.0% | $53,038 | 1,904 |
| 37 | Lansing | 112,546 | 19.9% | $52,170 | 22,419 |
| 38 | Marquette | 20,691 | 21.8% | $55,825 | 4,506 |
| 39 | Lincoln Park | 39,511 | 22.1% | $57,183 | 8,743 |
| 40 | St. Louis | 6,926 | 15.4% | $46,096 | 1,064 |
| 41 | Battle Creek | 52,392 | 18.0% | $51,699 | 9,451 |
| 42 | Menominee | 8,370 | 16.2% | $49,646 | 1,360 |
| 43 | Sault Ste. Marie | 13,373 | 18.7% | $55,031 | 2,495 |
| 44 | Cadillac | 10,404 | 17.4% | $50,512 | 1,806 |
| 45 | Ishpeming | 6,173 | 17.5% | $52,717 | 1,078 |
| 46 | Davison | 5,082 | 16.1% | $50,450 | 820 |
| 47 | Three Rivers | 7,936 | 15.0% | $48,852 | 1,191 |
| 48 | Richmond | 5,839 | 23.4% | $61,715 | 1,364 |
| 49 | Belding | 5,949 | 17.8% | $55,895 | 1,058 |
| 50 | Dearborn | 107,846 | 24.3% | $65,192 | 26,174 |
| 51 | Dearborn Heights | 62,099 | 20.4% | $61,035 | 12,680 |
| 52 | Owosso | 14,658 | 15.6% | $53,702 | 2,280 |
| 53 | Eastpointe | 34,003 | 18.2% | $58,196 | 6,174 |
| 54 | Monroe | 20,330 | 18.3% | $59,532 | 3,720 |
| 55 | Wayne | 17,413 | 15.3% | $54,467 | 2,671 |
| 56 | Burton | 29,529 | 17.1% | $57,767 | 5,037 |
| 57 | Harper Woods | 15,205 | 19.8% | $61,446 | 3,007 |
| 58 | Zeeland | 5,691 | 11.4% | $49,367 | 648 |
| 59 | Taylor | 62,405 | 16.7% | $59,537 | 10,427 |
| 60 | Center Line | 8,448 | 12.6% | $52,857 | 1,066 |
| 61 | Ionia | 12,950 | 16.4% | $60,729 | 2,119 |
| 62 | Sturgis | 11,077 | 16.0% | $60,640 | 1,770 |
| 63 | Mount Clemens | 15,567 | 14.3% | $57,663 | 2,227 |
| 64 | Gladstone | 5,240 | 14.2% | $57,534 | 741 |
| 65 | Greenville | 8,897 | 11.5% | $55,477 | 1,022 |
| 66 | Grand Rapids | 197,768 | 18.6% | $65,526 | 36,804 |
| 67 | Manistee | 6,275 | 14.0% | $59,315 | 880 |
| 68 | Iron Mountain | 7,508 | 11.5% | $56,622 | 861 |
| 69 | Grand Haven | 10,966 | 12.7% | $60,665 | 1,393 |
| 70 | New Haven | 6,341 | 17.7% | $68,203 | 1,124 |
| 71 | Hazel Park | 14,945 | 13.6% | $62,878 | 2,038 |
| 72 | Westland | 84,155 | 13.3% | $62,216 | 11,175 |
| 73 | St. Johns | 7,712 | 13.4% | $63,030 | 1,036 |
| 74 | Ann Arbor | 121,179 | 22.9% | $81,089 | 27,810 |
| 75 | Roseville | 47,240 | 11.8% | $61,222 | 5,569 |
| 76 | Warren | 138,128 | 12.8% | $63,741 | 17,680 |
| 77 | Wyandotte | 24,593 | 15.3% | $67,846 | 3,772 |
| 78 | Oak Park | 29,370 | 14.2% | $65,882 | 4,173 |
| 79 | Hastings | 7,515 | 8.7% | $56,309 | 656 |
| 80 | Charlotte | 9,269 | 11.7% | $63,385 | 1,079 |
| 81 | Fraser | 14,604 | 10.3% | $61,118 | 1,511 |
| 82 | Kingsford | 5,138 | 9.8% | $61,108 | 503 |
| 83 | Garden City | 26,910 | 11.3% | $64,396 | 3,032 |
| 84 | Holly | 5,971 | 10.0% | $61,221 | 595 |
| 85 | Utica | 5,184 | 7.0% | $55,524 | 360 |
| 86 | Howell | 10,074 | 7.1% | $57,122 | 714 |
| 87 | Southfield | 76,025 | 11.2% | $65,848 | 8,537 |
| 88 | Madison Heights | 28,411 | 11.3% | $66,726 | 3,218 |
| 89 | Eaton Rapids | 5,197 | 10.2% | $63,618 | 528 |
| 90 | Walled Lake | 7,275 | 11.2% | $67,335 | 814 |
| 91 | Southgate | 29,551 | 9.8% | $64,635 | 2,895 |
| 92 | Flat Rock | 10,418 | 12.5% | $73,288 | 1,301 |
| 93 | Romulus | 24,951 | 11.0% | $72,235 | 2,742 |
| 94 | Wyoming | 76,865 | 10.8% | $72,163 | 8,339 |
| 95 | St. Clair | 5,581 | 9.6% | $68,482 | 532 |
| 96 | Holland | 34,266 | 10.9% | $72,905 | 3,724 |
| 97 | Wixom | 17,126 | 8.7% | $68,319 | 1,484 |
| 98 | Traverse City | 15,491 | 9.1% | $71,731 | 1,403 |
| 99 | Woodhaven | 12,761 | 12.1% | $83,291 | 1,546 |
| 100 | Auburn Hills | 24,911 | 11.2% | $78,727 | 2,792 |