
Like all states, Tennessee has certain places that are going on hard times. These Tennessee places have an above-average percentage of people living in poverty, out of work, or not making as much as they should be.
Even as the economy continues to improve, it’s worthwhile to look at the places in each state struggling to make ends meet. So we set our sites on locating the poorest places in Tennessee.
To do so, we used Saturday Night Science to analyze the newest Census data from the American Community Survey for the 101 cities in Tennessee with more than 5,000 people.
Table Of Contents: Top Ten | Methodology | Summary | Table
The 10 Poorest Places In Tennessee For 2025:
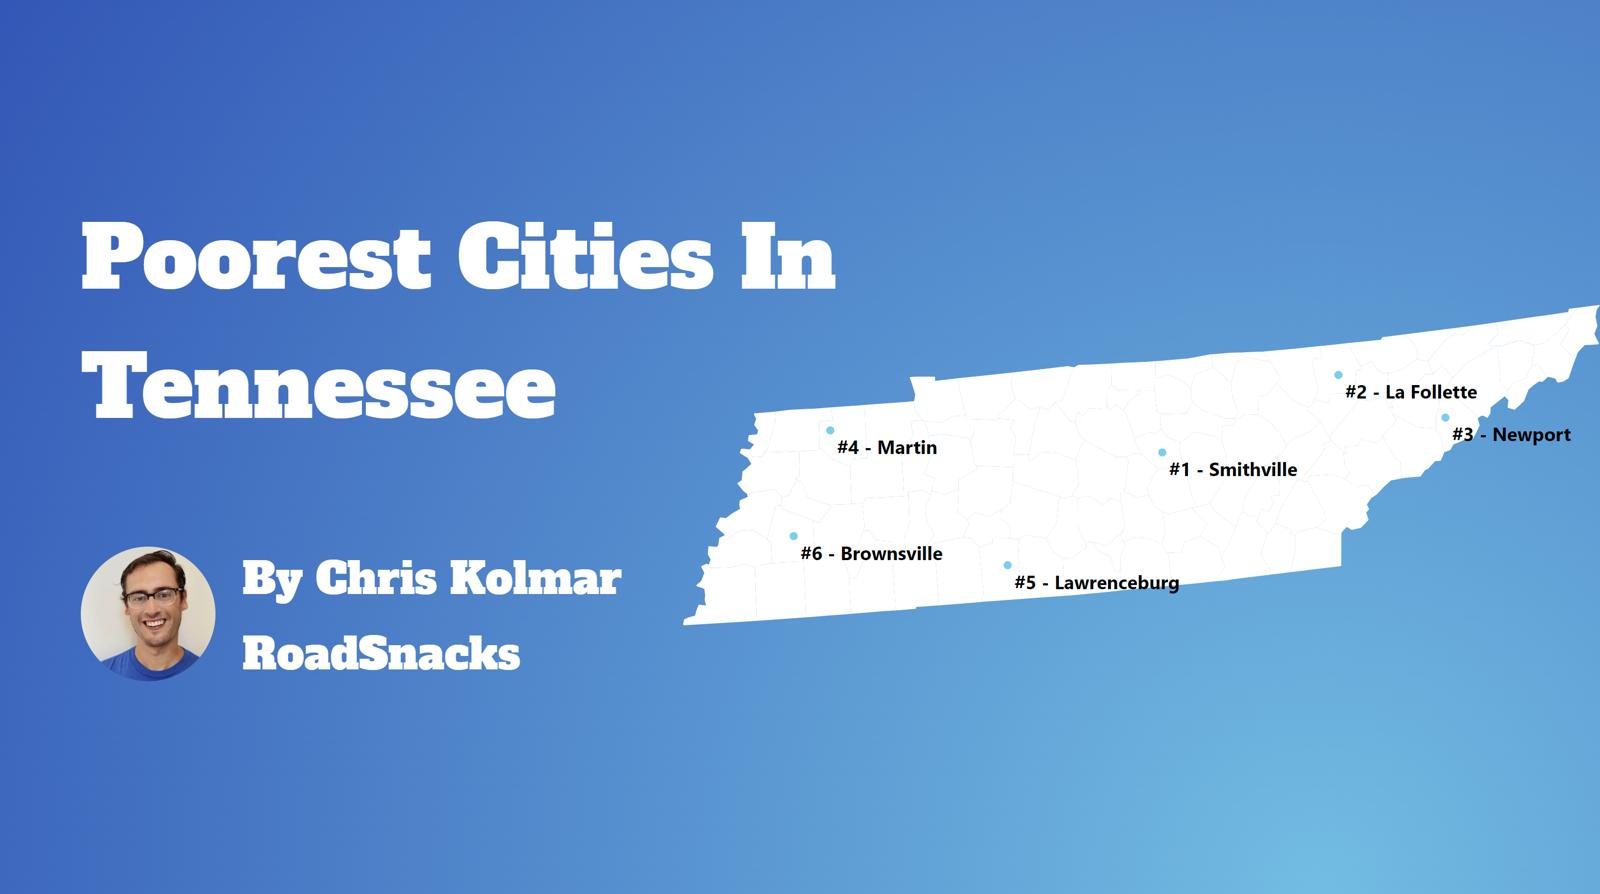
What’s the poorest city in Tennessee? According to the facts, Smithville is the poorest place in Tennessee for 2025.
This isn’t a commentary on the people that live there or the vibrant culture and traditions of these places. Instead, it’s just a look at the facts.
For more Tennessee reading, check out:
- Best Places To Live In Tennessee
- Cheapest Places To Live In Tennessee
- Most Dangerous Cities In Tennessee
- The poorest states in the US
- The poorest cities in the US
The 10 Poorest Cities In Tennessee For 2025
1. Smithville
/10
Population: 5,158
Rank Last Year: 1 (No Change)
Median Income: $29,507 (lowest)
Poverty Rate: 38.3% (2nd highest)
People In Poverty: 1,976
More on Smithville: Data
Smithville, unfortunately, ranks as the poorest place in Tennessee thanks to combination of low pay and and a lack of jobs.
The city of 5,158 people averages the lowest median household income in Tennessee and the 2nd highest poverty rate. At the very least, the cost of living ranks in the bottom 15% of place in the state, so things like housing are relatively affordable.
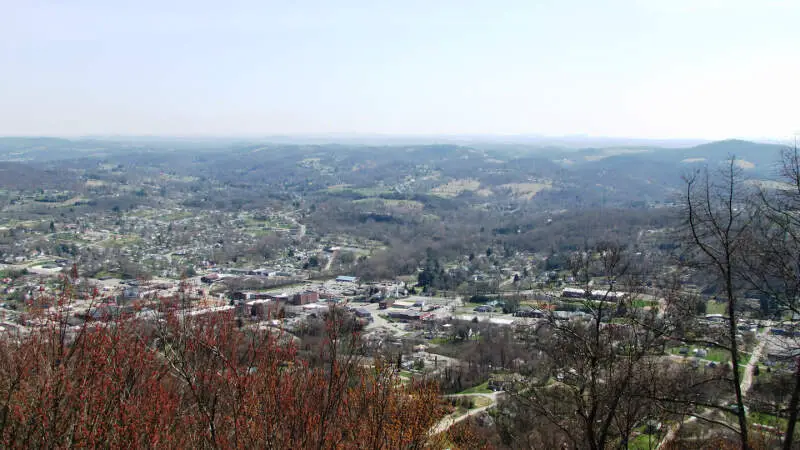
2. La Follette
/10
Population: 7,308
Rank Last Year: 2 (No Change)
Median Income: $34,678 (2nd lowest)
Poverty Rate: 30.7% (3rd highest)
People In Poverty: 2,241
More on La Follette: Data
The second poorest city in Tennessee is La Follette.
The city ranks as having the 3rd highest incidence of poverty and 2nd lowest median household income. However, the unemployment rate ‘only’ ranks as the 22nd highest in the Volunteer State.
3. Dunlap
/10
Population: 5,546
Rank Last Year: 7 (Up 4)
Median Income: $38,666 (6th lowest)
Poverty Rate: 39.6% (highest)
People In Poverty: 2,197
More on Dunlap: Data
Placing as the third poorest city, Dunlap’s median income ranks as the 6th lowest.
And that’s a sign that there’s a relatively substantial jump in the quality of the economy from second to third place on our list. The poverty rate is 39.62% and ranks near the bottom of places in the state.
But what makes up for the relatively low incomes of the city is its low cost of living. The income you do make here goes further than in most parts of the Volunteer State.
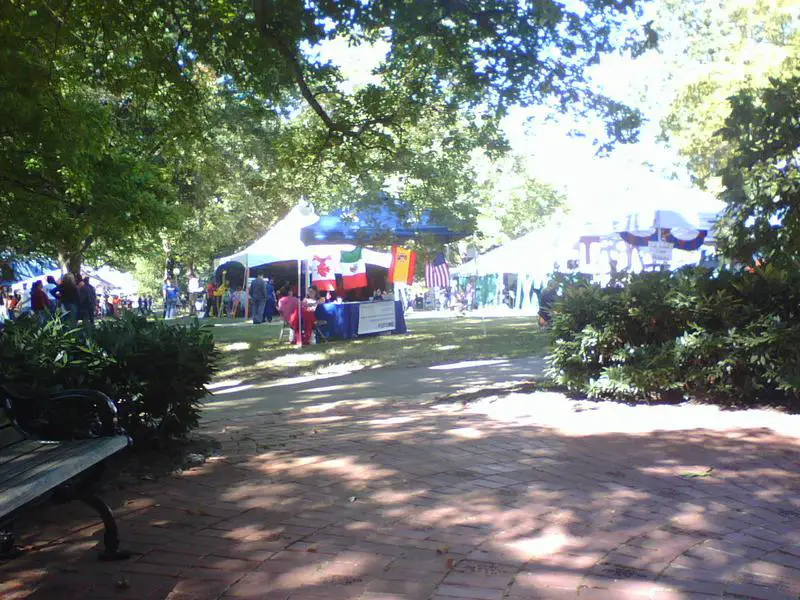
4. Ripley
/10
Population: 7,718
Rank Last Year: 9 (Up 5)
Median Income: $39,047 (7th lowest)
Poverty Rate: 28.7% (4th highest)
People In Poverty: 2,217
More on Ripley: Data
Ripley ranks as the fourth poorest place in Tennessee.
The town ranks as having the 7th lowest median household income and the 4th highest incidence of poverty in the state.
That being said, there’s still a ton of cultural diversity in the city as it hosts many events throughout the year.
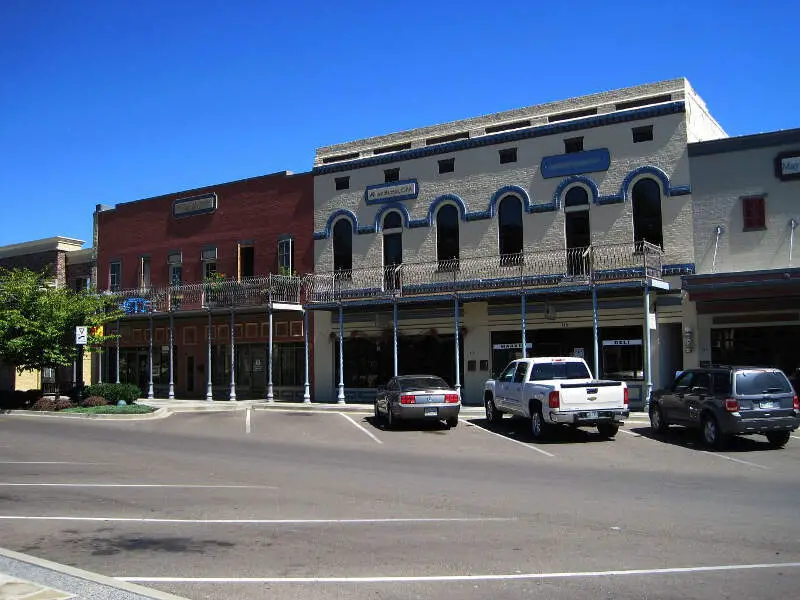
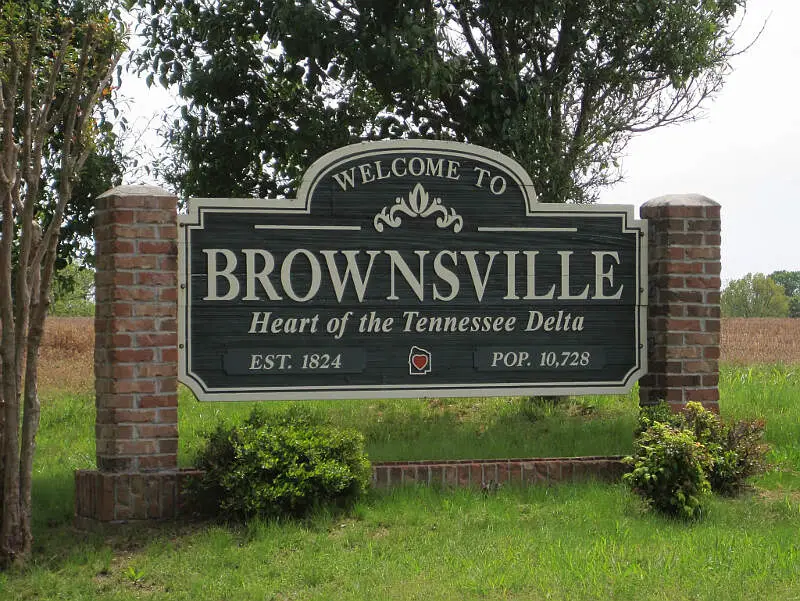
5. Brownsville
/10
Population: 9,634
Rank Last Year: 6 (Up 1)
Median Income: $39,488 (9th lowest)
Poverty Rate: 27.5% (8th highest)
People In Poverty: 2,646
More on Brownsville: Data
The fifth poorest city in Tennessee is Brownsville.
The city ranks as having the 9th lowest median income in the state. However, an extremely low cost of living prevents a good number of folks from living in poverty as the poverty rate only ranks as the 8th highest in Tennessee.
Still not the best news for Brownsville.
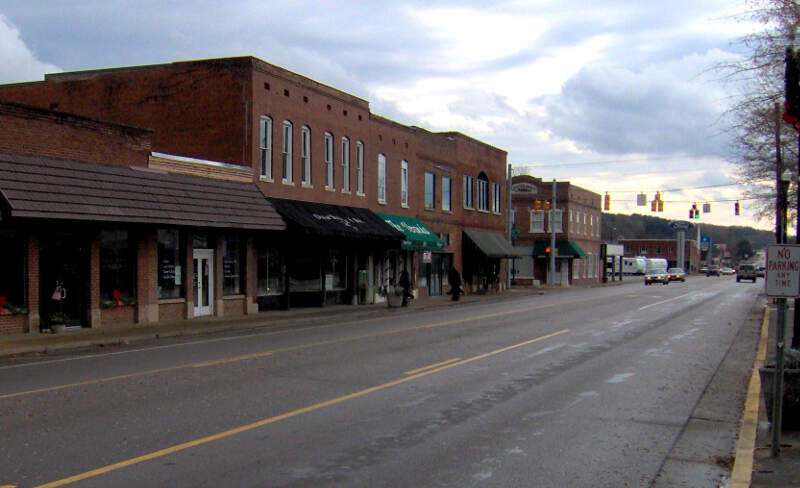
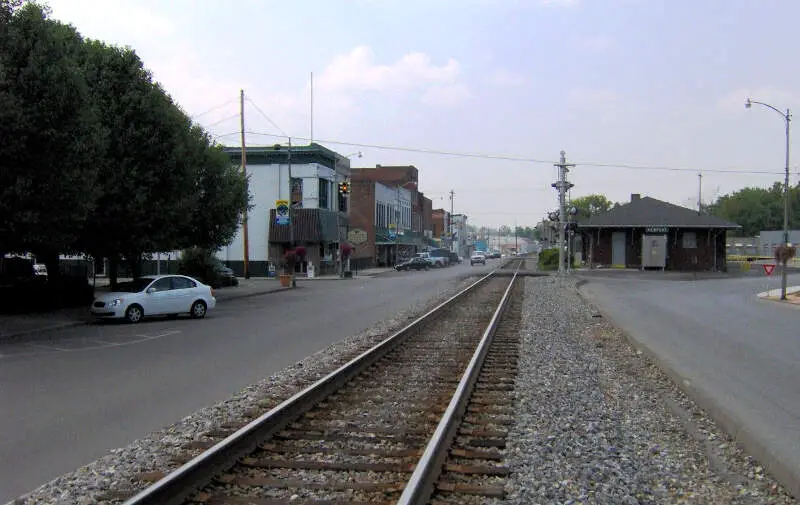
6. Newport
/10
Population: 6,881
Rank Last Year: 3 (Down 3)
Median Income: $40,096 (10th lowest)
Poverty Rate: 27.9% (7th highest)
People In Poverty: 1,919
More on Newport: Data
Newport ranks as the sixth poorest place in the Volunteer State.
It ranks as having the 7th highest incidence of poverty and the 99th highest unemployment rate.
7. Martin
/10
Population: 10,864
Rank Last Year: 4 (Down 3)
Median Income: $41,510 (13th lowest)
Poverty Rate: 27.9% (6th highest)
People In Poverty: 3,031
More on Martin: Data
Martin places as the seventh poorest city in Tennessee.
The city of over 10,864 ranks as having the 6th highest incidence of poverty in the state. However, it has a very low cost of living which helps to pay the bills each month.
8. Bolivar
/10
Population: 5,171
Rank Last Year: 23 (Up 15)
Median Income: $38,575 (5th lowest)
Poverty Rate: 24.6% (14th highest)
People In Poverty: 1,271
More on Bolivar: Data
Bolivar ranks as the eighth poorest city in Tennessee.
The big issue for the town is the unemployment rate which ranks as one of the highest in the state.
9. Savannah
/10
Population: 7,219
Rank Last Year: 13 (Up 4)
Median Income: $41,396 (11th lowest)
Poverty Rate: 25.9% (9th highest)
People In Poverty: 1,868
More on Savannah: Data
Savannah couldn’t stay out of the top ten poorest places in Tennessee; it ranks number 9.
While the median income is the 11th lowest, there are a substantial number of people that live below the poverty line. Overall, Savannah ranks as having the 9th most people living in poverty of all the places we analyzed in Tennessee.
10. McKenzie
/10
Population: 5,706
Rank Last Year: 25 (Up 15)
Median Income: $35,988 (3rd lowest)
Poverty Rate: 23.2% (18th highest)
People In Poverty: 1,324
More on Mckenzie: Data
And rounding out the top ten poorest cities in Tennessee is McKenzie.
The city of 5,706 people ranks in the bottom 20% for both median income and poverty rate in the Volunteer State.
Methodology: How We Determined The Poorest Places In Tennessee for 2025
The first thing that comes to most people’s minds when they think about determining the poorest places is to simply the poverty rate. That is, the number of people living below a federally established level of income for a household of a certain size.
However, we don’t think that one statistic wholly encompasses what it means to be one of the “poorest places”. So we used Saturday Night Science to look at this set of criteria from the newly released 2019-2023 American Community Survey:
- Poverty Level
- Median Household Income
After we collected the data for all 101 places with more than 5,000 people in Tennessee, we ranked each place from 1 to 101 for each of the criteria, with 1 being the poorest.
We then averaged all the rankings for a place into a “Poor Score” with the place having the lowest overall Poor Score, Smithville, crowned the “Poorest Place In Tennessee For 2025”.
This report has been updated for 2025, which is our tenth time ranking the poorest places in Tennessee.
Summary: The Poorest Cities In Tennessee For 2025
Like we said earlier, when we set out to identify the poorest places in Tennessee, we weren’t sure what we’d encounter, but it ended up being some of the best places to live in Tennessee.
When you look at the data, the cities and places mentioned above meet the criteria for being at the very bottom of the income ladder for everyone that lives there.
If you’re curious enough, here are the richest cities in Tennessee, according to data:
- Richest: Nolensville
2nd Richest: Brentwood
3rd Richest: Germantown
For more Tennessee reading, check out:
- Richest Cities In Tennessee
- Safest Places In Tennessee
- Worst Places To Live In Tennessee
- Most Expensive Places To Live In Tennessee
Detailed List Of The Poorest Places To Live In Tennessee
| Rank | City | Population | Poverty Rate | Median Income | People In Poverty |
|---|---|---|---|---|---|
| 1 | Smithville | 5,158 | 38.3% | $29,507 | 1,976 |
| 2 | La Follette | 7,308 | 30.7% | $34,678 | 2,241 |
| 3 | Dunlap | 5,546 | 39.6% | $38,666 | 2,197 |
| 4 | Ripley | 7,718 | 28.7% | $39,047 | 2,217 |
| 5 | Brownsville | 9,634 | 27.5% | $39,488 | 2,646 |
| 6 | Newport | 6,881 | 27.9% | $40,096 | 1,919 |
| 7 | Martin | 10,864 | 27.9% | $41,510 | 3,031 |
| 8 | Bolivar | 5,171 | 24.6% | $38,575 | 1,271 |
| 9 | Savannah | 7,219 | 25.9% | $41,396 | 1,868 |
| 10 | McKenzie | 5,706 | 23.2% | $35,988 | 1,324 |
| 11 | Paris | 10,313 | 24.8% | $39,365 | 2,560 |
| 12 | Covington | 8,612 | 25.8% | $43,512 | 2,225 |
| 13 | Pulaski | 8,305 | 28.1% | $45,420 | 2,337 |
| 14 | Lawrenceburg | 11,732 | 23.3% | $41,458 | 2,733 |
| 15 | Morristown | 30,983 | 25.4% | $44,811 | 7,875 |
| 16 | Harriman | 6,021 | 22.8% | $42,183 | 1,370 |
| 17 | Rockwood | 5,510 | 18.7% | $37,867 | 1,031 |
| 18 | Union City | 11,040 | 22.4% | $45,523 | 2,472 |
| 19 | Lewisburg | 12,607 | 25.7% | $52,634 | 3,243 |
| 20 | Cookeville | 35,544 | 21.9% | $48,501 | 7,798 |
| 21 | Dyersburg | 16,075 | 23.5% | $51,846 | 3,776 |
| 22 | Elizabethton | 14,364 | 19.0% | $44,834 | 2,723 |
| 23 | McMinnville | 13,765 | 18.5% | $43,348 | 2,550 |
| 24 | Memphis | 629,063 | 22.5% | $51,211 | 141,790 |
| 25 | Kingsport | 55,807 | 20.8% | $50,436 | 11,596 |
| 26 | Jackson | 68,098 | 22.6% | $51,552 | 15,424 |
| 27 | Sweetwater | 6,462 | 18.2% | $44,661 | 1,174 |
| 28 | Humboldt | 7,799 | 17.2% | $42,873 | 1,341 |
| 29 | Pigeon Forge | 6,345 | 23.0% | $53,839 | 1,457 |
| 30 | Knoxville | 193,721 | 20.5% | $50,994 | 39,635 |
| 31 | Milan | 8,194 | 18.9% | $45,608 | 1,547 |
| 32 | Crossville | 12,265 | 19.5% | $50,672 | 2,386 |
| 33 | Lexington | 7,943 | 18.9% | $49,253 | 1,500 |
| 34 | Lafayette | 5,643 | 17.6% | $44,924 | 993 |
| 35 | Henderson | 6,349 | 23.6% | $57,727 | 1,500 |
| 36 | Jefferson City | 8,472 | 21.1% | $53,819 | 1,786 |
| 37 | Shelbyville | 24,125 | 20.3% | $52,290 | 4,899 |
| 38 | Erwin | 6,001 | 15.9% | $45,422 | 954 |
| 39 | Johnson City | 71,455 | 21.1% | $55,429 | 15,062 |
| 40 | Madisonville | 5,184 | 14.6% | $45,274 | 757 |
| 41 | Fayetteville | 7,037 | 16.2% | $50,890 | 1,137 |
| 42 | Springfield | 18,985 | 20.8% | $58,741 | 3,941 |
| 43 | Dayton | 7,191 | 20.3% | $56,692 | 1,457 |
| 44 | Athens | 14,250 | 18.4% | $53,151 | 2,616 |
| 45 | Greeneville | 15,531 | 16.7% | $51,516 | 2,589 |
| 46 | Lenoir City | 10,681 | 20.1% | $60,480 | 2,150 |
| 47 | Millington | 11,117 | 14.9% | $51,695 | 1,657 |
| 48 | Cleveland | 48,185 | 17.4% | $55,904 | 8,379 |
| 49 | Manchester | 12,651 | 15.8% | $55,019 | 2,005 |
| 50 | Tullahoma | 20,672 | 18.5% | $60,855 | 3,830 |
| 51 | Sevierville | 18,105 | 15.3% | $55,106 | 2,768 |
| 52 | Chattanooga | 182,832 | 17.6% | $61,028 | 32,233 |
| 53 | Bristol | 27,490 | 14.1% | $55,007 | 3,867 |
| 54 | East Ridge | 22,034 | 14.8% | $55,988 | 3,269 |
| 55 | Alcoa | 11,635 | 15.4% | $60,049 | 1,795 |
| 56 | Winchester | 9,600 | 13.5% | $59,497 | 1,296 |
| 57 | Columbia | 43,971 | 14.3% | $61,204 | 6,287 |
| 58 | Clinton | 10,141 | 14.2% | $64,005 | 1,445 |
| 59 | Jonesborough | 6,056 | 13.2% | $63,155 | 800 |
| 60 | Red Bank | 11,960 | 12.9% | $61,788 | 1,542 |
| 61 | Clarksville | 171,897 | 12.8% | $66,786 | 21,985 |
| 62 | Lebanon | 41,951 | 14.0% | $71,320 | 5,856 |
| 63 | Dickson | 16,246 | 12.2% | $69,074 | 1,980 |
| 64 | Oak Ridge | 32,088 | 12.9% | $71,000 | 4,155 |
| 65 | Hartsville/Trousdale County | 11,805 | 10.3% | $63,190 | 1,220 |
| 66 | Millersville | 5,885 | 12.1% | $70,411 | 713 |
| 67 | Collegedale | 11,185 | 9.7% | $64,905 | 1,087 |
| 68 | Goodlettsville | 17,598 | 9.6% | $65,898 | 1,687 |
| 69 | Gallatin | 46,667 | 12.4% | $73,589 | 5,810 |
| 70 | Portland | 13,325 | 12.1% | $72,380 | 1,616 |
| 71 | Soddy-Daisy | 13,117 | 8.8% | $67,824 | 1,150 |
| 72 | Church Hill | 7,057 | 6.8% | $69,433 | 479 |
| 73 | Smyrna | 55,066 | 11.5% | $78,409 | 6,321 |
| 74 | Ashland City | 5,318 | 10.8% | $73,921 | 577 |
| 75 | Murfreesboro | 157,547 | 10.0% | $76,241 | 15,786 |
| 76 | La Vergne | 38,944 | 11.4% | $80,418 | 4,427 |
| 77 | Kingston | 6,042 | 6.6% | $70,532 | 396 |
| 78 | Fairview | 9,751 | 11.6% | $88,333 | 1,134 |
| 79 | Maryville | 32,196 | 8.1% | $79,340 | 2,591 |
| 80 | Mount Carmel | 5,504 | 5.9% | $71,336 | 323 |
| 81 | Munford | 6,459 | 6.6% | $86,492 | 426 |
| 82 | Atoka | 10,237 | 6.6% | $86,922 | 676 |
| 83 | White House | 13,875 | 6.1% | $87,315 | 840 |
| 84 | Greenbrier | 6,960 | 5.3% | $82,308 | 368 |
| 85 | Oakland | 9,544 | 6.2% | $89,240 | 592 |
| 86 | Hendersonville | 62,390 | 6.3% | $91,503 | 3,936 |
| 87 | Bartlett | 56,998 | 6.0% | $100,660 | 3,419 |
| 88 | Medina | 5,268 | 4.9% | $93,964 | 259 |
| 89 | Spring Hill | 53,585 | 4.2% | $106,658 | 2,261 |
| 90 | Pleasant View | 5,111 | 3.1% | $101,591 | 157 |
| 91 | Arlington | 14,989 | 5.4% | $125,909 | 815 |
| 92 | Franklin | 85,575 | 4.8% | $115,000 | 4,141 |
| 93 | Mount Juliet | 40,828 | 4.1% | $107,847 | 1,669 |
| 94 | Thompson’s Station | 7,855 | 3.0% | $122,139 | 232 |
| 95 | Lakeland | 14,068 | 2.4% | $113,843 | 330 |
| 96 | Farragut | 24,309 | 2.9% | $142,402 | 700 |
| 97 | Signal Mountain | 8,861 | 2.6% | $139,714 | 234 |
| 98 | Collierville | 51,212 | 2.6% | $134,319 | 1,331 |
| 99 | Germantown | 40,812 | 2.9% | $144,799 | 1,167 |
| 100 | Brentwood | 45,272 | 2.5% | $184,720 | 1,122 |
Is Livingston,Tennessee better off or worse today than 10 years ago ,now under a Black Mayor, Curtis Hayes,The mayor only has a High school education without any business experience? with Population,Economy, Housing?
I know the square is worse today than 10 years ago because of several business have closed on the square ,plus the pawn Shop had to close.
And with over 33 empty building in Church and Main street.
How Does DOVER , T.N. Fit In ???