
Do you live in one of the most miserable places in Pennsylvania?
Only a third of Pennsylvanians say they are truly happy. That’s too bad, considering that folks in Pennsylvania don’t really have it too bad in the grand scheme of things.
But, we were curious – which Pennsylvania cities might be the most miserable? We’re about to find out, using Saturday Night Science and data.
After analyzing the 189 largest cities, we sadly present the most miserable cities in the Keystone State.
Table Of Contents: Top Ten | Methodology | Summary | Table
The 10 Most Miserable Places In Pennsylvania
Read on below to see how we crunched the numbers and how your town ranked. If you have a smile on your face, you probably don’t live in one of these cities.
Oh, and by the way, Edinboro is the happiest place in Pennsylvania.
For more Pennsylvania reading, check out:
The 10 Most Miserable Places In Pennsylvania For 2023
/10
Population: 10,688
Poverty Level: 27.7%
Median Home Price $81,800
Married Households 10.0%
Households With Kids 36.91%
More on Darby: Data | Cost Of Living
/10
Population: 5,280
Poverty Level: 28.3%
Median Home Price $51,000
Married Households 18.0%
Households With Kids 32.27%
More on Duquesne: Data | Cost Of Living
/10
Population: 94,161
Poverty Level: 29.3%
Median Home Price $83,100
Married Households 9.0%
Households With Kids 37.34%
More on Reading: Data | Cost Of Living
/10
Population: 8,857
Poverty Level: 22.2%
Median Home Price $120,500
Married Households 16.0%
Households With Kids 30.76%
More on Collingdale: Data | Cost Of Living
/10
Population: 5,038
Poverty Level: 11.1%
Median Home Price $96,500
Married Households 15.0%
Households With Kids 45.68%
More on West York: Data
/10
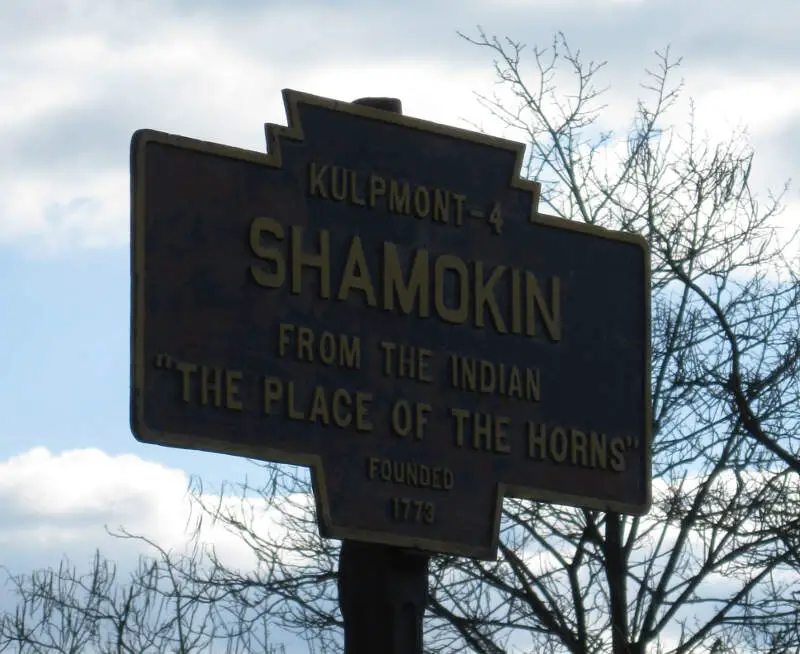
Population: 6,981
Poverty Level: 34.7%
Median Home Price $42,400
Married Households 24.0%
Households With Kids 28.26%
More on Shamokin: Data | Cost Of Living
/10
/10
Population: 13,306
Poverty Level: 26.8%
Median Home Price $126,000
Married Households 18.0%
Households With Kids 40.46%
More on Coatesville: Data | Cost Of Living
/10
Population: 6,738
Poverty Level: 15.7%
Median Home Price $117,800
Married Households 23.0%
Households With Kids 33.63%
More on Folcroft: Data | Cost Of Living
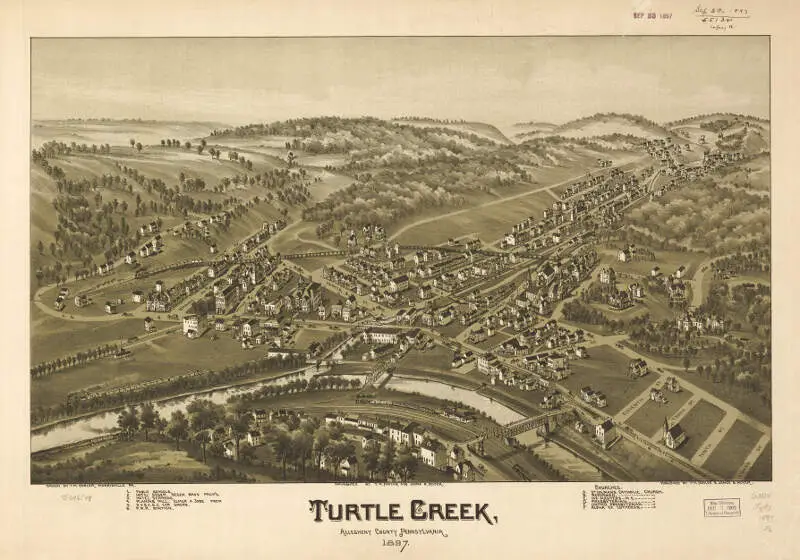
/10
Population: 5,136
Poverty Level: 27.4%
Median Home Price $56,700
Married Households 15.0%
Households With Kids 26.7%
More on Turtle Creek: Data | Cost Of Living
Methodology: How We Measured The Most Miserable Cities In The Keystone State
To rank the unhappiest places in Pennsylvania, we had to determine what criteria make people happy. It isn’t a stretch to assume that happy people earn great salaries, are relatively stress-free, and have a stable home life.
So we went to the Census’s American Community Survey 2017-2021 report for the happy criteria, flipped the list with Saturday Night Science, and it spit out the answer.
Like magic.
Here are the criteria we used to measure misery:
- Percentage of residents with a college degree
- Average commute times
- Unemployment rates
- Cost of living
- % of married couples
- % of families with kids
- Poverty rate
After we decided on the criteria, we gathered the data for the 189 places in Pennsylvania with over 5,000 people.
We then ranked each place from one to 189 for each of the seven criteria, with a score of one being the most miserable (Any ties were given to the larger place).
Next, we averaged the seven rankings into a Miserable Index for each place with the lowest overall Miserable Index “earning” the title “Most Miserable City In Pennsylvania.”
If you’d like to see the complete list of states, most miserable to happiest, scroll to the bottom of this post to see the unabridged chart.
We updated this article for 2023, and it’s our tenth time ranking the most miserable cities in Pennsylvania.
There You Have It – The Least Happy Cities In Pennsylvania
As we said earlier, trying to determine the most miserable cities in Pennsylvania is usually a subjective matter.
But if you’re analyzing cities where people are not stable, where you’re stuck in traffic, and no one spent the time to go to college, then this is an accurate list.
If you’re curious enough, here are the happiest cities in Pennsylvania, according to science:
- Edinboro
- State College
- Bellefonte
For more Pennsylvania reading, check out:
- Best Places To Live In Pennsylvania
- Cheapest Places To Live In Pennsylvania
- Most Dangerous Cities In Pennsylvania
- Richest Cities In Pennsylvania
- Safest Places In Pennsylvania
- Worst Places To Live In Pennsylvania
- Most Expensive Places To Live In Pennsylvania
Miserable Cities In Pennsylvania For 2023
| Rank | City | Population | Poverty Level | Median Home Value | % Married | % Kids |
|---|---|---|---|---|---|---|
| 1 | Darby, PA | 10,688 | 27.7% | $81,800 | 10.0% | 36.91% |
| 2 | Duquesne, PA | 5,280 | 28.3% | $51,000 | 18.0% | 32.27% |
| 3 | Reading, PA | 94,161 | 29.3% | $83,100 | 9.0% | 37.34% |
| 4 | Collingdale, PA | 8,857 | 22.2% | $120,500 | 16.0% | 30.76% |
| 5 | West York, PA | 5,038 | 11.1% | $96,500 | 15.0% | 45.68% |
| 6 | Shamokin, PA | 6,981 | 34.7% | $42,400 | 24.0% | 28.26% |
| 7 | Vandergrift, PA | 5,065 | 19.4% | $69,400 | 34.0% | 35.17% |
| 8 | Coatesville, PA | 13,306 | 26.8% | $126,000 | 18.0% | 40.46% |
| 9 | Folcroft, PA | 6,738 | 15.7% | $117,800 | 23.0% | 33.63% |
| 10 | Turtle Creek, PA | 5,136 | 27.4% | $56,700 | 15.0% | 26.7% |
| 11 | Chester, PA | 32,819 | 28.5% | $71,300 | 12.0% | 31.78% |
| 12 | Sharon Hill, PA | 5,952 | 21.3% | $121,600 | 27.0% | 40.09% |
| 13 | Clifton Heights, PA | 6,806 | 16.0% | $157,800 | 29.0% | 37.06% |
| 14 | York, PA | 44,692 | 28.7% | $80,000 | 12.0% | 31.39% |
| 15 | Mckeesport, PA | 17,935 | 27.4% | $52,400 | 20.0% | 24.03% |
| 16 | Allentown, PA | 125,250 | 23.3% | $145,700 | 11.0% | 35.22% |
| 17 | Clairton, PA | 6,245 | 19.5% | $48,100 | 28.0% | 25.24% |
| 18 | Hazleton, PA | 29,339 | 23.6% | $98,600 | 16.0% | 32.69% |
| 19 | New Brighton, PA | 5,743 | 20.6% | $81,300 | 25.0% | 26.94% |
| 20 | Lebanon, PA | 26,611 | 25.3% | $105,000 | 17.0% | 32.06% |
| 21 | Yeadon, PA | 11,945 | 8.8% | $142,300 | 14.0% | 21.1% |
| 22 | Wilson, PA | 8,215 | 4.6% | $156,600 | 28.0% | 33.06% |
| 23 | Oxford, PA | 5,671 | 18.4% | $227,600 | 13.0% | 36.55% |
| 24 | Beaver Falls, PA | 9,069 | 31.1% | $75,000 | 19.0% | 31.9% |
| 25 | Bangor, PA | 5,203 | 10.7% | $156,800 | 28.0% | 31.11% |
| 26 | New Castle, PA | 21,992 | 26.2% | $64,600 | 27.0% | 29.21% |
| 27 | Wilkes-Barre, PA | 44,086 | 20.4% | $83,100 | 19.0% | 30.17% |
| 28 | East Stroudsburg, PA | 9,820 | 15.7% | $158,800 | 10.0% | 25.6% |
| 29 | Norri, PA | 35,607 | 17.1% | $168,100 | 16.0% | 36.6% |
| 30 | Lehighton, PA | 5,267 | 23.2% | $131,000 | 31.0% | 26.53% |
| 31 | Pott, PA | 23,282 | 15.4% | $135,600 | 27.0% | 32.93% |
| 32 | West Hazleton, PA | 5,076 | 27.0% | $87,400 | 16.0% | 27.15% |
| 33 | Mckees Rocks, PA | 5,930 | 30.7% | $53,700 | 13.0% | 22.06% |
| 34 | Pittston, PA | 7,589 | 26.2% | $93,600 | 21.0% | 24.92% |
| 35 | Steelton, PA | 6,217 | 18.3% | $100,400 | 19.0% | 33.87% |
| 36 | Easton, PA | 27,860 | 17.6% | $132,300 | 13.0% | 29.37% |
| 37 | Tamaqua, PA | 6,940 | 20.1% | $65,300 | 35.0% | 30.25% |
| 38 | Waynesboro, PA | 10,871 | 14.5% | $154,000 | 23.0% | 32.76% |
| 39 | Oil City, PA | 9,685 | 16.5% | $57,300 | 34.0% | 31.3% |
| 40 | Red Lion, PA | 6,478 | 11.6% | $139,200 | 20.0% | 26.55% |
| 41 | Morrisville, PA | 9,675 | 6.7% | $215,400 | 21.0% | 33.72% |
| 42 | Lewi, PA | 8,513 | 25.8% | $74,300 | 27.0% | 29.5% |
| 43 | Swarthmore, PA | 6,560 | 5.7% | $443,000 | 14.0% | 42.21% |
| 44 | Pottsville, PA | 13,413 | 20.6% | $83,100 | 29.0% | 25.26% |
| 45 | Hanover, PA | 16,291 | 13.1% | $161,500 | 24.0% | 26.6% |
| 46 | Plymouth, PA | 5,765 | 14.2% | $74,600 | 24.0% | 25.87% |
| 47 | Sharon, PA | 13,203 | 23.1% | $63,800 | 22.0% | 26.12% |
| 48 | Bristol, PA | 9,847 | 8.7% | $186,000 | 31.0% | 32.78% |
| 49 | Uniontown, PA | 9,988 | 24.8% | $81,700 | 24.0% | 19.92% |
| 50 | Norwood, PA | 5,920 | 5.0% | $184,800 | 41.0% | 32.39% |
| 51 | Philadelphia, PA | 1,596,865 | 22.8% | $184,100 | 15.0% | 27.28% |
| 52 | Harrisburg, PA | 49,969 | 28.2% | $95,300 | 12.0% | 27.9% |
| 53 | West Mifflin, PA | 19,638 | 13.9% | $102,800 | 41.0% | 22.78% |
| 54 | Schuylkill Haven, PA | 5,263 | 6.0% | $108,700 | 36.0% | 27.56% |
| 55 | Lancaster, PA | 58,034 | 19.1% | $145,300 | 14.0% | 30.08% |
| 56 | Lansdowne, PA | 11,007 | 11.4% | $163,100 | 22.0% | 26.83% |
| 57 | Swissvale, PA | 8,645 | 12.8% | $116,100 | 20.0% | 16.7% |
| 58 | Meadville, PA | 12,999 | 19.6% | $112,800 | 22.0% | 31.49% |
| 59 | Ellwood City, PA | 7,555 | 11.4% | $104,400 | 40.0% | 25.08% |
| 60 | Catasauqua, PA | 6,498 | 8.6% | $170,100 | 31.0% | 31.65% |
| 61 | Johnstown, PA | 18,647 | 33.7% | $36,600 | 25.0% | 21.14% |
| 62 | Washington, PA | 13,322 | 19.6% | $99,800 | 21.0% | 20.7% |
| 63 | Bradford, PA | 7,913 | 28.4% | $64,300 | 22.0% | 25.39% |
| 64 | Corry, PA | 6,251 | 28.3% | $75,300 | 40.0% | 26.14% |
| 65 | Connellsville, PA | 7,092 | 16.8% | $104,300 | 35.0% | 27.48% |
| 66 | Nanticoke, PA | 10,588 | 17.4% | $84,600 | 34.0% | 28.18% |
| 67 | Greenville, PA | 5,578 | 13.4% | $76,000 | 26.0% | 36.17% |
| 68 | Palmerton, PA | 5,585 | 15.0% | $122,600 | 32.0% | 29.51% |
| 69 | Aliquippa, PA | 9,237 | 27.9% | $83,100 | 24.0% | 17.76% |
| 70 | Shillington, PA | 5,470 | 13.6% | $151,400 | 34.0% | 34.14% |
| 71 | Ambridge, PA | 6,959 | 12.2% | $80,300 | 28.0% | 22.44% |
| 72 | Stroudsburg, PA | 5,870 | 12.2% | $163,800 | 14.0% | 23.8% |
| 73 | Tyrone, PA | 5,473 | 13.9% | $106,100 | 37.0% | 24.11% |
| 74 | Sunbury, PA | 9,729 | 19.8% | $84,100 | 33.0% | 25.01% |
| 75 | Clearfield, PA | 5,991 | 20.2% | $89,700 | 32.0% | 29.5% |
| 76 | Butler, PA | 13,452 | 23.8% | $92,900 | 26.0% | 23.99% |
| 77 | Milton, PA | 6,641 | 12.7% | $146,900 | 40.0% | 28.12% |
| 78 | Wilkinsburg, PA | 14,492 | 23.4% | $98,600 | 14.0% | 15.38% |
| 79 | Glenolden, PA | 7,187 | 14.3% | $161,300 | 35.0% | 32.18% |
| 80 | Monessen, PA | 6,941 | 17.9% | $75,700 | 33.0% | 22.44% |
| 81 | Erie, PA | 95,536 | 24.7% | $91,300 | 22.0% | 27.16% |
| 82 | Quake, PA | 9,285 | 11.6% | $214,400 | 29.0% | 32.0% |
| 83 | Jeannette, PA | 8,835 | 20.7% | $90,600 | 32.0% | 19.41% |
| 84 | Titusville, PA | 5,314 | 22.7% | $66,400 | 28.0% | 23.34% |
| 85 | Coraopolis, PA | 5,539 | 12.1% | $98,300 | 26.0% | 25.76% |
| 86 | Dickson City, PA | 6,047 | 12.2% | $162,700 | 33.0% | 26.24% |
| 87 | Carbondale, PA | 8,828 | 26.7% | $97,900 | 28.0% | 27.31% |
| 88 | Ambler, PA | 6,747 | 8.3% | $314,800 | 29.0% | 32.77% |
| 89 | Northampton, PA | 10,328 | 10.7% | $177,500 | 33.0% | 27.42% |
| 90 | Scranton, PA | 75,987 | 20.1% | $112,600 | 24.0% | 27.38% |
| 91 | Brookhaven, PA | 8,243 | 4.8% | $222,200 | 34.0% | 32.96% |
| 92 | Forest Hills, PA | 6,408 | 3.2% | $144,000 | 35.0% | 18.41% |
| 93 | Lock Haven, PA | 8,458 | 26.9% | $132,100 | 23.0% | 27.5% |
| 94 | Canonsburg, PA | 9,643 | 5.3% | $156,300 | 35.0% | 27.12% |
| 95 | Olyphant, PA | 5,359 | 9.7% | $135,400 | 30.0% | 30.7% |
| 96 | Sayre, PA | 5,484 | 12.8% | $132,800 | 17.0% | 23.98% |
| 97 | Baldwin, PA | 21,274 | 7.4% | $156,700 | 37.0% | 28.86% |
| 98 | Hatboro, PA | 8,150 | 5.9% | $275,000 | 35.0% | 34.23% |
| 99 | Monaca, PA | 5,622 | 13.3% | $123,900 | 36.0% | 28.26% |
| 100 | Munhall, PA | 10,827 | 12.3% | $96,400 | 34.0% | 16.81% |
Holy cow !! Guess we should pack up the buggy and move to Fairless Hills or Harrisburg ?!