
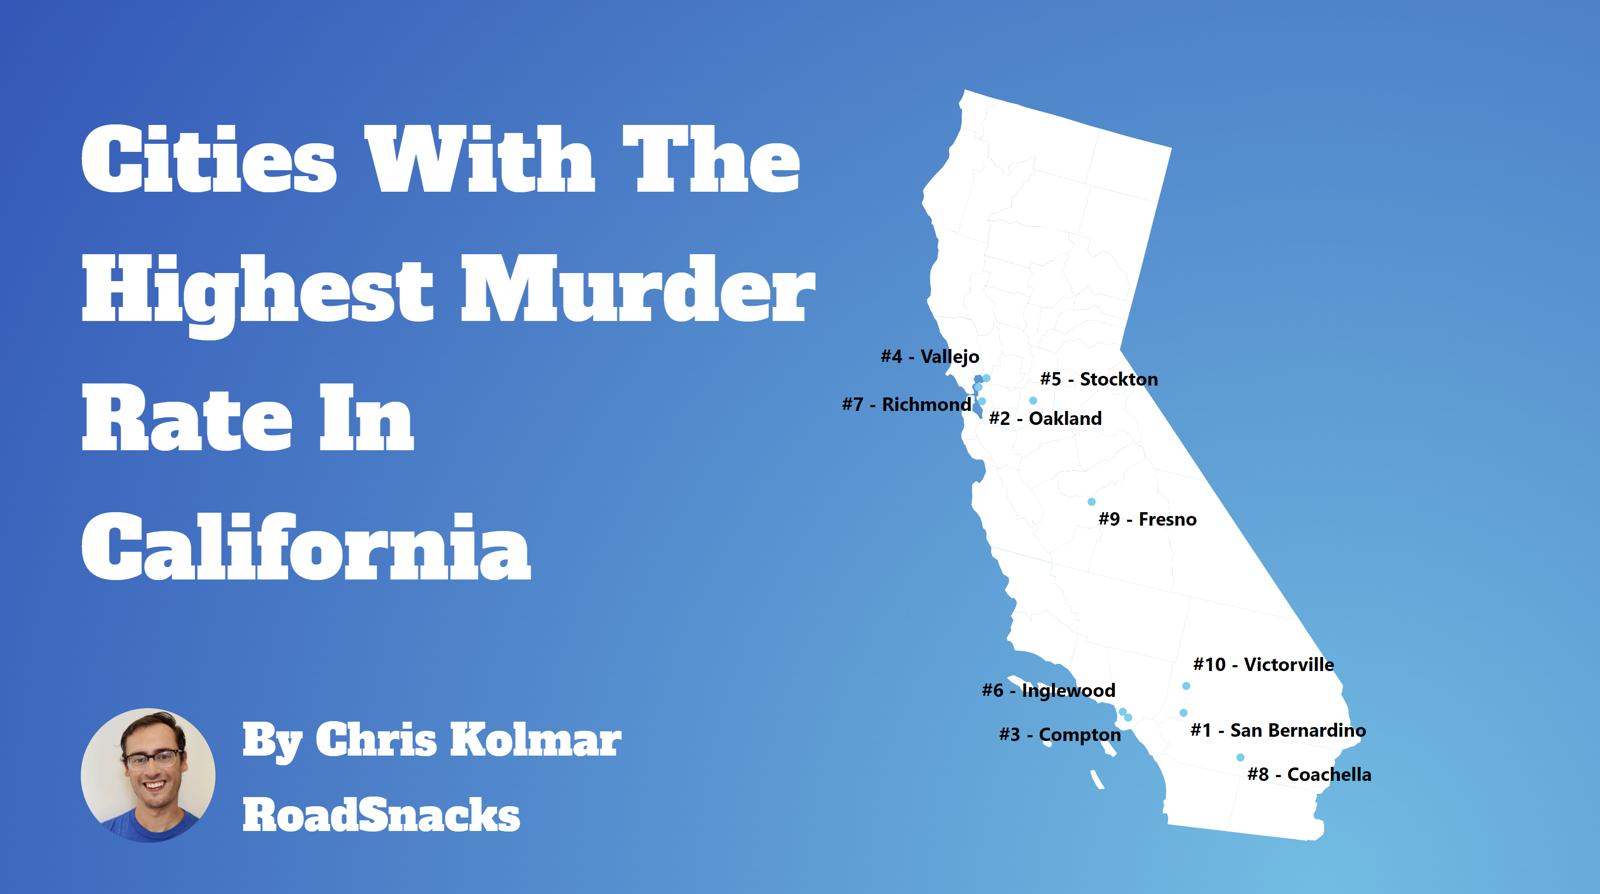
Do you live in one of the murder capitals of California?
We all watch the news with horror when we hear about a homicide that happens not that far away from us. While a murder just blocks or even a couple of towns away from your house would make anyone uneasy, in the long run, most likely, where you live is relatively safe.
To find the cities in California with the most murders and the highest murder rates per capita, we used Saturday Night Science to compare the FBI crime data on murders for the 225 cities in the Golden State with over 5,000 residents.
Table Of Contents: Top Ten | Methodology | Summary | Table
Cities With Highest Murder Rates In California
What city has the highest murder rate in California? The city with the highest murder rate in California is Farmersville with 58.4 murders per 100,000 people.
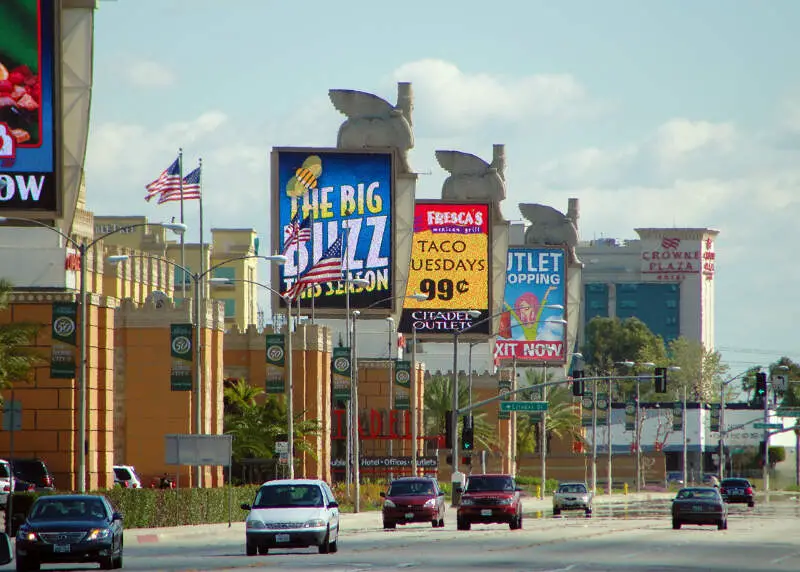
What is the city in California with highest number of murders? The city in California with the highest number of murders is Los Angeles with 324 murders.
Read on below to see how we crunched the numbers and how your town in California ranked. There were ‘only’ 225 cities in California where a city reported a murder to the FBI, meaning 169 places had no murder.
For more reading on the Golden State check out:
- Best Places To Live In California
- Cheapest Places To Live In California
- Most Dangerous Cities In California
The 10 Murder Capitals Of California For 2025

/10
Population: 10,282
Murders: 6 (42nd Most)
Murders Per 100k: 58.4 (Most)
More on Farmersville: Data

/10
Population: 18,094
Murders: 9 (24th Most)
Murders Per 100k: 49.7 (2nd Most)
More on Santa Fe Springs: Data

/10
Population: 12,630
Murders: 5 (55th Most)
Murders Per 100k: 39.6 (3rd Most)
More on Marysville: Data

/10
Population: 11,591
Murders: 4 (70th Most)
Murders Per 100k: 34.5 (4th Most)
More on Commerce: Data

/10
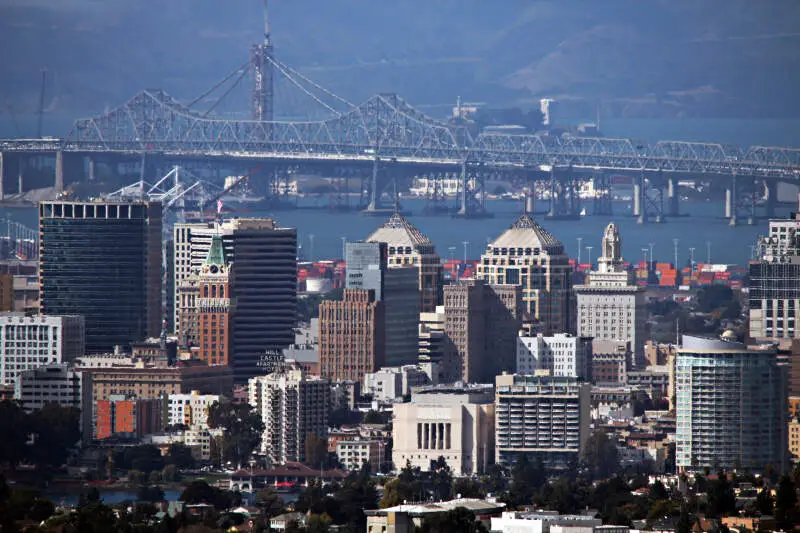
Population: 425,484
Murders: 118 (2nd Most)
Murders Per 100k: 27.7 (5th Most)
More on Oakland: Data

/10
Population: 90,323
Murders: 21 (12th Most)
Murders Per 100k: 23.2 (6th Most)
More on Compton: Data

/10
Population: 21,594
Murders: 5 (55th Most)
Murders Per 100k: 23.2 (7th Most)
More on Cudahy: Data

/10
Population: 57,419
Murders: 12 (17th Most)
Murders Per 100k: 20.9 (8th Most)
More on Monterey Park: Data

/10
Population: 167,293
Murders: 33 (9th Most)
Murders Per 100k: 19.7 (9th Most)
More on Lancaster: Data

/10
Population: 25,601
Murders: 5 (55th Most)
Murders Per 100k: 19.5 (10th Most)
More on Dinuba: Data
Methodology: How we calculated the murder capitals of California
While there are surveys and public polls on what cities in a state are the most dangerous, we wanted to rely on something other than speculation and opinion. Instead, we used Saturday Night Science to compare the hard numbers from the FBI’s last year of reporting. Specifically, we analyzed the FBI’s Uniform Crime Report, which summarizes the number of murders in each city annually.
We only looked at every single city in California for which FBI data was available for the most recent FBI Crime In The United States. That left us with 225 cities to rank.
We took the number of murders per capita as the ranking factor. The place with the most murders per capita based on the most recent data is Farmersville. It is our tenth time ranking the places with the most murders per capita in California. We updated the list for 2025.
Summary: The Places With The Most Murders In California For 2025
If you’re looking at the places in California with the most murders, and where residents have the highest chances of being killed themselves, this is an accurate list. Again, these statistics are an indication of where crimes occur, not a statement about the effectiveness of the law enforcement in the areas they serve.
The cities with the highest murder per capita in California are Farmersville, Santa Fe Springs, Marysville, Commerce, Oakland, Compton, Cudahy, Monterey Park, Lancaster, and Dinuba.
For more California reading, check out:
- Best Places To Raise A Family In California
- Fastest Growing Cities In California
- Safest Places In California
- Best Cities For Singles In California
- Worst Places To Live In California
Murder Rates By City In California
| Rank | City | Population | Murders | Murders/100K |
|---|---|---|---|---|
| 1 | Farmersville, CA | 10282 | 6 | 58.35 |
| 2 | Santa Fe Springs, CA | 18094 | 9 | 49.74 |
| 3 | Marysville, CA | 12630 | 5 | 39.59 |
| 4 | Commerce, CA | 11591 | 4 | 34.51 |
| 5 | Oakland, CA | 425484 | 118 | 27.73 |
| 6 | Compton, CA | 90323 | 21 | 23.25 |
| 7 | Cudahy, CA | 21594 | 5 | 23.15 |
| 8 | Monterey Park, CA | 57419 | 12 | 20.9 |
| 9 | Lancaster, CA | 167293 | 33 | 19.73 |
| 10 | Dinuba, CA | 25601 | 5 | 19.53 |
| 11 | Ione, CA | 5463 | 1 | 18.3 |
| 12 | Blythe, CA | 17039 | 3 | 17.61 |
| 13 | San Bernardino, CA | 219483 | 36 | 16.4 |
| 14 | Vallejo, CA | 122419 | 20 | 16.34 |
| 15 | Avenal, CA | 13329 | 2 | 15.0 |
| 16 | Stockton, CA | 322220 | 48 | 14.9 |
| 17 | Inglewood, CA | 101790 | 15 | 14.74 |
| 18 | Taft, CA | 6830 | 1 | 14.64 |
| 19 | Cotati, CA | 7390 | 1 | 13.53 |
| 20 | Montclair, CA | 37620 | 5 | 13.29 |
| 21 | Artesia, CA | 15498 | 2 | 12.9 |
| 22 | Pismo Beach, CA | 8037 | 1 | 12.44 |
| 23 | Gonzales, CA | 8344 | 1 | 11.98 |
| 24 | Delano, CA | 51347 | 6 | 11.69 |
| 25 | Arcata, CA | 18464 | 2 | 10.83 |
| 26 | Chowchilla, CA | 18700 | 2 | 10.7 |
| 27 | Waterford, CA | 9436 | 1 | 10.6 |
| 28 | Pomona, CA | 143578 | 15 | 10.45 |
| 29 | Azusa, CA | 48173 | 5 | 10.38 |
| 30 | Oroville, CA | 20083 | 2 | 9.96 |
| 31 | Exeter, CA | 10237 | 1 | 9.77 |
| 32 | Malibu, CA | 10249 | 1 | 9.76 |
| 33 | Visalia, CA | 145031 | 14 | 9.65 |
| 34 | Banning, CA | 31279 | 3 | 9.59 |
| 35 | Antioch, CA | 115271 | 11 | 9.54 |
| 36 | Bell, CA | 31982 | 3 | 9.38 |
| 37 | Lompoc, CA | 43413 | 4 | 9.21 |
| 38 | Atwater, CA | 32583 | 3 | 9.21 |
| 39 | Duarte, CA | 21885 | 2 | 9.14 |
| 40 | Tracy, CA | 99347 | 9 | 9.06 |
| 41 | Desert Hot Springs, CA | 33392 | 3 | 8.98 |
| 42 | South Gate, CA | 90184 | 8 | 8.87 |
| 43 | Los Angeles, CA | 3786018 | 324 | 8.56 |
| 44 | Hanford, CA | 58657 | 5 | 8.52 |
| 45 | Pico Rivera, CA | 58754 | 5 | 8.51 |
| 46 | Merced, CA | 94125 | 8 | 8.5 |
| 47 | Hawthorne, CA | 82988 | 7 | 8.43 |
| 48 | Rosemead, CA | 49158 | 4 | 8.14 |
| 49 | Norco, CA | 24874 | 2 | 8.04 |
| 50 | Fortuna, CA | 12515 | 1 | 7.99 |
| 51 | Susanville, CA | 12526 | 1 | 7.98 |
| 52 | Barstow, CA | 25138 | 2 | 7.96 |
| 53 | Mendota, CA | 12604 | 1 | 7.93 |
| 54 | Emeryville, CA | 12900 | 1 | 7.75 |
| 55 | Sacramento, CA | 529172 | 41 | 7.75 |
| 56 | Hemet, CA | 91115 | 7 | 7.68 |
| 57 | Stanton, CA | 39471 | 3 | 7.6 |
| 58 | Lemon Grove, CA | 27031 | 2 | 7.4 |
| 59 | Lemoore, CA | 27232 | 2 | 7.34 |
| 60 | Baldwin Park, CA | 68230 | 5 | 7.33 |
| 61 | Norwalk, CA | 96656 | 7 | 7.24 |
| 62 | San Leandro, CA | 84855 | 6 | 7.07 |
| 63 | Richmond, CA | 113282 | 8 | 7.06 |
| 64 | Bakersfield, CA | 413409 | 29 | 7.01 |
| 65 | Gilroy, CA | 57331 | 4 | 6.98 |
| 66 | Gardena, CA | 57853 | 4 | 6.91 |
| 67 | Salinas, CA | 159896 | 11 | 6.88 |
| 68 | Fresno, CA | 547134 | 37 | 6.76 |
| 69 | San Francisco, CA | 782846 | 52 | 6.64 |
| 70 | California City, CA | 15165 | 1 | 6.59 |
| 71 | Hayward, CA | 153914 | 10 | 6.5 |
| 72 | Seaside, CA | 31064 | 2 | 6.44 |
| 73 | Indio, CA | 93364 | 6 | 6.43 |
| 74 | Pittsburg, CA | 78061 | 5 | 6.41 |
| 75 | Los Gatos, CA | 31903 | 2 | 6.27 |
| 76 | Rancho Cordova, CA | 81151 | 5 | 6.16 |
| 77 | Kerman, CA | 16293 | 1 | 6.14 |
| 78 | Long Beach, CA | 444415 | 27 | 6.08 |
| 79 | Whittier, CA | 83269 | 5 | 6.0 |
| 80 | Clearlake, CA | 16689 | 1 | 5.99 |
| 81 | Laguna Woods, CA | 16983 | 1 | 5.89 |
| 82 | Fairfield, CA | 119071 | 7 | 5.88 |
| 83 | San Juan Capistrano, CA | 34236 | 2 | 5.84 |
| 84 | Citrus Heights, CA | 85894 | 5 | 5.82 |
| 85 | Madera, CA | 68862 | 4 | 5.81 |
| 86 | Santa Rosa, CA | 176855 | 10 | 5.65 |
| 87 | Palmdale, CA | 160829 | 9 | 5.6 |
| 88 | Rancho Mirage, CA | 17935 | 1 | 5.58 |
| 89 | Colton, CA | 53893 | 3 | 5.57 |
| 90 | Turlock, CA | 72118 | 4 | 5.55 |
| 91 | Ventura, CA | 109035 | 6 | 5.5 |
| 92 | Carson, CA | 90974 | 5 | 5.5 |
| 93 | Santa Maria, CA | 110317 | 6 | 5.44 |
| 94 | Coronado, CA | 19002 | 1 | 5.26 |
| 95 | Albany, CA | 19022 | 1 | 5.26 |
| 96 | Culver City, CA | 38948 | 2 | 5.14 |
| 97 | Vista, CA | 97457 | 5 | 5.13 |
| 98 | Greenfield, CA | 19552 | 1 | 5.11 |
| 99 | South El Monte, CA | 19597 | 1 | 5.1 |
| 100 | Alhambra, CA | 79087 | 4 | 5.06 |