
Whitest cities in North Carolina research summary. We analyzed North Carolina’s most recent Census data to determine the whitest cities in North Carolina based on the percentage of White residents. Here are the results of our analysis:
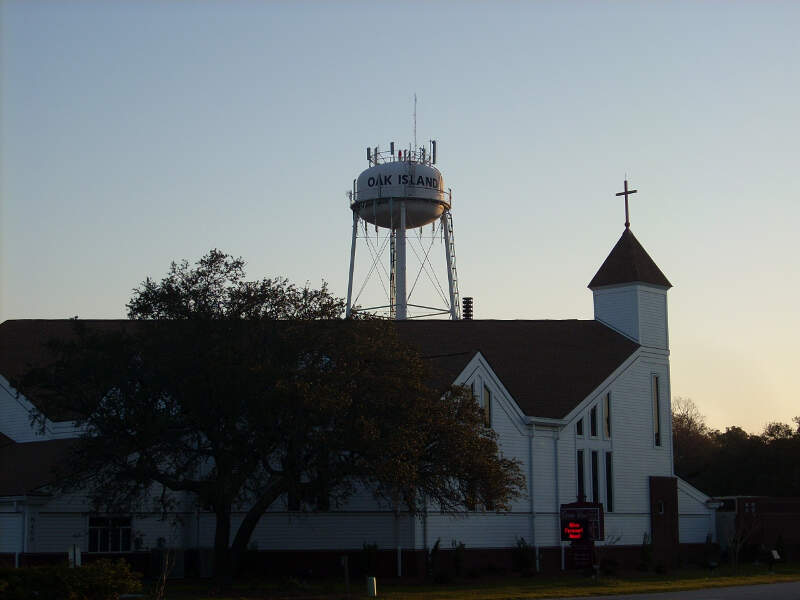
The whitest city in North Carolina is Oak Island based on the most recent Census data.
Oak Island is 94.13% White.
The least White city in North Carolina is Siler City.
Siler City is 20.78% White.
North Carolina is 60.0% White.
North Carolina is the 33rd Whitest state in the United States.
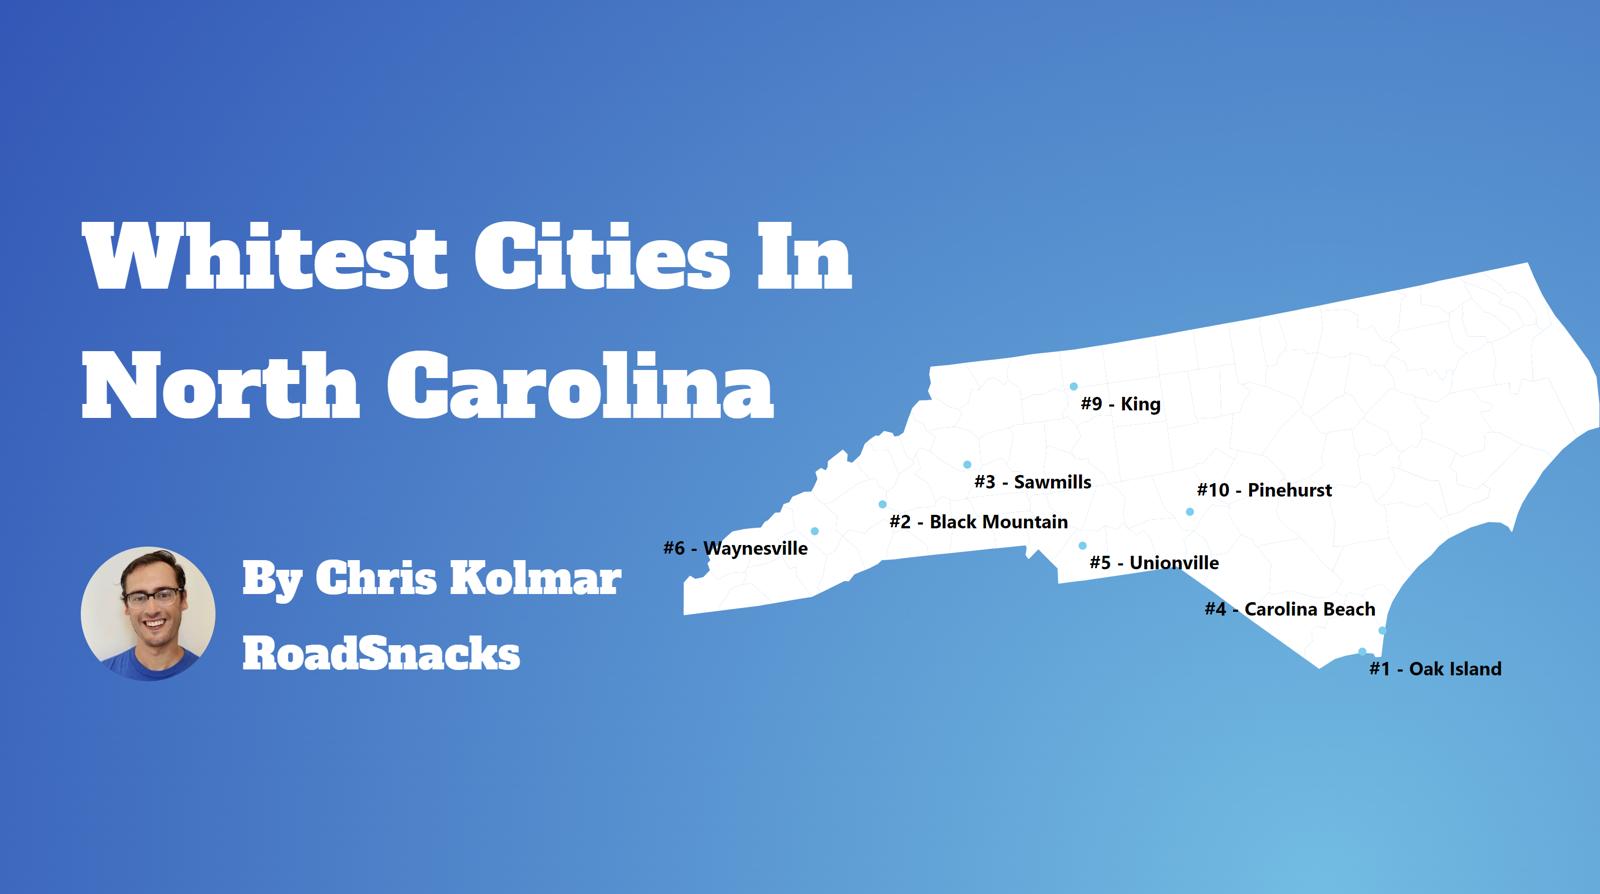
Table Of Contents: Top Ten | Methodology | Summary | Table
Today, we are looking at the whitest places in North Carolina. We won’t measure the number of Whole Foods or Pottery Barns per capita. Instead, we’ll focus on the Census data’s report of race by place in North Carolina. In particular, we ranked each place in North Carolina by the percentage of white people.
So where are the whitest cities you can live in North Carolina?
After analyzing cities with populations greater than 5,000, we came up with this list as the whitest cities in North Carolina for 2026.Here are the 10 whites places in North Carolina for 2026:
What is the whitest city in North Carolina for 2026? According to the most recent census data Oak Island ranks as the whitest. If you’re wondering, Siler City is the least white city of all those we measured.
Read on below to see where your hometown ranked and why. Or check out the whitest states in America and the most diverse states in America.
For more North Carolina reading, check out:
- Best Places To Raise A Family In North Carolina
- Most Dangerous Cities In North Carolina
- Safest Cities in North Carolina
The 10 Whitest Cities In North Carolina For 2026

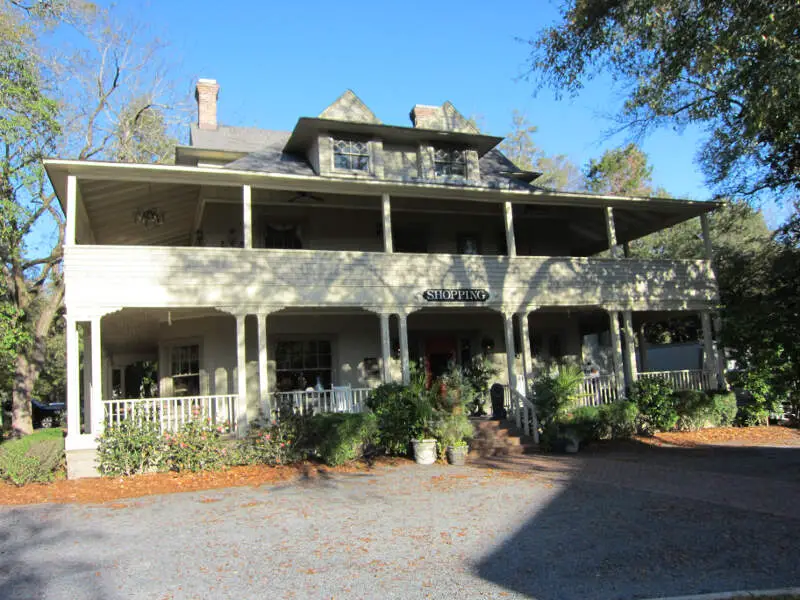
/10
Population: 9,030
% White: 94.13%
More on Oak Island: Data | Crime | Cost Of Living | Movers
/10
Population: 5,042
% White: 93.81%
More on Sawmills: Data | Cost Of Living | Movers

/10
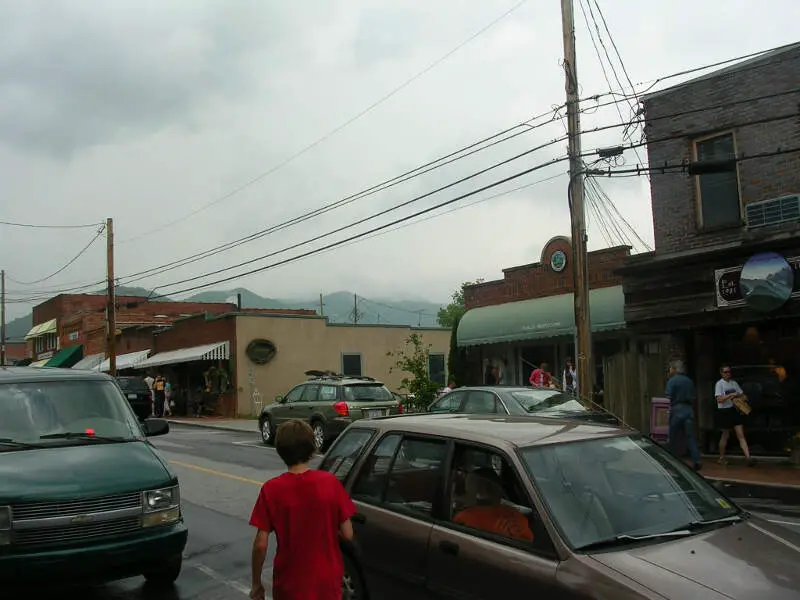
Population: 8,513
% White: 89.19%
More on Black Mountain: Data | Crime | Cost Of Living | Movers

/10
Population: 6,954
% White: 89.04%
More on Unionville: Data | Cost Of Living | Movers

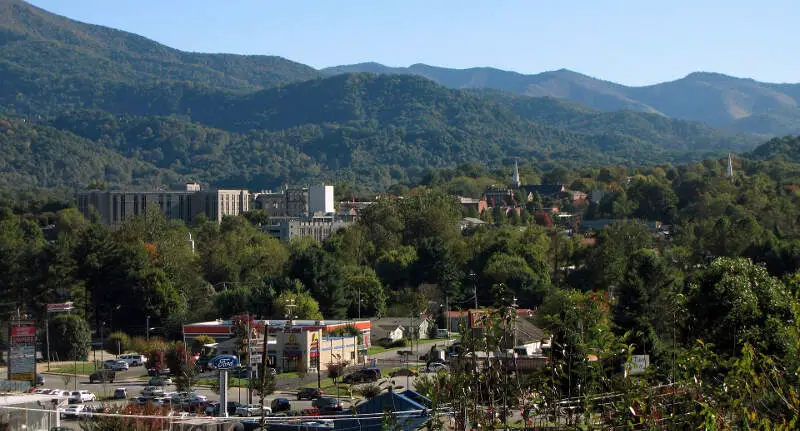
/10
Population: 10,502
% White: 87.71%
More on Waynesville: Data | Crime | Cost Of Living | Movers

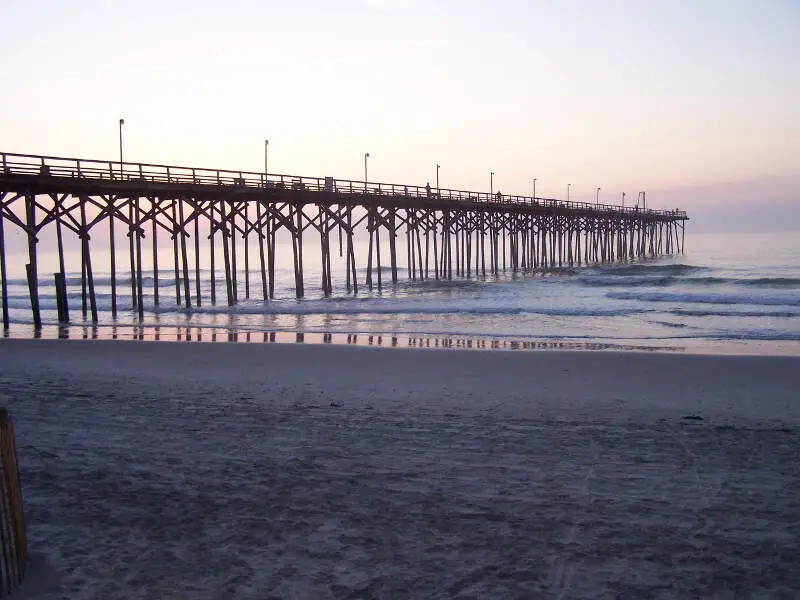
/10
Population: 6,745
% White: 87.5%
More on Carolina Beach: Data | Crime | Cost Of Living | Movers

/10
Population: 6,226
% White: 85.64%
More on Cherryville: Data | Crime | Cost Of Living | Movers

/10
Population: 18,256
% White: 85.57%
More on Pinehurst: Data | Crime | Cost Of Living | Movers

/10
Population: 20,032
% White: 83.74%
More on Boone: Data | Crime | Cost Of Living | Movers

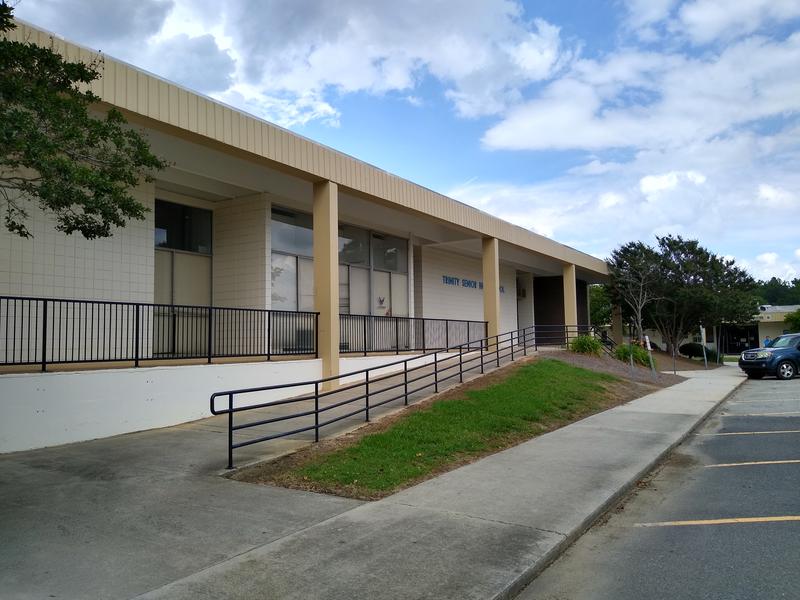
/10
Population: 7,111
% White: 83.52%
More on Trinity: Data | Cost Of Living | Movers
To rank the whitest places in North Carolina, we used Saturday Night Science to look at Census demographic data. We had to look at the number of white people living in each city in North Carolina on a per capita basis. In other words, the percentage of white people living in each city in North Carolina. We looked at table B03002: Hispanic OR LATINO ORIGIN BY RACE. Here are the category names as defined by the Census: Our particular column of interest here was the number of people who identified as White alone. We limited our analysis to town with a population greater than 5,000 people. That left us with 124 cities. We then calculated the percentage of residents that are White. The percentages ranked from 94.1% to 20.8%. Finally, we ranked each city based on the percentage of White population, with a higher score being more White than a lower score. Oak Island took the distinction of being the most White, while Siler City was the least White city. We updated this article for 2026. This report represents our eleventh time ranking the whitest cities in North Carolina. Read on for more information on how the cities in North Carolina ranked by population of White residents or, for a more general take on diversity in America, head over to our ranking of the most diverse cities in America. We measured the locations with the highest percentage of white people in North Carolina. According to the most recent data, this list provides accurate information on the whitest places in North Carolina. The most White cities in North Carolina are Oak Island, Sawmills, Black Mountain, Unionville, Waynesville, Carolina Beach, Cherryville, Pinehurst, Boone, and Trinity. If you’re curious enough, here are the least White places in North Carolina: For more North Carolina reading, check out:Methodology: How we determined the whitest places in North Carolina for 2026
Summary: White Populations Across North Carolina
White Population By City In North Carolina
Rank City Population White Population % White 1 Oak Island 9,030 8,500 94.13% 2 Sawmills 5,042 4,730 93.81% 3 Black Mountain 8,513 7,593 89.19% 4 Unionville 6,954 6,192 89.04% 5 Waynesville 10,502 9,211 87.71% 6 Carolina Beach 6,745 5,902 87.5% 7 Cherryville 6,226 5,332 85.64% 8 Pinehurst 18,256 15,621 85.57% 9 Boone 20,032 16,774 83.74% 10 Trinity 7,111 5,939 83.52% 11 Leland 29,607 24,589 83.05% 12 Cornelius 32,783 26,887 82.02% 13 King 7,408 6,066 81.88% 14 Kill Devil Hills 7,761 6,274 80.84% 15 Brevard 7,897 6,376 80.74% 16 Fletcher 8,098 6,528 80.61% 17 Belmont 15,546 12,519 80.53% 18 Davidson 15,660 12,560 80.2% 19 Mills River 7,281 5,814 79.85% 20 Asheville 94,535 75,465 79.83% 21 Elon 11,032 8,713 78.98% 22 Lewisville 13,828 10,794 78.06% 23 Hendersonville 15,408 11,964 77.65% 24 Oak Ridge 7,744 5,993 77.39% 25 Morehead City 9,806 7,585 77.35% 26 Archdale 12,087 9,292 76.88% 27 Mount Airy 10,633 8,161 76.75% 28 Woodfin 8,048 6,131 76.18% 29 Weddington 13,805 10,427 75.53% 30 Stallings 16,886 12,723 75.35% 31 Bessemer City 5,580 4,179 74.89% 32 Summerfield 11,116 8,290 74.58% 33 Hillsborough 9,724 7,188 73.92% 34 Wesley Chapel 9,090 6,698 73.69% 35 Southern Pines 16,420 12,058 73.43% 36 Lenoir 18,299 13,394 73.2% 37 Clemmons 21,871 15,494 70.84% 38 Holly Springs 45,248 31,917 70.54% 39 Matthews 30,577 21,417 70.04% 40 Wilmington 120,805 84,455 69.91% 41 Mooresville 52,381 36,316 69.33% 42 Conover 8,580 5,827 67.91% 43 Waxhaw 22,275 15,025 67.45% 44 Huntersville 63,969 43,073 67.33% 45 Fuquay-Varina 40,485 26,531 65.53% 46 Kings Mountain 12,039 7,888 65.52% 47 Mount Holly 18,208 11,907 65.39% 48 Indian Trail 42,036 27,181 64.66% 49 Wake Forest 52,844 34,160 64.64% 50 Aberdeen 9,228 5,928 64.24% 51 Mint Hill 27,556 17,676 64.15% 52 Newton 13,333 8,551 64.13% 53 Kernersville 27,830 17,825 64.05% 54 Gibsonville 9,467 6,011 63.49% 55 Chapel Hill 61,607 38,670 62.77% 56 Hickory 44,258 27,704 62.6% 57 Albemarle 16,762 10,404 62.07% 58 Apex 70,630 43,592 61.72% 59 Carrboro 21,204 12,968 61.16% 60 Marion 7,579 4,634 61.14% 61 Lincolnton 11,783 7,091 60.18% 62 Eden 15,356 9,211 59.98% 63 Smithfield 12,116 7,206 59.48% 64 Morganton 17,646 10,301 58.38% 65 Cary 179,306 101,742 56.74% 66 Havelock 17,691 9,928 56.12% 67 Thomasville 27,321 15,299 56.0% 68 Winterville 10,725 5,980 55.76% 69 Forest City 7,363 4,095 55.62% 70 Hamlet 5,961 3,311 55.54% 71 Kannapolis 57,890 32,113 55.47% 72 Mebane 19,538 10,758 55.06% 73 Jacksonville 71,279 39,138 54.91% 74 Clayton 29,320 15,886 54.18% 75 Graham 18,048 9,730 53.91% 76 Shelby 22,100 11,872 53.72% 77 Asheboro 27,580 14,490 52.54% 78 Reidsville 14,585 7,604 52.14% 79 Rockingham 8,967 4,673 52.11% 80 Garner 34,473 17,919 51.98% 81 Statesville 29,894 15,525 51.93% 82 Raleigh 481,031 246,042 51.15% 83 Gastonia 82,884 42,263 50.99% 84 Harrisburg 19,633 9,963 50.75% 85 New Bern 32,734 16,588 50.68% 86 Dunn 8,559 4,300 50.24% 87 Roanoke Rapids 14,856 7,446 50.12% 88 Concord 108,719 53,709 49.4% 89 Salisbury 35,825 17,589 49.1% 90 Greenville 92,857 45,071 48.54% 91 Wendell 13,064 6,213 47.56% 92 Washington 9,726 4,507 46.34% 93 Roxboro 8,182 3,662 44.76% 94 Burlington 59,610 26,399 44.29% 95 Butner 8,065 3,549 44.0% 96 Monroe 36,759 16,059 43.69% 97 Winston-Salem 252,037 109,867 43.59% 98 Lexington 19,690 8,417 42.75% 99 Pineville 11,055 4,660 42.15% 100 Elizabeth City 18,871 7,939 42.07%