
Whitest cities in Wisconsin research summary. We analyzed Wisconsin’s most recent Census data to determine the whitest cities in Wisconsin based on the percentage of White residents. Here are the results of our analysis:
The whitest city in Wisconsin is Mayville based on the most recent Census data.
Mayville is 97.39% White.
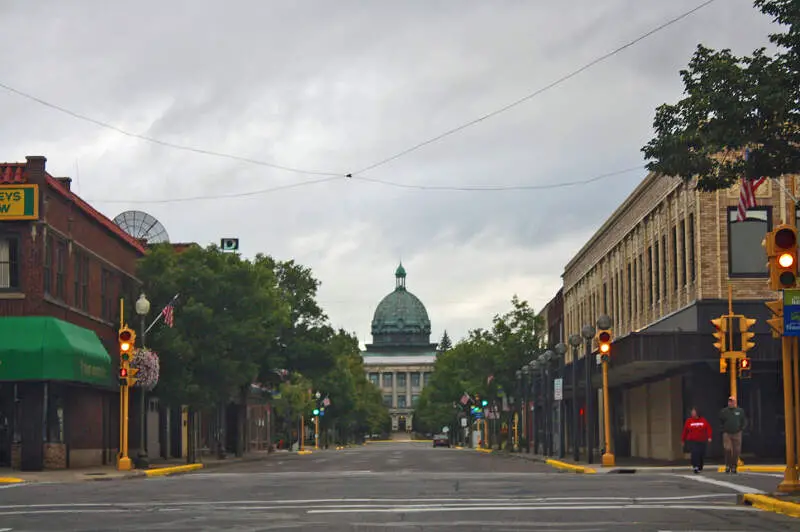
The least White city in Wisconsin is Milwaukee.
Milwaukee is 32.29% White.
Wisconsin is 79.2% White.
Wisconsin is the 12th Whitest state in the United States.
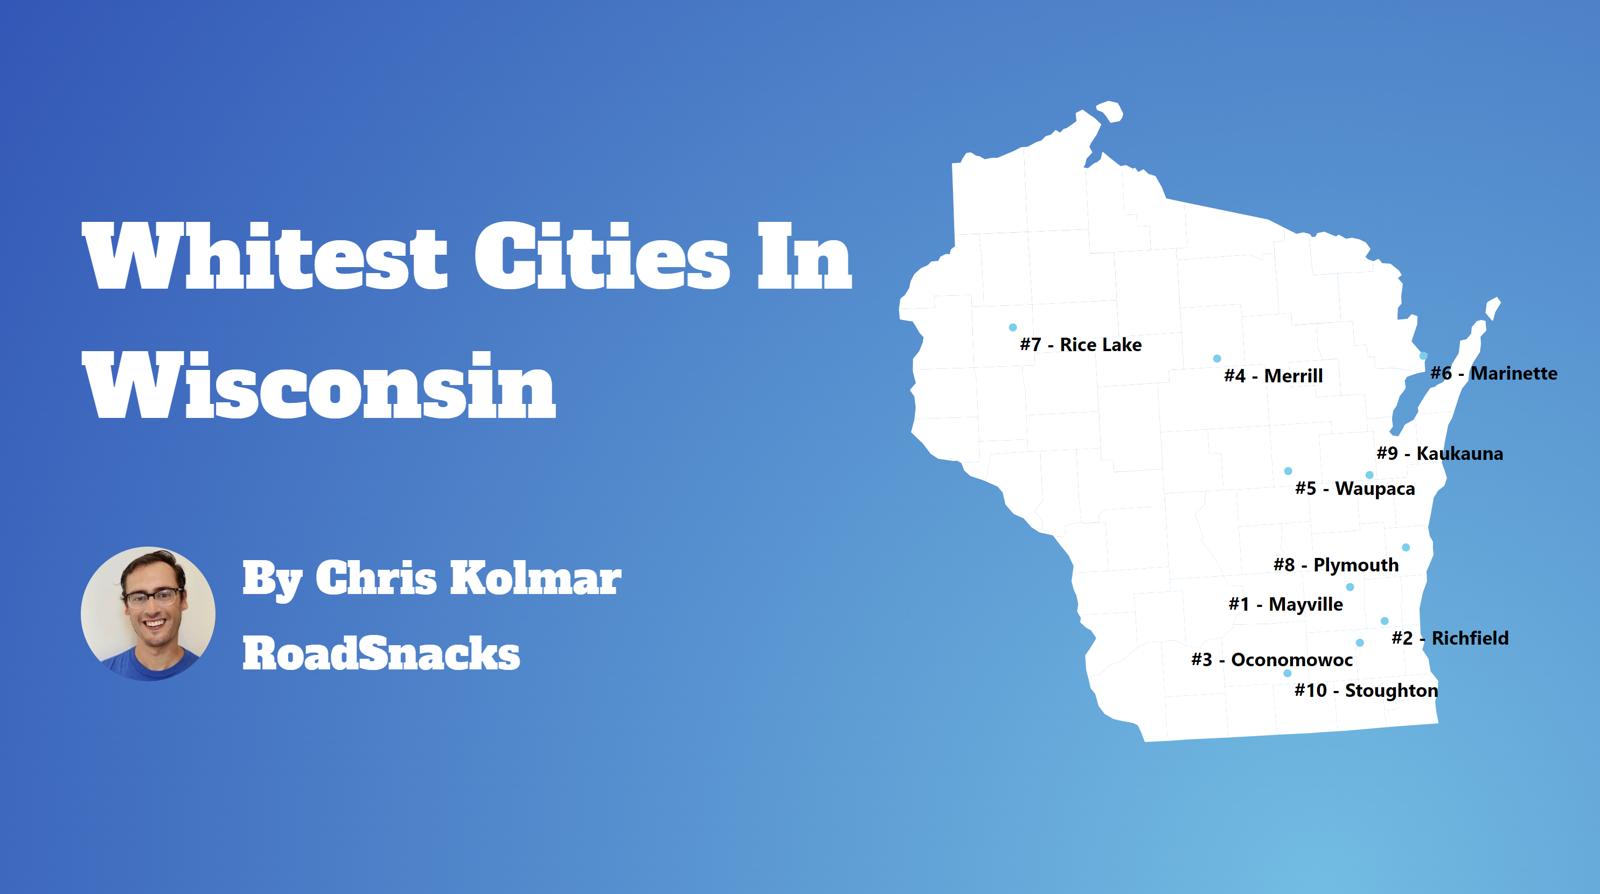
Table Of Contents: Top Ten | Methodology | Summary | Table
Today, we are looking at the whitest places in Wisconsin. We won’t measure the number of Whole Foods or Pottery Barns per capita. Instead, we’ll focus on the Census data’s report of race by place in Wisconsin. In particular, we ranked each place in Wisconsin by the percentage of white people.
So where are the whitest cities you can live in Wisconsin?
After analyzing cities with populations greater than 5,000, we came up with this list as the whitest cities in Wisconsin for 2025.Here are the 10 whites places in Wisconsin for 2025:
What is the whitest city in Wisconsin for 2025? According to the most recent census data Mayville ranks as the whitest. If you’re wondering, Milwaukee is the least white city of all those we measured.
Read on below to see where your hometown ranked and why. Or check out the whitest states in America and the most diverse states in America.
For more Wisconsin reading, check out:
- Worst Places To Live In Wisconsin
- Most Dangerous Cities In Wisconsin
- Best Places To Raise A Family In Wisconsin
The 10 Whitest Cities In Wisconsin For 2025
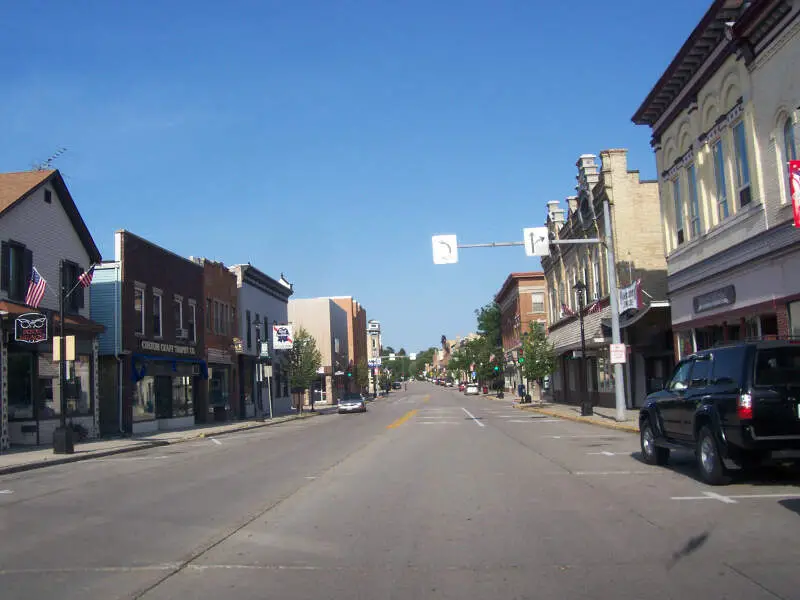
/10
Population: 5,169
% White: 97.39%
More on Mayville: Data

/10
Population: 11,806
% White: 95.87%
More on Richfield: Data

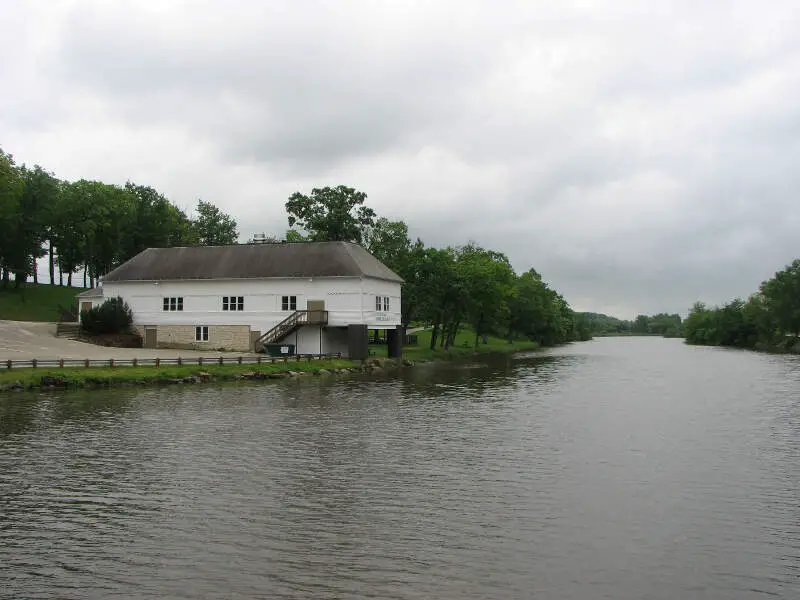
/10
Population: 18,385
% White: 95.46%
More on Oconomowoc: Data


/10
Population: 11,060
% White: 95.0%
More on Marinette: Data

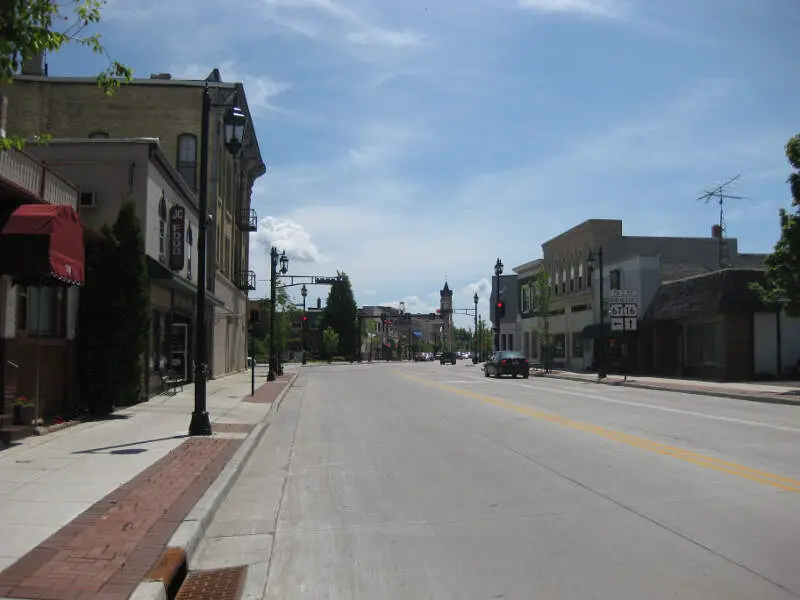
/10
Population: 8,913
% White: 93.57%
More on Plymouth: Data

/10
Population: 8,248
% White: 93.02%
More on Rhinelander: Data

/10
Population: 9,224
% White: 92.94%
More on Merrill: Data

/10
Population: 13,063
% White: 92.87%
More on Stoughton: Data

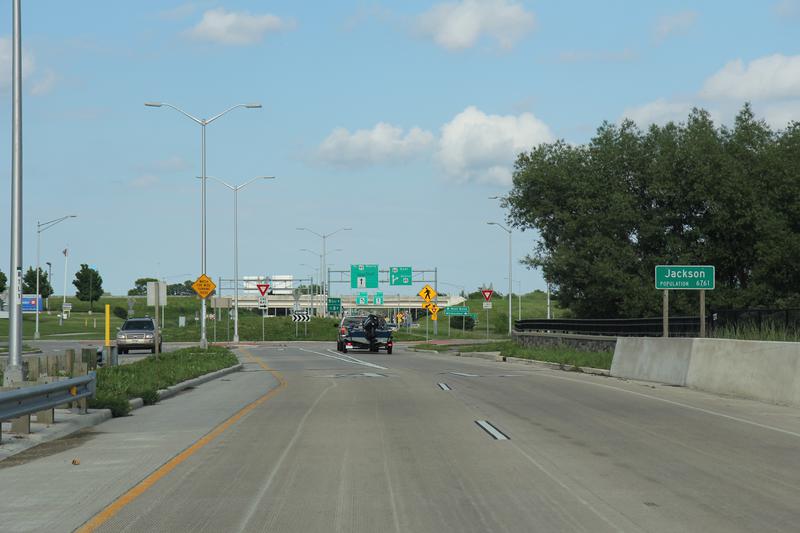
/10
Population: 7,882
% White: 92.49%
More on Jackson: Data

/10
Population: 9,030
% White: 92.2%
More on Rice Lake: Data
To rank the whitest places in Wisconsin, we used Saturday Night Science to look at Census demographic data. We had to look at the number of white people living in each city in Wisconsin on a per capita basis. In other words, the percentage of white people living in each city in Wisconsin. We looked at table B03002: Hispanic OR LATINO ORIGIN BY RACE. Here are the category names as defined by the Census: Our particular column of interest here was the number of people who identified as White alone. We limited our analysis to town with a population greater than 5,000 people. That left us with 137 cities. We then calculated the percentage of residents that are White. The percentages ranked from 97.4% to 32.3%. Finally, we ranked each city based on the percentage of White population, with a higher score being more White than a lower score. Mayville took the distinction of being the most White, while Milwaukee was the least White city. We updated this article for 2025. This report represents our tenth time ranking the whitest cities in Wisconsin. Read on for more information on how the cities in Wisconsin ranked by population of White residents or, for a more general take on diversity in America, head over to our ranking of the most diverse cities in America. We measured the locations with the highest percentage of white people in Wisconsin. According to the most recent data, this list provides accurate information on the whitest places in Wisconsin. The most White cities in Wisconsin are Mayville, Richfield, Oconomowoc, Marinette, Plymouth, Rhinelander, Merrill, Stoughton, Jackson, and Rice Lake. If you’re curious enough, here are the least White places in Wisconsin: For more Wisconsin reading, check out:Methodology: How we determined the whitest places in Wisconsin for 2025
Summary: White Populations Across Wisconsin
White Population By City In Wisconsin
Rank City Population White Population % White 1 Mayville 5,169 5,034 97.39% 2 Richfield 11,806 11,318 95.87% 3 Oconomowoc 18,385 17,550 95.46% 4 Marinette 11,060 10,507 95.0% 5 Plymouth 8,913 8,340 93.57% 6 Rhinelander 8,248 7,672 93.02% 7 Merrill 9,224 8,573 92.94% 8 Stoughton 13,063 12,132 92.87% 9 Jackson 7,882 7,290 92.49% 10 Rice Lake 9,030 8,326 92.2% 11 Sheboygan Falls 8,190 7,528 91.92% 12 Prairie Du Chien 5,471 5,023 91.81% 13 Twin Lakes 6,351 5,828 91.77% 14 Ripon 7,803 7,157 91.72% 15 Antigo 8,058 7,382 91.61% 16 River Falls 16,349 14,973 91.58% 17 Marshfield 18,718 17,114 91.43% 18 Waupaca 6,314 5,756 91.16% 19 Cedarburg 12,317 11,221 91.1% 20 Howard 20,261 18,447 91.05% 21 Mount Horeb 7,719 7,023 90.98% 22 Richland Center 5,030 4,573 90.91% 23 Menomonie 16,548 15,034 90.85% 24 Port Washington 12,569 11,404 90.73% 25 Hartford 15,761 14,280 90.6% 26 Muskego 25,156 22,775 90.54% 27 Lake Hallie 7,245 6,559 90.53% 28 Milton 5,685 5,132 90.27% 29 Elm Grove 6,428 5,802 90.26% 30 Little Chute 11,930 10,720 89.86% 31 Kronenwetter 8,420 7,565 89.85% 32 Kaukauna 17,237 15,483 89.82% 33 West Bend 31,722 28,482 89.79% 34 Chippewa Falls 14,643 13,147 89.78% 35 Baraboo 12,506 11,222 89.73% 36 Rothschild 5,532 4,964 89.73% 37 Grafton 12,274 11,001 89.63% 38 New Richmond 10,334 9,262 89.63% 39 Monroe 10,568 9,471 89.62% 40 Suamico 13,003 11,632 89.46% 41 Pewaukee 16,002 14,313 89.45% 42 Tomah 9,505 8,482 89.24% 43 Sturgeon Bay 9,702 8,637 89.02% 44 Superior 26,550 23,575 88.79% 45 Waterford 5,627 4,976 88.43% 46 Kimberly 7,432 6,570 88.4% 47 Hudson 15,004 13,259 88.37% 48 Verona 14,499 12,774 88.1% 49 New London 7,492 6,598 88.07% 50 Stevens Point 25,497 22,444 88.03% 51 Monona 8,604 7,567 87.95% 52 Pewaukee 8,240 7,231 87.75% 53 Platteville 11,421 10,022 87.75% 54 Oregon 11,384 9,982 87.68% 55 Altoona 8,750 7,670 87.66% 56 De Pere 25,368 22,228 87.62% 57 Two Rivers 11,224 9,824 87.53% 58 Waunakee 14,927 13,063 87.51% 59 Mcfarland 9,230 8,060 87.32% 60 Delafield 7,192 6,280 87.32% 61 Wisconsin Rapids 18,756 16,374 87.3% 62 La Crosse 51,791 45,174 87.22% 63 Lake Mills 6,391 5,569 87.14% 64 Plover 13,713 11,942 87.09% 65 Holmen 11,027 9,587 86.94% 66 Mukwonago 8,411 7,307 86.87% 67 Allouez 14,023 12,154 86.67% 68 Sussex 11,795 10,181 86.32% 69 Eau Claire 69,274 59,524 85.93% 70 Mequon 25,259 21,689 85.87% 71 Portage 10,374 8,884 85.64% 72 Janesville 65,813 56,140 85.3% 73 Hartland 9,716 8,278 85.2% 74 Watertown 22,873 19,461 85.08% 75 Sparta 9,921 8,428 84.95% 76 Onalaska 18,909 16,061 84.94% 77 New Berlin 40,384 34,296 84.92% 78 Hales Corners 7,627 6,465 84.76% 79 Fort Atkinson 12,490 10,583 84.73% 80 Lake Geneva 8,443 7,136 84.52% 81 Weston 15,784 13,264 84.03% 82 Edgerton 5,924 4,978 84.03% 83 Ashland 7,884 6,624 84.02% 84 Burlington 11,021 9,229 83.74% 85 Cottage Grove 7,906 6,608 83.58% 86 Neenah 27,409 22,775 83.09% 87 Beaver Dam 16,629 13,803 83.01% 88 Ashwaubenon 16,931 14,052 83.0% 89 Manitowoc 34,553 28,658 82.94% 90 Berlin 5,523 4,564 82.64% 91 Oshkosh 66,247 54,695 82.56% 92 Fox Point 6,746 5,565 82.49% 93 Menomonee Falls 38,963 32,123 82.44% 94 Germa 20,940 17,261 82.43% 95 Franklin 35,751 29,324 82.02% 96 Fond Du Lac 44,491 36,486 82.01% 97 Whitewater 15,705 12,860 81.88% 98 Whitefish Bay 14,750 12,074 81.86% 99 Shorewood 13,682 11,053 80.78% 100 Pleasant Prairie 21,515 17,332 80.56%