
The city of New York is not all Broadway, Times Square, and the Statue of Liberty: the Big Apple has some pretty scary neighborhoods and RoadSnacks is here to tell you just where they are located.
But first, we need to tell you how we got our hands on the top ten list of the worst neighborhoods in NYC for 2025. In order to determine New York City’s worst neighborhoods, we had to give each neighborhood an actual concrete score: we call this a neighborhood’s overall ‘Snackability’. To get this score, we looked at the latest census data on income levels, unemployment rates, crime, and home prices for 123 New York City neighborhoods with over 0 residents. Incidentally, this is our tenth time ranking NYC’s worst neighborhoods, so trust us when we say that these are the worst of the worst.
People, the places that made our list can’t seem to stay out of the news.for the wrong reasons. The locals in the Brownsville neighborhood apparently think it’s okay to shoot police officers and the Mott Haven neighborhood is currently experiencing an uptick in violent crimes. And for some reason, most of NYC’s worst neighborhoods are centered around the Bronx.
Funny thing, however, NYC’s list of worst neighborhoods and cheapest places to live had no overlapping. We consider this a win. You don’t have to sacrifice your safety if you’re on a budget.
So, want to know where New York City’s worst neighborhoods are located? Keep reading.
Table Of Contents: Top 10 | Methodology | Summary | Table
HomeSnacks is not your just your average website. We’ve been researching and ranking states and cities based on all types of criteria since 2015. We’ve had more than 50 million people read our published articles and we’ve been featured in hundreds of media outlets for our rankings, including this feature by the Hudson Valley Post So, yes we know what we’re talking about.
So, what’s the worst neighborhood in New York City for 2025? That would be Hunts Point.
To see what other NYC neighborhoods made this list, take a look below; and if you can’t find what you’re looking for there, head to the bottom.
For more New York reading, check out:
- Best Places To Live In New York
- Cheapest Places To Live In New York
- Most Dangerous Places In New York
The 10 Most Dangerous Neighborhoods In New York City For 2025
/10
Population: 11,425
Violent Crimes Per 100k: 4,435
Property Crime Per 100k: 7,932
Median Home Value: $352,400 (13th worst)
Median Income: $34,456 (4th worst)
More on Hunts Point: Data
Where’s the worst hood in New York City? Hunts Point is. Located in the Bronx, right along the East River, this ghetto little area of about 11,425 people takes the prize as being the worst place you can live in our nation’s biggest city.
The aggravated assault rate an insane hundred and fifty-one people per hundred thousand, and the arrest rate for rape has gone up by a factor of five. And more than 1 in 100 people here has been arrested and found guilty.
Like the rest of the city, for now, overall crime has gone down, but we’ll see what happens when the NYPD backs off. I mean can you imagine?
There’s a lot of homeless here too, and the homeless shelters are in terrible shape. Residents here have sort of tried – they’ve at least fought off plans to open more strip clubs in the area. And many complained about the crime for ages, but no one’s really done anything. In fact, while other New York City boroughs have gentrified and improved crime rates, the Bronx has been kinda neglected.
About 30 percent of Bronx County residents live below the poverty line, the largest share of any of New York’s 62 jurisdictions. And the Bronx remains one of the largest outdoor shooting ranges in the nation.
/10
Population: 3,226
Violent Crimes Per 100k: 910
Property Crime Per 100k: 3,267
Median Home Value: $428,400 (26th worst)
Median Income: $55,488 (22nd worst)
More on Clifton: Data
/10
Population: 10,349
Violent Crimes Per 100k: 606
Property Crime Per 100k: 3,118
Median Home Value: $230,318 (4th worst)
Median Income: $63,730 (39th worst)
More on Woodlawn-Nordwood: Data
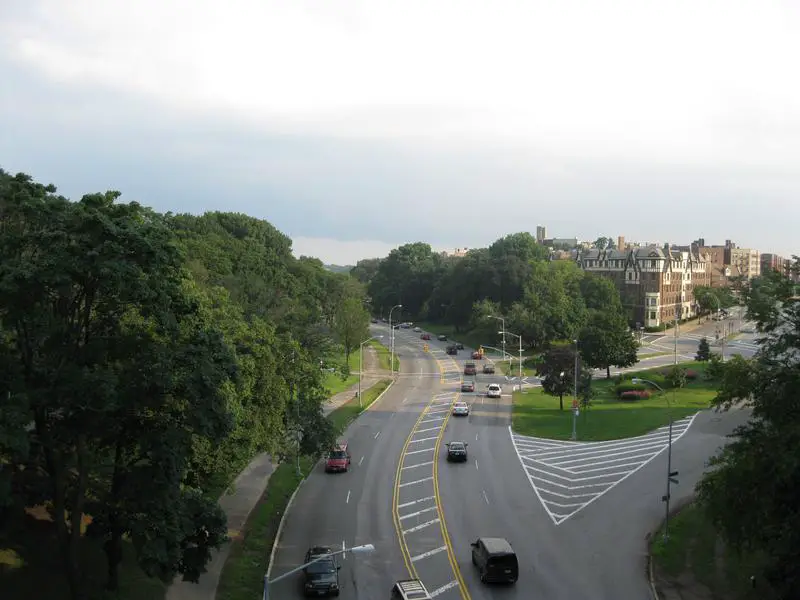
Located in the northwest part of the Bronx, Woodlawn-Nordwood sits on the outer edges of New York City. A little further along the road will take you to Yonkers and points north. The area also stands as the number 3 worst neighborhood in New York.
The 10,349 residents of the area often struggle to make ends meet. The economy is relatively healthy, but much of the locals’ median income of $63,730 gets eaten up by a high standard of living. The median home value stands at $230,318.
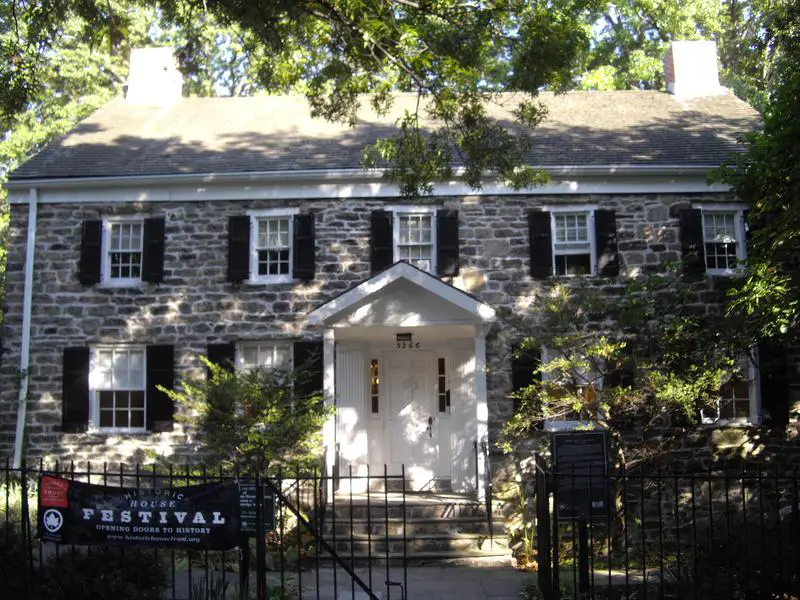
Woodlawn-Nordwood isn’t without its charms. It serves as home to many examples of unique architecture, such as the stunning St. Brendan’s Church. For a sample of old-time New York, you can also head to Valentine–Varian House, which dates back to 1758.
/10
Population: 47,457
Violent Crimes Per 100k: 3,478
Property Crime Per 100k: 5,652
Median Home Value: $460,138 (36th worst)
Median Income: $36,522 (5th worst)
More on Brownsville: Data
Back on the subway we go. We’re on the 3 train, just minding our own business. Worried about how safe it will be when we arrive.
We’re here. This is the Rockaway Ave Station in Brooklyn. We’re in Brownsville.
This neighborhood is down near Crown Heights, East Flatbush and East New York.
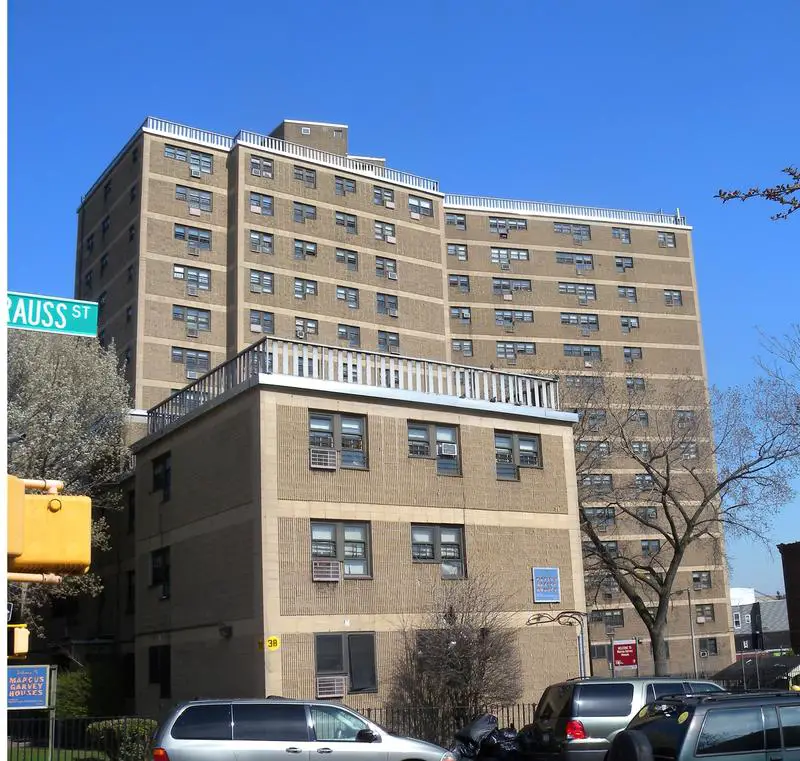
Brownsville is one of the few neighborhoods in New York that has remained relatively untouched by gentrification. The buildings in this area are older and the crime rate’s lower than its peak in 2012 when Time magazine called it one of the most dangerous hoods in the whole city.
Brownsville’s getting a little better. The hope is that gentrification will reach deep into this neighborhood. Since the Barclays Center was built in Brooklyn, neighborhoods have improved. When gentrification does take hold in Brownsville, that’s just going to push the poor people here up to the Bronx, into Westchester County into areas like Mt. Vernon, or even send them far away into places like South Philly.
Train’s leaving. I’m sure we’ll be back to Brooklyn at some point.
/10
Population: 55
Violent Crimes Per 100k: 860
Property Crime Per 100k: 3,087
Median Home Value: $335,250 (12th worst)
Median Income: $62,031 (33rd worst)
More on Steinway: Data
/10
Population: 147,562
Violent Crimes Per 100k: 1,249
Property Crime Per 100k: 3,302
Median Home Value: $354,964 (14th worst)
Median Income: $40,728 (9th worst)
More on East Brooklyn: Data
/10
Population: 39,750
Violent Crimes Per 100k: 832
Property Crime Per 100k: 2,630
Median Home Value: $285,142 (7th worst)
Median Income: $47,945 (17th worst)
More on Union Port: Data
/10
Population: 55,901
Violent Crimes Per 100k: 1,286
Property Crime Per 100k: 3,389
Median Home Value: $178,830 (3rd worst)
Median Income: $45,401 (14th worst)
More on Bedford Park: Data
Bedford Park is a diverse neighborhood located in the northwestern part of the Bronx, between Norwood and Fordham. Sections of the area are considered trendy, but a weak economy for the rest of the 55,901 residents makes this one of the hardest sections in New York City to live in.
A lack of good-paying jobs makes Bedford Park a difficult place to put down roots. The unemployment rate sits at a lofty 6.5%. While Bedford Park is more affordable than much of the rest of the city, residents struggle to make ends meet with a median income of $45,401.
Still, there are reasons to seek out Bedford Park. It features many lovely tree-lined neighborhoods and has its share of attractions. For example, you can check out the New York Botanical Gardens.
/10
Population: 56,005
Violent Crimes Per 100k: 817
Property Crime Per 100k: 1,841
Median Home Value: $239,389 (5th worst)
Median Income: $43,368 (11th worst)
More on Williams Bridge: Data
/10
Population: 36,668
Violent Crimes Per 100k: 586
Property Crime Per 100k: 3,929
Median Home Value: $127,395 (worst)
Median Income: $54,734 (2worst)
More on Kings Bridge: Data
Methodology: How we determined the most dangerous New York City neighborhoods in 2025
To figure out how bad a place is to live in, we only needed to know what kinds of things people like and then decide what places have the least amount of those things. We plugged the following criteria into Saturday Night Science to get the worst neighborhoods in New York City:
- High crime (Estimated)
- High unemployment (Less jobs)
- Low median income (Less pay)
- Low population density (No things to do)
- Low home values (No one’s willing to pay to live here)
Then, we ranked each neighborhood in New York City, New York for each of these criteria from worst to best.
Next, we averaged the individual rankings for each criterion into a “Worst Score.”
The neighborhood with the lowest “Worst Score” ranks as the most dangerous neighborhood of New York City.
The article is an opinion based on facts and is meant as infotainment. We updated this article for 2025. This report is our time ranking the worst neighborhoods to live in New York City.
Skip to the end to see the list of all 123 neighborhoods ranked from worst to best.
Summary: The Worst Neighborhoods Around New York City
Well, there you have it — the worst of the neighborhoods in New York City with Hunts Point landing at the bottom of the pack.
The worst neighborhoods in New York City are Hunts Point, Clifton, Woodlawn-Nordwood, Brownsville, Steinway, East Brooklyn, Union Port, Bedford Park, Williams Bridge, and Kings Bridge.
As mentioned earlier, the neighborhoods in New York City aren’t all bad. Battery Park takes the cake as the best place to live in New York City.
The best neighborhoods in New York City are Battery Park, Carnegie Hill, Upper East Side, Cobble Hill, and Murray Hill.
We ranked the neighborhoods from worst to best in the chart below.
For more New York reading, check out:
- Richest Cities In New York
- Safest Places In New York According To Science
- Worst Places To Live In New York State
Most Dangerous Neighborhoods To Live In New York City For 2025?
| Rank | Neighborhood | Population | Home Value | Median Income |
|---|---|---|---|---|
| 1 | Hunts Point | 11,425 | $352,400 | $34,456 |
| 2 | Clifton | 3,226 | $428,400 | $55,488 |
| 3 | Woodlawn-Nordwood | 10,349 | $230,318 | $63,730 |
| 4 | Brownsville | 47,457 | $460,138 | $36,522 |
| 5 | Steinway | 55 | $335,250 | $62,031 |
| 6 | East Brooklyn | 147,562 | $354,964 | $40,728 |
| 7 | Union Port | 39,750 | $285,142 | $47,945 |
| 8 | Bedford Park | 55,901 | $178,830 | $45,401 |
| 9 | Williams Bridge | 56,005 | $239,389 | $43,368 |
| 10 | Kings Bridge | 36,668 | $127,395 | $54,734 |
| 11 | Wakefield-Williamsbridge | 108,756 | $330,776 | $51,245 |
| 12 | High Bridge | 39,263 | $460,450 | $31,864 |
| 13 | Mott Haven | 51,253 | $490,343 | $30,394 |
| 14 | South Bronx | 94,230 | $481,247 | $32,781 |
| 15 | Tremont | 55,743 | $446,900 | $37,660 |
| 16 | Morris Heights | 43,069 | $453,080 | $39,507 |
| 17 | Parkchester | 40,838 | $281,648 | $59,426 |
| 18 | Soundview | 84,966 | $448,668 | $43,105 |
| 19 | The Rockaways | 119,512 | $297,562 | $63,514 |
| 20 | Eastchester | 11,257 | $430,033 | $84,107 |
| 21 | Fordham | 48,002 | $518,950 | $37,284 |
| 22 | Bedford-Stuyvesant | 234,457 | $467,116 | $44,779 |
| 23 | Howland Hook | 3,871 | $157,420 | $64,184 |
| 24 | Astoria-Long Island City | 126,283 | $397,118 | $57,906 |
| 25 | Yorkville | 56,751 | $330,640 | $46,148 |
| 26 | Saintalbans | 73,668 | $395,594 | $71,773 |
| 27 | Port Richmond | 17,368 | $401,650 | $77,048 |
| 28 | Bloomfield-Chelsea-Travis | 10,884 | $374,558 | $75,810 |
| 29 | Tottensville | 15,609 | $399,725 | $78,173 |
| 30 | Springfield Gardens | 19,098 | $509,200 | $86,749 |
| 31 | Jamaica | 131,773 | $492,953 | $68,501 |
| 32 | Midland Beach | 9,559 | $489,467 | $85,664 |
| 33 | South Beach | 8,036 | $454,100 | $88,241 |
| 34 | Mariners Harbor | 33,993 | $316,042 | $70,893 |
| 35 | Nkew Gardens | 90,685 | $376,981 | $67,182 |
| 36 | Morris Park | 36,251 | $479,960 | $68,130 |
| 37 | Sunny Side | 60,580 | $410,644 | $67,936 |
| 38 | Woodhaven-Richmond Hill | 121,346 | $461,136 | $62,501 |
| 39 | University Heights | 53,395 | $575,333 | $44,030 |
| 40 | Jackson Heights | 63,293 | $503,525 | $66,127 |
| 41 | New Brighton | 6,741 | $457,300 | $62,832 |
| 42 | Inwood | 40,035 | $425,657 | $65,039 |
| 43 | Richmondtown | 38,728 | $481,561 | $79,373 |
| 44 | Oakwood | 11,113 | $533,914 | $87,079 |
| 45 | Baychester | 18,238 | $453,325 | $89,569 |
| 46 | Fort Green | 120,941 | $663,709 | $71,767 |
| 47 | Gravesend-Sheepshead Bay | 255,533 | $545,099 | $58,223 |
| 48 | Rosebank | 11,991 | $481,956 | $77,571 |
| 49 | Flushing | 78,900 | $657,454 | $53,919 |
| 50 | Throggs Neck | 36,390 | $516,032 | $78,092 |
| 51 | Ettingville | 34,729 | $458,711 | $87,429 |
| 52 | Washington Heights | 170,572 | $554,229 | $60,340 |
| 53 | Riverdale | 14,118 | $405,592 | $104,116 |
| 54 | College Point | 26,932 | $733,374 | $63,320 |
| 55 | Mapleton-Flatlands | 206,460 | $610,874 | $56,352 |
| 56 | Laurelton | 27,665 | $488,835 | $97,949 |
| 57 | Queens Village | 56,496 | $498,356 | $89,618 |
| 58 | City Island | 4,322 | $590,067 | $107,660 |
| 59 | Hamilton Heights | 48,477 | $910,682 | $62,103 |
| 60 | Westerleigh-Castleton | 29,688 | $449,604 | $85,305 |
| 61 | Ardon Heights | 23,582 | $408,846 | $87,757 |
| 62 | Harlem | 131,215 | $978,624 | $64,830 |
| 63 | Bushwick | 110,855 | $869,402 | $64,602 |
| 64 | Canarsie | 86,694 | $579,181 | $76,372 |
| 65 | Douglastown-Little Neck | 82,321 | $518,824 | $83,053 |
| 66 | Glendale | 35,623 | $654,182 | $82,011 |
| 67 | Sunset Park | 93,293 | $943,771 | $57,733 |
| 68 | Lower East Side | 79,738 | $885,206 | $57,235 |
| 69 | Clearview | 28,704 | $555,508 | $81,878 |
| 70 | Chinatown | 10,815 | $1,053,520 | $72,970 |
| 71 | Queensboro Hill | 75,376 | $521,976 | $57,190 |
| 72 | East Harlem | 121,147 | $843,575 | $46,861 |
| 73 | Charlestown-Richmond Valley | 1,829 | $565,767 | $82,504 |
| 74 | Todt Hill | 4,467 | $812,500 | $142,381 |
| 75 | Annandale | 9,989 | $523,892 | $95,729 |
| 76 | Auburndale | 28,366 | $790,259 | $75,551 |
| 77 | Maspeth | 55,134 | $696,249 | $76,126 |
| 78 | Ridgewood | 69,396 | $756,326 | $76,103 |
| 79 | Corona | 107,981 | $707,427 | $60,039 |
| 80 | Williamsburg | 157,050 | $1,095,912 | $75,970 |
| 81 | Bay Ridge | 50,752 | $879,942 | $84,100 |
| 82 | West Village | 22,170 | $1,251,481 | $140,741 |
| 83 | Bensonhurst | 96,974 | $883,397 | $58,789 |
| 84 | Boerum Hill | 12,717 | $1,506,009 | $135,172 |
| 85 | Spuyten Duyvil | 16,320 | $359,578 | $110,042 |
| 86 | Whitestone | 39,821 | $838,977 | $87,013 |
| 87 | Greenwood | 17,307 | $948,600 | $98,534 |
| 88 | Dyker Heights | 36,602 | $956,217 | $73,713 |
| 89 | Woodside | 46,363 | $648,903 | $69,068 |
| 90 | Borough Park | 92,564 | $1,008,418 | $48,705 |
| 91 | Country Club | 7,843 | $579,543 | $92,363 |
| 92 | Great Kills | 23,788 | $559,585 | $111,056 |
| 93 | Rossville | 9,736 | $500,567 | $91,484 |
| 94 | Forest Hills | 72,632 | $580,702 | $94,597 |
| 95 | Greenwich Village | 44,403 | $1,236,862 | $155,690 |
| 96 | Carroll Gardens | 14,535 | $1,715,847 | $159,531 |
| 97 | Woodrow | 6,116 | $551,250 | $108,279 |
| 98 | Prince’s Bay | 9,669 | $668,967 | $109,917 |
| 99 | Middle Village | 34,717 | $725,579 | $89,872 |
| 100 | Flatbush | 129,617 | $805,687 | $68,707 |
| 101 | Clinton | 35,153 | $1,207,833 | $117,139 |
| 102 | Huguenot | 11,609 | $740,786 | $105,264 |
| 103 | East Village | 65,898 | $829,305 | $90,545 |
| 104 | Chelsea | 49,712 | $1,087,861 | $131,352 |
| 105 | Downtown | 15,186 | $1,074,885 | $134,995 |
| 106 | Little Italy | 8,216 | $1,770,800 | $107,048 |
| 107 | Midtown | 16,642 | $1,458,940 | $137,325 |
| 108 | Gramercy | 56,008 | $836,188 | $143,821 |
| 109 | Financial District | 31,183 | $1,221,787 | $175,518 |
| 110 | Utopia | 2,341 | $834,900 | $136,933 |
| 111 | Morningside Heights | 39,365 | $1,033,354 | $98,486 |
| 112 | Central Park | 2,973 | $1,669,593 | $136,230 |
| 113 | Tribeca | 21,871 | $1,862,334 | $205,908 |
| 114 | Garment District | 4,863 | $1,244,975 | $118,290 |
| 115 | Park Slope | 66,947 | $1,541,846 | $155,486 |
| 116 | Soho | 10,621 | $1,694,001 | $137,313 |
| 117 | Upper West Side | 209,387 | $1,520,156 | $137,257 |
| 118 | North Sutton Area | 17,279 | $763,965 | $147,814 |
| 119 | Murray Hill | 10,008 | $992,218 | $148,759 |
| 120 | Cobble Hill | 7,702 | $1,715,909 | $156,340 |
| 121 | Upper East Side | 187,724 | $1,412,032 | $152,408 |
| 122 | Carnegie Hill | 13,630 | $1,925,601 | $204,127 |
| 123 | Battery Park | 15,714 | $1,546,050 | $211,402 |
Why isn’t Stapleton and New Brighton on this list??? Cops don’t even respond to calls!!!
You can’t buy a house anywhere in NY for less than $100k idk where you got that information
Very biased article. Should read 10 worst nabes for hipsters.. There are a lot of nice affordable areas here. Woodlawn, really? Median #s are better than alot of the country. SMH…
The 10 are in the Bronx. Woodlawn? Lmao there’s about 0 violence in that area.
It’s half lies concealing half truth and half lies, making it one big lie to conceal the drug money Capitol harlem.
This article should just be titled “The Bronx Sucks”.
This was the most biased thing I’ve ever read. How is safety an 8 but it’s the worse neighborhoods in NYC? If you hate the Bronx sure, by all means express that but I have my parents relying on this fake news to keep me from going out.
downtown flushing
southern flushing
the rest of flushing.except for parts of broadway
ave f McDonald avenue Brooklyn- a real souk!
west side manhattan -times square
5th avenue (YES! insane traffic nonsensical construction and tourists)
elmhurst avenue queens
corona -Roosevelt avenue from shea stadium to sunnyside
Lived in New York City for 35 years, Bronx 149 between Tinton and wales ave. Raised 3 children there. I love the city and although there is a lot of action and noise, most people just trying to make it . I currently reside in P.A but, still work in the city, Tremont Ave and will not have it some other way. Walk around the neigborhood for shopping and, never experience anything negative. I will say if, something is going to happen it can happen anywhere whether is classified good or bad. If, wondering why I moved outside N.Y, homes are cheaper in price and, as I gotten older less noise is much better.
This list left out all of Mid-town, which to be honest, is probably one of the worst neighborhoods in all of NYC.
Midtown? Are you serious?! Have you ever been to East New York or Crotona? Midtown is a resort in comparison.
White people just decide that the Bronx is terrible but they want to come here and use it for cheap rent.
This is a total lie?
My block was shown.
The homes are worth more than 600,000.
You cannot buy a home in NYC for less than 300,000.
Wow. All lies? I hate NYC too. I was born & raised here, but it surely isn’t because house are less than $80 grand in the Bronx. Lmbo. You wish. In fact, we wish.
Mott Haven is prime Real Estate.a studio apartment is going for 550,000 on EAst 138th.
You must be from some small town we never heard of & your list is 100% innacurate.
In fact, the worst place anyone can live in NYC is Manhattan. It’s where I live, Harlem.
It’s run over with people, crowds, Restaurants, shopping, noise & at minimum – homes are $3 million on my street.
Boy bye.
Woodlawn-Norwood should be labelled South Woodlawn to distinguish it from Woodlawn Heights, several miles away and a 400 acre cemetery between. WH is a true homogeneous neighborhood with distinguishable boundries. Its’ area is small, people happy, water clean, children educated and homeless at a minimum. All things no so in South Woodlawn-Norwood. Do a little homework.
Bayridge is the safest place to live, just keep to your self and try not to make friends, just smile back at who ever smiles at u got to admit there racist people, once they see you more often they’ll get used to you. And start treating you with respect and kind, gotta admit rent is very high/
Worst part of my is most of Brooklyn except for the heights and a few other hipsters areas. I like visiting LONG ISLAND . Not the city anymore!