
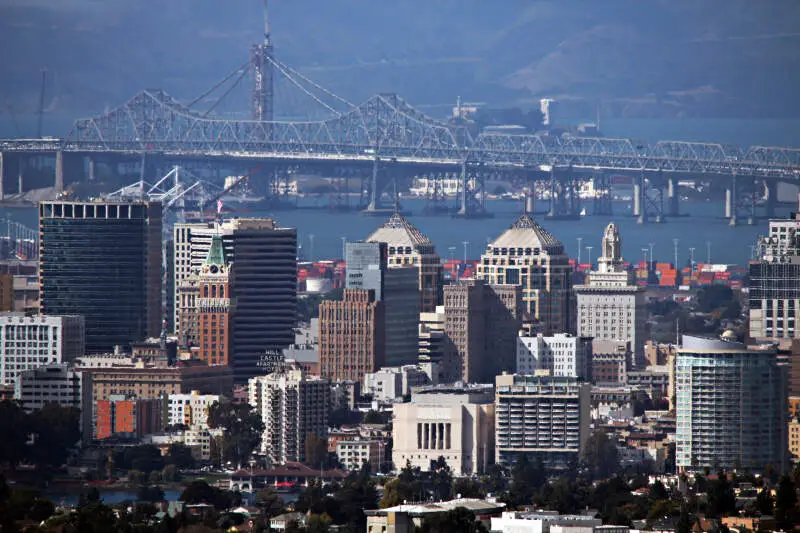
Oakland’s neighborhoods conjure up too many stereotypes to count. You’ve got hipster areas, preppy places, neighborhoods where college kids thrive, and of course, ghettos.
It seems as if there’s a neighborhood for everyone in Oakland.
And while the city consistently ranks as one of the best places to live in California thanks in part to tons of entertainment and jobs, it’s not all rainbows and sunshine in Oakland. Some neighborhoods aren’t as safe as others.
So the question arises, which Oakland neighborhoods are the most dangerous and which are the safest?
Today, we’ll use Saturday Night Science to determine which Oakland hoods need a little tender loving care – the sore thumbs of the Oakland area if you will. Realistically, you can’t expect all the neighborhoods to be amazing, although Fairview Park ranks way above the rest.
We examined 127 of Oakland’s neighborhoods to find out the most dangerous places to live. These places don’t quite measure up to Oakland’s reputation.
Table Of Contents: Top 10 | Methodology | Summary | Table
So what’s the worst neighborhood to live in Oakland for 2025? According to the most recent census data, Columbia Gardens looks to be the worst neighborhood in Oakland.
Read on to see how we determined the places around Oakland that need a pick-me-up. And remember, don’t blame the messenger.
For more California reading, check out:
- Best Places To Live In California
- Cheapest Places To Live In California
- Most Dangerous Cities In California
The 10 Most Dangerous Neighborhoods In Oakland For 2025
/10
Population: 105
Violent Crimes Per 100k: 5,825
Property Crime Per 100k: 16,188
Median Home Value: $328,600 (6th worst)
Median Income: $44,932 (15th worst)
More on Columbia Gardens: Data
/10
Population: 2,274
Violent Crimes Per 100k: 5,110
Property Crime Per 100k: 14,201
Median Home Value: $325,257 (5th worst)
Median Income: $60,700 (43rd worst)
More on Acorn-Acorn Industrial: Data
/10
Population: 764
Violent Crimes Per 100k: 5,382
Property Crime Per 100k: 14,957
Median Home Value: $387,700 (14th worst)
Median Income: $52,017 (29th worst)
More on Melrose: Data
/10
Population: 1,348
Violent Crimes Per 100k: 5,037
Property Crime Per 100k: 13,998
Median Home Value: $177,500 (worst)
Median Income: $73,646 (64th worst)
More on Produce And Waterfront: Data
/10
Population: 3,482
Violent Crimes Per 100k: 5,592
Property Crime Per 100k: 15,542
Median Home Value: $411,367 (20th worst)
Median Income: $37,745 (3rd worst)
More on Coliseum: Data
/10
Population: 2,066
Violent Crimes Per 100k: 5,635
Property Crime Per 100k: 15,660
Median Home Value: $361,350 (9th worst)
Median Income: $40,750 (9th worst)
More on Lockwood Tevis: Data
/10
Population: 704
Violent Crimes Per 100k: 5,133
Property Crime Per 100k: 14,266
Median Home Value: $372,700 (12th worst)
Median Income: $23,611 (worst)
More on Fruitvale Station: Data
/10
Population: 409
Violent Crimes Per 100k: 5,459
Property Crime Per 100k: 15,172
Median Home Value: $400,550 (18th worst)
Median Income: $65,132 (5worst)
More on Oakland Airport: Data
/10
Population: 1,772
Violent Crimes Per 100k: 5,379
Property Crime Per 100k: 14,948
Median Home Value: $405,050 (19th worst)
Median Income: $38,804 (6th worst)
More on Fitchburg: Data
/10
Population: 694
Violent Crimes Per 100k: 4,225
Property Crime Per 100k: 11,742
Median Home Value: $528,450 (43rd worst)
Median Income: $55,739 (36th worst)
More on Peralta-Laney: Data
Methodology: How we determined the most dangerous Oakland neighborhoods in 2025
To figure out how bad a place is to live in, we only needed to know what kinds of things people like and then decide what places have the least amount of those things. We plugged the following criteria into Saturday Night Science to get the worst neighborhoods in Oakland:
- High crime (Estimated)
- High unemployment (Less jobs)
- Low median income (Less pay)
- Low population density (No things to do)
- Low home values (No one’s willing to pay to live here)
Then, we ranked each neighborhood in Oakland, California for each of these criteria from worst to best.
Next, we averaged the individual rankings for each criterion into a “Worst Score.”
The neighborhood with the lowest “Worst Score” ranks as the most dangerous neighborhood of Oakland.
The article is an opinion based on facts and is meant as infotainment. We updated this article for 2025. This report is our time ranking the worst neighborhoods to live in Oakland.
Skip to the end to see the list of all 127 neighborhoods ranked from worst to best.
Summary: The Worst Neighborhoods Around Oakland
Well, there you have it — the worst of the neighborhoods in Oakland with Columbia Gardens landing at the bottom of the pack.
The worst neighborhoods in Oakland are Columbia Gardens, Acorn-Acorn Industrial, Melrose, Produce And Waterfront, Coliseum, Lockwood Tevis, Fruitvale Station, Oakland Airport, Fitchburg, and Peralta-Laney.
As mentioned earlier, the neighborhoods in Oakland aren’t all bad. Fairview Park takes the cake as the best place to live in Oakland.
The best neighborhoods in Oakland are Fairview Park, Piedmont, Montclair, Merriwood, and Panoramic Hill.
We ranked the neighborhoods from worst to best in the chart below.
For more California reading, check out:
Most Dangerous Neighborhoods To Live In Oakland For 2025?
| Rank | Neighborhood | Population | Home Value | Median Income |
|---|---|---|---|---|
| 1 | Columbia Gardens | 105 | $328,600 | $44,932 |
| 2 | Acorn-Acorn Industrial | 2,274 | $325,257 | $60,700 |
| 3 | Melrose | 764 | $387,700 | $52,017 |
| 4 | Produce And Waterfront | 1,348 | $177,500 | $73,646 |
| 5 | Coliseum | 3,482 | $411,367 | $37,745 |
| 6 | Lockwood Tevis | 2,066 | $361,350 | $40,750 |
| 7 | Fruitvale Station | 704 | $372,700 | $23,611 |
| 8 | Oakland Airport | 409 | $400,550 | $65,132 |
| 9 | Fitchburg | 1,772 | $405,050 | $38,804 |
| 10 | Peralta-Laney | 694 | $528,450 | $55,739 |
| 11 | Woodland | 1,863 | $362,200 | $41,431 |
| 12 | Coliseum Industrial | 8,697 | $397,467 | $45,911 |
| 13 | East Peralta | 1,744 | $619,367 | $52,764 |
| 14 | North Kennedy Tract | 1,319 | $609,800 | $37,994 |
| 15 | Bancroft Business-Havenscourt | 6,963 | $241,371 | $46,110 |
| 16 | Highland | 2,818 | $398,675 | $39,754 |
| 17 | Laurel | 1,616 | $462,967 | $51,387 |
| 18 | Old City-Produce And Waterfront | 2,153 | $448,040 | $76,119 |
| 19 | Chinatown | 3,163 | $524,900 | $31,838 |
| 20 | Hegenberger | 1,788 | $390,967 | $52,715 |
| 21 | Elmhurst Park | 1,971 | $422,667 | $41,152 |
| 22 | Reservoir Hill-Meadow Brook | 5,292 | $329,143 | $39,638 |
| 23 | Saint Elizabeth | 5,809 | $248,975 | $38,008 |
| 24 | Castlemont | 3,668 | $376,320 | $42,222 |
| 25 | Peralta-Hacienda | 2,486 | $348,300 | $47,859 |
| 26 | Eastmont | 3,424 | $426,967 | $53,836 |
| 27 | Lynn-Highland Park | 3,096 | $451,950 | $47,757 |
| 28 | Frick | 2,993 | $547,733 | $65,517 |
| 29 | Webster | 5,190 | $413,514 | $46,842 |
| 30 | Mcclymonds | 2,991 | $599,300 | $62,382 |
| 31 | South Stonehurst | 930 | $456,800 | $71,490 |
| 32 | Clawson | 2,185 | $592,750 | $86,830 |
| 33 | Fairfax Business-Wentworth-Holland | 2,338 | $293,750 | $44,870 |
| 34 | Seminary | 4,623 | $464,125 | $48,993 |
| 35 | Cox | 3,401 | $429,957 | $48,720 |
| 36 | Hawthorne | 2,449 | $628,050 | $42,796 |
| 37 | Iveywood | 3,875 | $422,333 | $54,228 |
| 38 | Sheffield Village | 214 | $786,900 | $129,130 |
| 39 | Arroyo Viejo | 5,874 | $418,150 | $61,366 |
| 40 | Oak Center | 3,677 | $758,400 | $50,624 |
| 41 | North Stonehurst | 4,105 | $433,600 | $54,529 |
| 42 | Rancho San Antonio | 6,055 | $533,120 | $49,626 |
| 43 | Toler Heights | 2,316 | $564,133 | $73,715 |
| 44 | Upper Peralta Creek-Bartlett | 3,256 | $371,600 | $48,575 |
| 45 | Brookfield Village | 3,656 | $422,367 | $64,445 |
| 46 | Highland Terrace | 3,951 | $495,840 | $49,488 |
| 47 | Ralph Bunche | 2,276 | $704,425 | $56,986 |
| 48 | Eastmont Hills | 2,724 | $635,350 | $110,692 |
| 49 | Bartlett | 2,051 | $467,760 | $56,034 |
| 50 | Dimond | 1,582 | $608,150 | $63,822 |
| 51 | Foothill Square | 1,295 | $566,500 | $64,250 |
| 52 | Tuxedo | 2,439 | $550,067 | $59,889 |
| 53 | South Kennedy Tract | 1,623 | $701,700 | $103,944 |
| 54 | Arrowhead Marsh | 1,372 | $611,633 | $96,834 |
| 55 | Mosswood | 2,462 | $973,300 | $88,010 |
| 56 | Durant Manor | 2,578 | $582,800 | $84,924 |
| 57 | Civic Center | 832 | $650,900 | $57,863 |
| 58 | Fremont | 5,075 | $502,825 | $86,075 |
| 59 | Patten | 2,619 | $584,400 | $55,978 |
| 60 | Hoover-Foster | 4,859 | $733,500 | $71,651 |
| 61 | Upper Laurel | 5,205 | $536,125 | $72,640 |
| 62 | Caballo Hills | 3,096 | $474,800 | $129,463 |
| 63 | Golf Links | 1,482 | $447,750 | $93,839 |
| 64 | School | 2,080 | $553,233 | $67,199 |
| 65 | Downtown | 3,128 | $737,667 | $83,100 |
| 66 | Prescott | 5,285 | $649,367 | $94,056 |
| 67 | Sequoyah | 4,128 | $561,700 | $120,190 |
| 68 | Sausal Creek | 2,135 | $585,825 | $72,278 |
| 69 | Pill Hill | 1,976 | $818,600 | $78,700 |
| 70 | Merritt | 4,429 | $588,600 | $65,628 |
| 71 | Harrington | 4,200 | $504,200 | $53,220 |
| 72 | Oakland Ave-Harrison St | 5,921 | $600,450 | $72,751 |
| 73 | Northgate | 1,790 | $875,000 | $73,556 |
| 74 | South Prescott | 285 | $625,000 | $163,932 |
| 75 | Millsmont | 5,861 | $625,800 | $72,298 |
| 76 | Waverly | 1,014 | $544,500 | $87,012 |
| 77 | San Pablo Gateway | 4,019 | $714,300 | $81,891 |
| 78 | Las Palmas | 3,120 | $473,700 | $78,751 |
| 79 | Sobrante Park | 3,735 | $509,900 | $62,560 |
| 80 | Mills College | 1,203 | $678,900 | $86,563 |
| 81 | Clinton | 7,705 | $579,371 | $63,619 |
| 82 | Temescal | 4,437 | $946,083 | $84,384 |
| 83 | Lakewide | 4,439 | $830,400 | $56,869 |
| 84 | Ivy Hill | 3,355 | $677,200 | $77,695 |
| 85 | Bella Vista | 1,407 | $675,000 | $93,352 |
| 86 | Joaquin Miller Park | 862 | $1,059,900 | $175,972 |
| 87 | Crestmont | 1,079 | $962,100 | $187,347 |
| 88 | Chabot Park | 4,616 | $698,000 | $111,840 |
| 89 | Maxwell Park | 5,657 | $661,360 | $97,675 |
| 90 | Longfellow | 6,510 | $769,657 | $93,785 |
| 91 | Jefferson | 4,142 | $528,650 | $67,829 |
| 92 | Mountain View Cemetery | 975 | $995,900 | $146,319 |
| 93 | Santa Fe | 3,949 | $784,650 | $90,486 |
| 94 | Paradise Park | 2,301 | $763,350 | $85,442 |
| 95 | Bushrod | 7,517 | $929,492 | $104,139 |
| 96 | Adams Point | 8,906 | $590,520 | $90,098 |
| 97 | Allendale | 4,519 | $575,025 | $66,695 |
| 98 | Gaskill | 2,243 | $819,333 | $95,553 |
| 99 | Shafter | 3,523 | $1,107,233 | $90,537 |
| 100 | Piedmont Pines | 3,198 | $1,059,900 | $183,535 |
| 101 | Fairfax | 2,414 | $560,000 | $84,670 |
| 102 | Golden Gate | 2,316 | $735,450 | $97,038 |
| 103 | Woodminster | 1,620 | $962,100 | $187,347 |
| 104 | Oakmore | 2,389 | $996,267 | $165,721 |
| 105 | Lake Merritt | 879 | $768,150 | $115,330 |
| 106 | Glenview | 5,707 | $966,357 | $129,882 |
| 107 | Piedmont Avenue | 7,021 | $736,086 | $89,932 |
| 108 | Glen Highlands | 1,287 | $1,079,750 | $177,448 |
| 109 | Shepherd Canyon | 1,786 | $1,058,967 | $176,316 |
| 110 | Upper Rockridge | 6,366 | $1,277,233 | $197,631 |
| 111 | Trestle Glen | 3,628 | $1,044,300 | $194,731 |
| 112 | Montclair Business | 178 | $1,089,800 | $198,750 |
| 113 | Grand Lake | 5,165 | $632,433 | $103,276 |
| 114 | Oak Tree | 5,164 | $953,033 | $46,722 |
| 115 | Lincoln Highlands | 1,881 | $912,600 | $126,466 |
| 116 | Upper Dimond | 6,177 | $842,340 | $116,945 |
| 117 | Claremont | 1,468 | $1,082,700 | $195,162 |
| 118 | Redwood Heights | 9,316 | $779,743 | $117,292 |
| 119 | Rockridge | 3,431 | $1,403,250 | $192,072 |
| 120 | Lakeshore | 4,717 | $1,037,650 | $169,975 |
| 121 | Hiller Highlands | 731 | $1,167,950 | $236,635 |
| 122 | Cleveland Heights | 8,157 | $870,700 | $99,605 |
| 123 | Panoramic Hill | 1,210 | $1,633,100 | $214,500 |
| 124 | Merriwood | 3,894 | $1,095,433 | $198,252 |
| 125 | Montclair | 4,335 | $1,341,575 | $214,386 |
| 126 | Piedmont | 10,992 | $1,604,023 | $204,144 |
| 127 | Fairview Park | 3,992 | $1,188,067 | $132,915 |