
Richmond’s neighborhoods conjure up too many stereotypes to count. You’ve got hipster areas, preppy places, neighborhoods where college kids thrive, and of course, ghettos.
It seems as if there’s a neighborhood for everyone in Richmond.
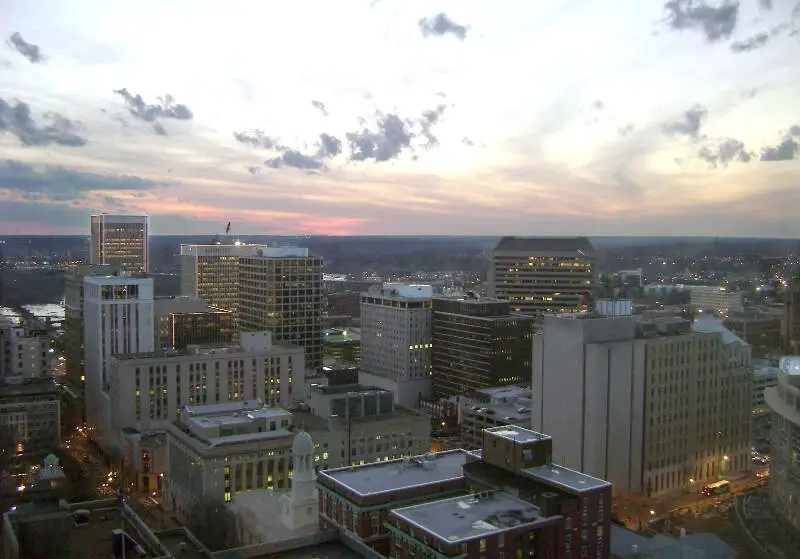
And while the city consistently ranks as one of the best places to live in Virginia thanks in part to tons of entertainment and jobs, it’s not all rainbows and sunshine in Richmond. Some neighborhoods aren’t as safe as others.
So the question arises, which Richmond neighborhoods are the most dangerous and which are the safest?
Today, we’ll use Saturday Night Science to determine which Richmond hoods need a little tender loving care – the sore thumbs of the Richmond area if you will. Realistically, you can’t expect all the neighborhoods to be amazing, although Colonial Place ranks way above the rest.
We examined 115 of Richmond’s neighborhoods to find out the most dangerous places to live. These places don’t quite measure up to Richmond’s reputation.
Table Of Contents: Top 10 | Methodology | Summary | Table
So what’s the worst neighborhood to live in Richmond for 2025? According to the most recent census data, Oak Grove looks to be the worst neighborhood in Richmond.
Read on to see how we determined the places around Richmond that need a pick-me-up. And remember, don’t blame the messenger.
For more Virginia reading, check out:
The 10 Most Dangerous Neighborhoods In Richmond For 2025
/10
Population: 1,692
Violent Crimes Per 100k: 833
Property Crime Per 100k: 5,621
Median Home Value: $95,850 (12th worst)
Median Income: $32,138 (14th worst)
More on Oak Grove: Data
/10
Population: 2,749
Violent Crimes Per 100k: 1,014
Property Crime Per 100k: 10,199
Median Home Value: $122,300 (26th worst)
Median Income: $27,597 (9th worst)
More on Jeff Davis: Data
Population: 525
Violent Crimes Per 100k: 741
Property Crime Per 100k: 3,781
Median Home Value: $76,500 (worst)
Median Income: $30,212 (11th worst)
More on Windsor: Data
/10
Population: 856
Violent Crimes Per 100k: 1,684
Property Crime Per 100k: 7,439
Median Home Value: $85,400 (4th worst)
Median Income: $17,672 (3rd worst)
More on Creighton: Data
/10
Population: 601
Violent Crimes Per 100k: 701
Property Crime Per 100k: 3,853
Median Home Value: $120,200 (22nd worst)
Median Income: $26,711 (8th worst)
More on Washington Park: Data
/10
Population: 700
Violent Crimes Per 100k: 1,041
Property Crime Per 100k: 5,435
Median Home Value: $107,733 (16th worst)
Median Income: $32,500 (16th worst)
More on Woodville: Data
/10
Population: 1,249
Violent Crimes Per 100k: 999
Property Crime Per 100k: 4,436
Median Home Value: $85,400 (4th worst)
Median Income: $17,624 (2nd worst)
More on Fairfield: Data
/10
Population: 470
Violent Crimes Per 100k: 758
Property Crime Per 100k: 5,103
Median Home Value: $92,150 (6th worst)
Median Income: $42,558 (36th worst)
More on Oakwood: Data
/10
Population: 208
Violent Crimes Per 100k: 389
Property Crime Per 100k: 13,916
Median Home Value: $167,400 (52nd worst)
Median Income: $57,068 (64th worst)
More on Maymont: Data
/10
Population: 246
Violent Crimes Per 100k: 66
Property Crime Per 100k: 5,043
Median Home Value: $96,800 (13th worst)
Median Income: $34,950 (23rd worst)
More on Magnolia Industrial Center: Data
Methodology: How we determined the most dangerous Richmond neighborhoods in 2025
To figure out how bad a place is to live in, we only needed to know what kinds of things people like and then decide what places have the least amount of those things. We plugged the following criteria into Saturday Night Science to get the worst neighborhoods in Richmond:
- High crime (Estimated)
- High unemployment (Less jobs)
- Low median income (Less pay)
- Low population density (No things to do)
- Low home values (No one’s willing to pay to live here)
Then, we ranked each neighborhood in Richmond, Virginia for each of these criteria from worst to best.
Next, we averaged the individual rankings for each criterion into a “Worst Score.”
The neighborhood with the lowest “Worst Score” ranks as the most dangerous neighborhood of Richmond.
The article is an opinion based on facts and is meant as infotainment. We updated this article for 2025. This report is our time ranking the worst neighborhoods to live in Richmond.
Skip to the end to see the list of all 115 neighborhoods ranked from worst to best.
Summary: The Worst Neighborhoods Around Richmond
Well, there you have it — the worst of the neighborhoods in Richmond with Oak Grove landing at the bottom of the pack.
The worst neighborhoods in Richmond are Oak Grove, Jeff Davis, Windsor, Creighton, Washington Park, Woodville, Fairfield, Oakwood, Maymont, and Magnolia Industrial Center.
As mentioned earlier, the neighborhoods in Richmond aren’t all bad. Colonial Place takes the cake as the best place to live in Richmond.
The best neighborhoods in Richmond are Colonial Place, Laburnum Park, Malvern Gardens, The Museum District, and Mary Munford.
We ranked the neighborhoods from worst to best in the chart below.
For more Virginia reading, check out:
Most Dangerous Neighborhoods To Live In Richmond For 2025?
| Rank | Neighborhood | Population | Home Value | Median Income |
|---|---|---|---|---|
| 1 | Oak Grove | 1,692 | $95,850 | $32,138 |
| 2 | Jeff Davis | 2,749 | $122,300 | $27,597 |
| 3 | Windsor | 525 | $76,500 | $30,212 |
| 4 | Creighton | 856 | $85,400 | $17,672 |
| 5 | Washington Park | 601 | $120,200 | $26,711 |
| 6 | Woodville | 700 | $107,733 | $32,500 |
| 7 | Fairfield | 1,249 | $85,400 | $17,624 |
| 8 | Oakwood | 470 | $92,150 | $42,558 |
| 9 | Maymont | 208 | $167,400 | $57,068 |
| 10 | Magnolia Industrial Center | 246 | $96,800 | $34,950 |
| 11 | Midlothian | 3,810 | $133,420 | $46,643 |
| 12 | Peter Paul | 743 | $107,733 | $32,500 |
| 13 | Pine Camp | 451 | $120,200 | $26,711 |
| 14 | Highland Terrace | 793 | $107,800 | $36,396 |
| 15 | Parnell Industrial Area | 1,324 | $140,300 | $53,706 |
| 16 | Green Park | 822 | $107,100 | $32,837 |
| 17 | Highland Park Southern Tip | 1,846 | $142,900 | $39,033 |
| 18 | Old Town Manchester | 1,438 | $81,500 | $46,999 |
| 19 | Belt Center | 1,034 | $133,900 | $64,814 |
| 20 | Carver | 2,277 | $210,000 | $38,732 |
| 21 | Whitcomb | 2,820 | $95,467 | $20,537 |
| 22 | Jahnke | 2,495 | $180,400 | $37,448 |
| 23 | Broad Rock Sports Complex | 488 | $148,300 | $31,217 |
| 24 | South Garden | 2,342 | $148,950 | $32,796 |
| 25 | Mcguire | 836 | $111,100 | $72,002 |
| 26 | Fairmount | 1,144 | $138,800 | $30,570 |
| 27 | City Center | 626 | $248,100 | $44,023 |
| 28 | Hillside Court | 789 | $115,400 | $30,125 |
| 29 | Cherry Gardens | 208 | $121,300 | $66,582 |
| 30 | Biotech And Mcv District | 413 | $185,600 | $57,188 |
| 31 | Mosby | 1,665 | $95,600 | $18,194 |
| 32 | Piney Knolls | 2,615 | $148,950 | $35,860 |
| 33 | Deerbourne | 802 | $134,900 | $61,894 |
| 34 | Hollywood Cemetery | 492 | $167,400 | $57,068 |
| 35 | Fulton | 5,842 | $149,367 | $33,831 |
| 36 | Bellemeade | 3,285 | $116,367 | $39,448 |
| 37 | Swansboro | 2,160 | $178,875 | $53,623 |
| 38 | Eastview | 3,400 | $79,450 | $19,804 |
| 39 | British Camp Farms | 1,122 | $141,300 | $53,892 |
| 40 | Warwick | 817 | $139,000 | $52,321 |
| 41 | Mcguire Manor | 1,312 | $134,900 | $48,079 |
| 42 | Broad Rock Industrial Park | 1,460 | $122,300 | $51,217 |
| 43 | North Highland Park | 3,834 | $111,300 | $34,250 |
| 44 | Cullenwood | 376 | $121,300 | $87,594 |
| 45 | Upper Shockoe Valley | 2,348 | $92,500 | $32,168 |
| 46 | Hickory Hill | 1,534 | $142,300 | $49,574 |
| 47 | Blackwell | 2,084 | $129,367 | $47,319 |
| 48 | Jackson Ward | 2,352 | $242,367 | $37,191 |
| 49 | Chamberlayne Industrial Center | 1,417 | $186,350 | $59,069 |
| 50 | Northrop | 1,330 | $292,100 | $39,570 |
| 51 | Oakwood Cemetery | 1,432 | $92,150 | $42,558 |
| 52 | Forest View | 864 | $252,300 | $80,785 |
| 53 | Swanson | 1,398 | $139,000 | $52,321 |
| 54 | Walmsley | 1,963 | $159,300 | $39,548 |
| 55 | John Marshall | 998 | $369,500 | $32,896 |
| 56 | Swansboro West | 2,617 | $95,100 | $43,084 |
| 57 | Westlake Hills | 1,355 | $203,833 | $49,905 |
| 58 | Worthington | 1,102 | $148,700 | $65,096 |
| 59 | Woodhaven | 1,954 | $127,500 | $50,417 |
| 60 | Southern Barton Heights | 1,279 | $179,367 | $56,312 |
| 61 | Providence Park | 1,235 | $131,050 | $46,259 |
| 62 | Virginia Union | 1,768 | $212,000 | $65,447 |
| 63 | Byrd Park | 1,608 | $270,933 | $66,915 |
| 64 | Woodland Heights | 1,542 | $236,650 | $74,637 |
| 65 | Pocoshock | 643 | $139,000 | $52,321 |
| 66 | The Diamond | 1,271 | $213,400 | $62,876 |
| 67 | Maymont Park | 200 | $243,650 | $72,534 |
| 68 | Westover | 2,934 | $147,150 | $53,316 |
| 69 | Ginter Park Terrace | 412 | $240,600 | $63,797 |
| 70 | Church Hill North | 2,128 | $187,217 | $52,930 |
| 71 | Chippenham Forest | 905 | $324,600 | $55,224 |
| 72 | Bryan Park | 933 | $287,200 | $37,549 |
| 73 | Cedarhurst | 2,564 | $199,200 | $57,467 |
| 74 | Edgewood | 692 | $154,200 | $57,994 |
| 75 | Belle And Mayo Islands | 331 | $228,300 | $50,928 |
| 76 | Vcu | 2,990 | $375,000 | $11,250 |
| 77 | Gravel Hill | 378 | $248,500 | $77,500 |
| 78 | Shockoe Slip | 181 | $483,300 | $37,123 |
| 79 | Stadium | 184 | $319,900 | $88,000 |
| 80 | Randolph | 3,292 | $222,033 | $53,224 |
| 81 | Rosedale | 827 | $190,000 | $69,372 |
| 82 | Brookland Park | 2,015 | $197,133 | $59,034 |
| 83 | Oregon Hill | 1,269 | $216,850 | $62,628 |
| 84 | Cottrell Farms | 1,546 | $146,500 | $44,828 |
| 85 | Ginter Park | 4,013 | $384,340 | $56,370 |
| 86 | Northern Barton Heights | 2,980 | $210,080 | $62,784 |
| 87 | Carillon | 576 | $319,900 | $88,000 |
| 88 | Southampton | 514 | $372,400 | $95,244 |
| 89 | Forest Hill Park | 499 | $346,700 | $94,593 |
| 90 | Shockoe Bottom | 3,068 | $418,250 | $42,467 |
| 91 | Powhite Park | 240 | $227,800 | $59,567 |
| 92 | Stratford Hills | 3,100 | $277,333 | $92,648 |
| 93 | Forest Hill Terrace | 1,340 | $290,250 | $92,462 |
| 94 | Willow Oaks | 665 | $248,500 | $77,500 |
| 95 | Central Office | 1,263 | $233,900 | $59,115 |
| 96 | Stony Point | 1,024 | $351,300 | $102,296 |
| 97 | Westover Hills West | 906 | $198,800 | $78,500 |
| 98 | Chimborazo | 2,026 | $245,920 | $66,724 |
| 99 | Carytown | 1,910 | $339,350 | $75,423 |
| 100 | Oxford | 1,815 | $310,100 | $87,925 |
| 101 | Westover Hills | 1,045 | $176,400 | $93,459 |
| 102 | Bellevue | 2,871 | $245,450 | $76,725 |
| 103 | Union Hill | 2,361 | $330,550 | $45,902 |
| 104 | The Fan | 13,391 | $522,436 | $75,369 |
| 105 | Church Hill | 3,360 | $389,467 | $61,490 |
| 106 | Huguenot | 2,235 | $277,700 | $82,908 |
| 107 | Willow Lawn | 895 | $388,733 | $110,913 |
| 108 | Three Chopt | 2,348 | $290,300 | $132,966 |
| 109 | Forest Hill | 1,517 | $317,550 | $119,094 |
| 110 | Stonewall Court | 829 | $544,600 | $159,538 |
| 111 | Mary Munford | 1,398 | $405,100 | $95,504 |
| 112 | The Museum District | 6,669 | $373,171 | $67,042 |
| 113 | Malvern Gardens | 1,414 | $353,200 | $105,048 |
| 114 | Laburnum Park | 1,144 | $447,000 | $106,121 |
| 115 | Colonial Place | 2,243 | $395,000 | $119,376 |