100 Biggest Cities In California For 2023
Using the latest Census data, we detail the 100 biggest cities in California. You can all see a comprehensive list of all 1,002 cities and places in California.

We all love the biggest cities that the Golden State has to offer. You know the places like Los Angeles and San Diego which make all the headlines.
But there are a bunch of other great large cities in California that don't get as much love.
We're going to change that right now.
Using the most recent Census data, we can tell you about all the places in California with a focus on the biggest. We update the data each year and this is our fourth time doing this.
Table Of Contents: Top Ten | Methodology | Table
The Largest Cities In California For 2023:
You can click here to see a full table of the full of the 100 biggest cities in California, along with every other place over 1,000 people big. It is sortable by clicking on the headers.
Read on below to see more on the biggest cities. Or for more reading on places to live in California, check out:
- Best Places To Live In California
- Cheapest Places To Live In California
- Most Dangerous Cities In California
The 10 Biggest Cities In California
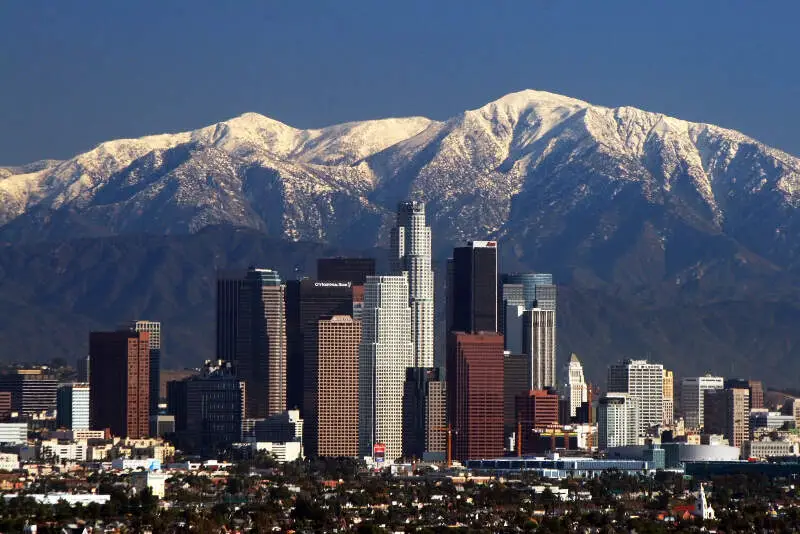
/10
Rank Last Year: 1 (No Change)
Population: 3,902,440
Population 2010: 3,772,486
Growth: 3.4%
More on Los Angeles: Data | Crime | Cost Of Living | Real Estate
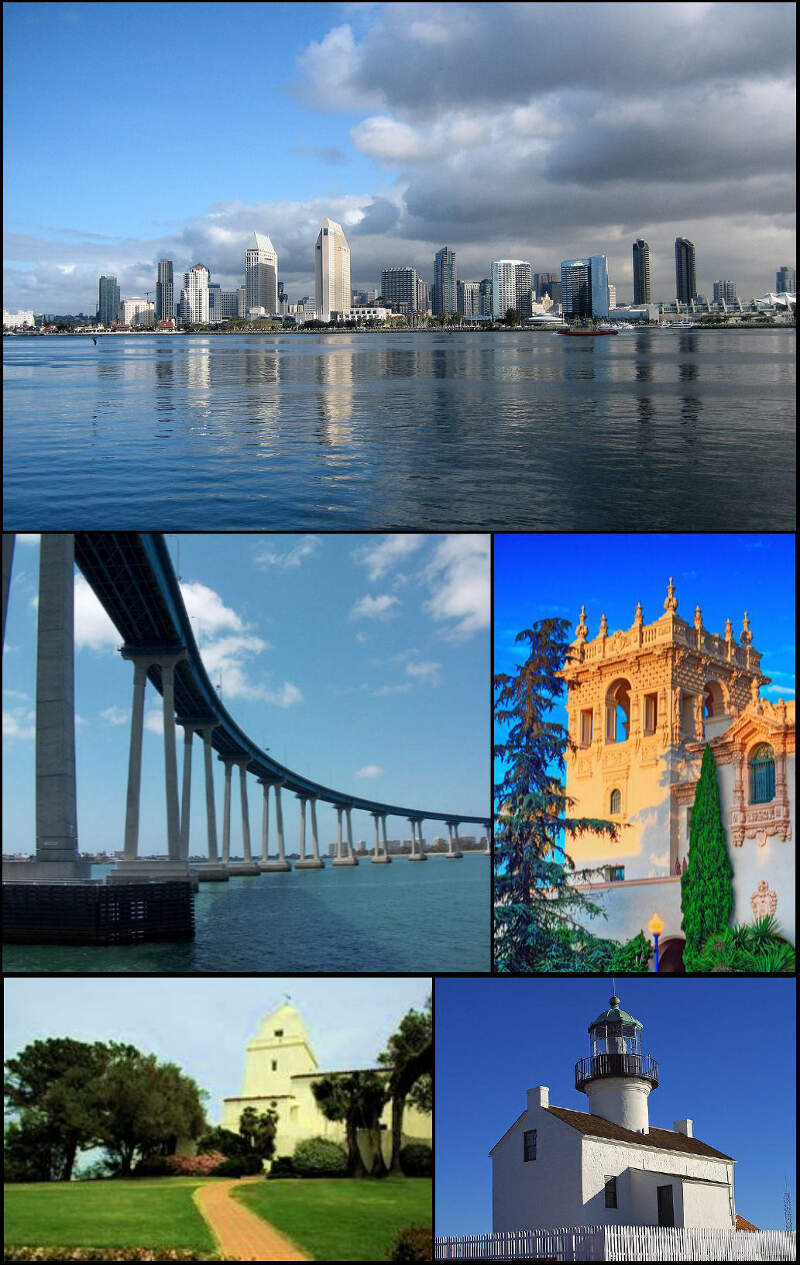
/10
Rank Last Year: 2 (No Change)
Population: 1,385,398
Population 2010: 1,282,800
Growth: 8.0%
More on San Diego: Data | Crime | Cost Of Living | Real Estate
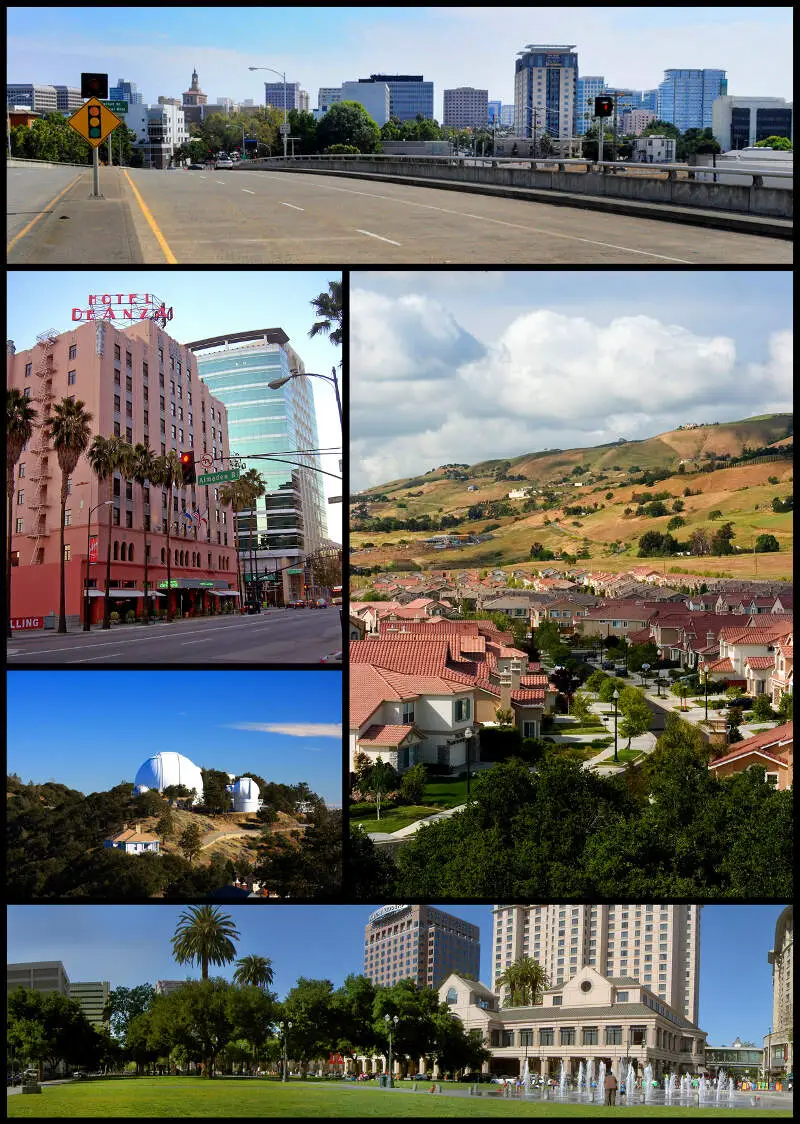
/10
Rank Last Year: 3 (No Change)
Population: 1,013,337
Population 2010: 925,300
Growth: 9.5%
More on San Jose: Data | Crime | Cost Of Living | Real Estate
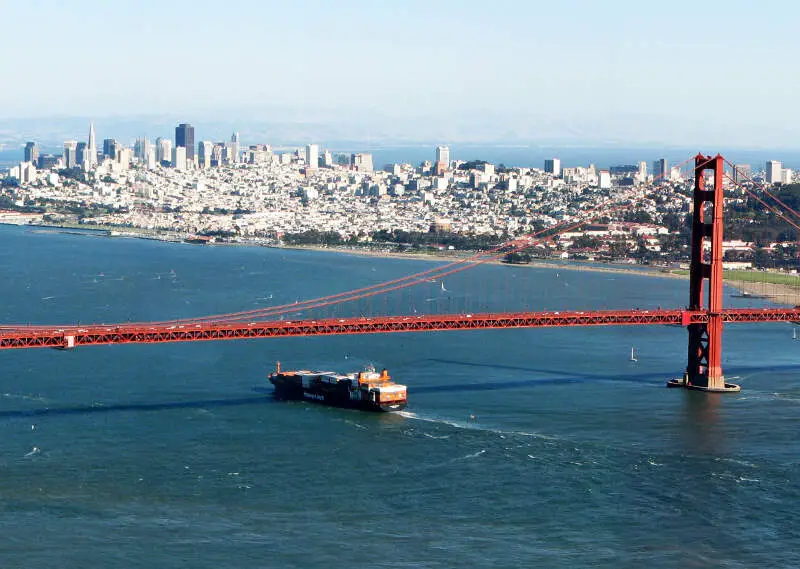
/10
Rank Last Year: 4 (No Change)
Population: 865,933
Population 2010: 789,172
Growth: 9.7%
More on San Francisco: Data | Crime | Cost Of Living | Real Estate
/10
Rank Last Year: 5 (No Change)
Population: 538,678
Population 2010: 484,008
Growth: 11.3%
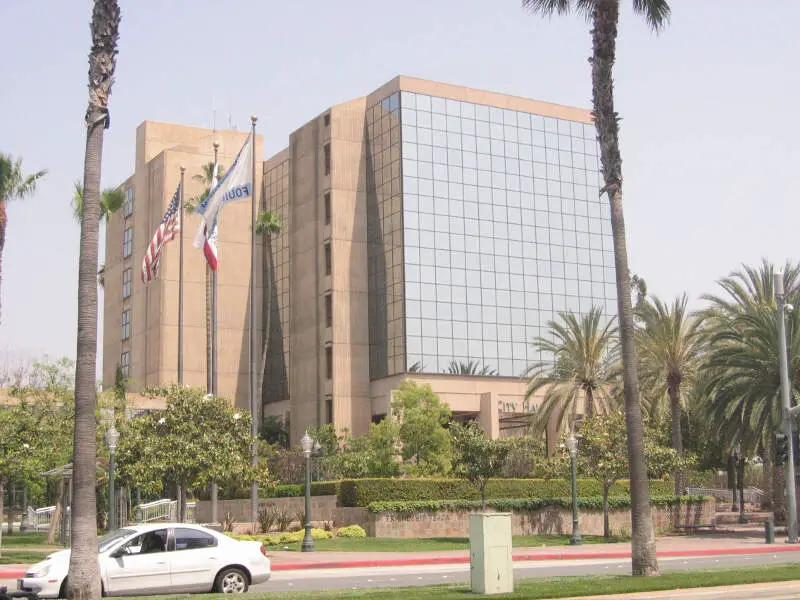
More on Fresno: Data | Crime | Cost Of Living | Real Estate
/10
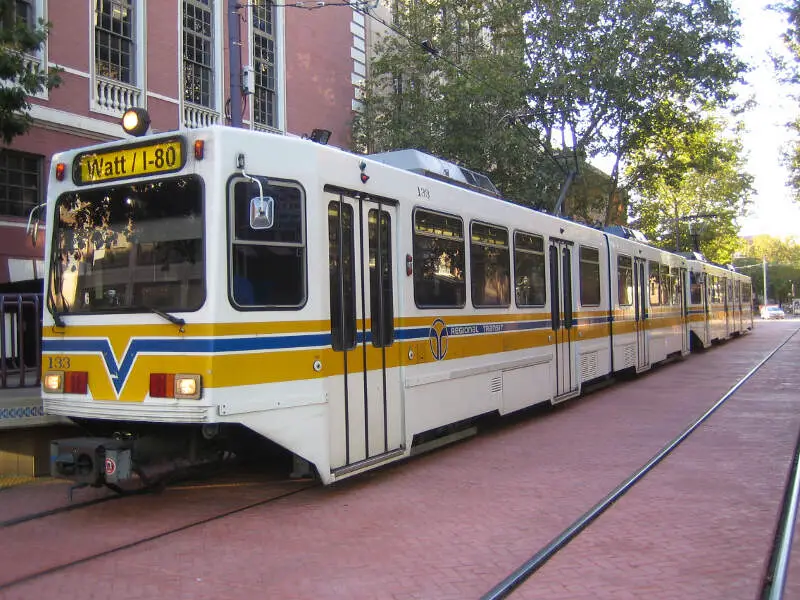
Rank Last Year: 6 (No Change)
Population: 518,605
Population 2010: 459,511
Growth: 12.9%
More on Sacramento: Data | Crime | Cost Of Living | Real Estate
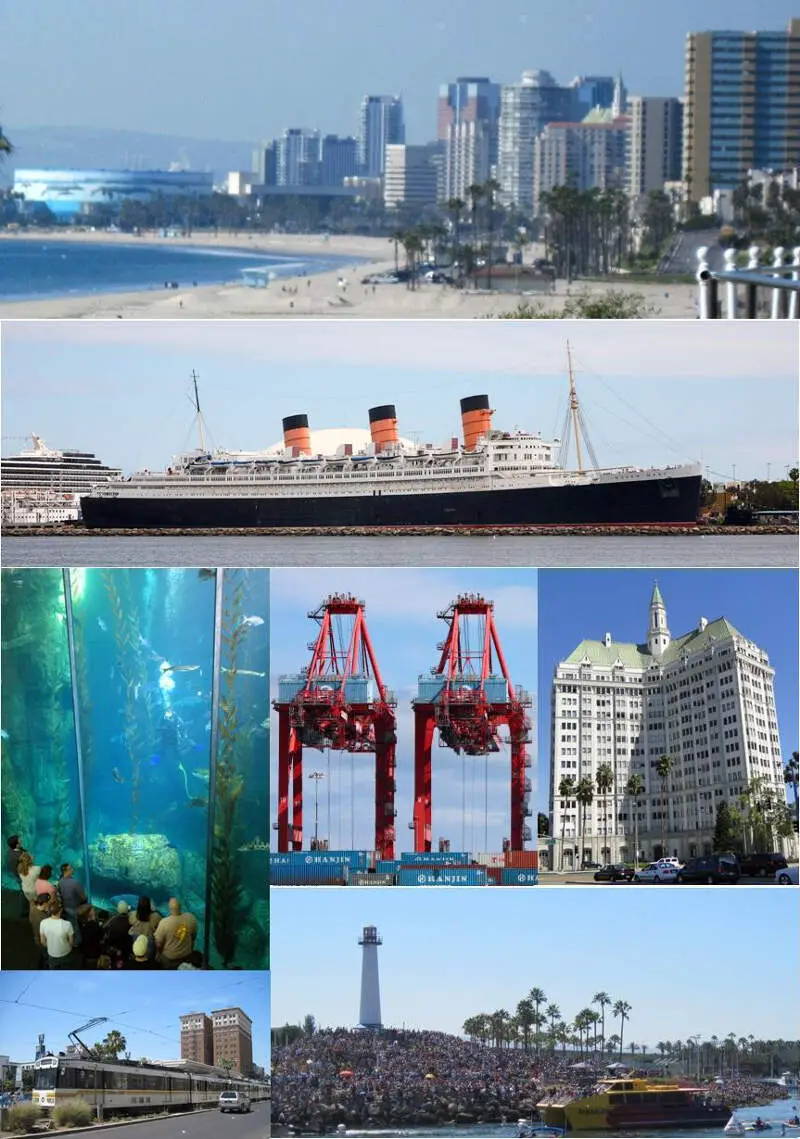
/10
Rank Last Year: 7 (No Change)
Population: 466,565
Population 2010: 461,823
Growth: 1.0%
More on Long Beach: Data | Crime | Cost Of Living | Real Estate
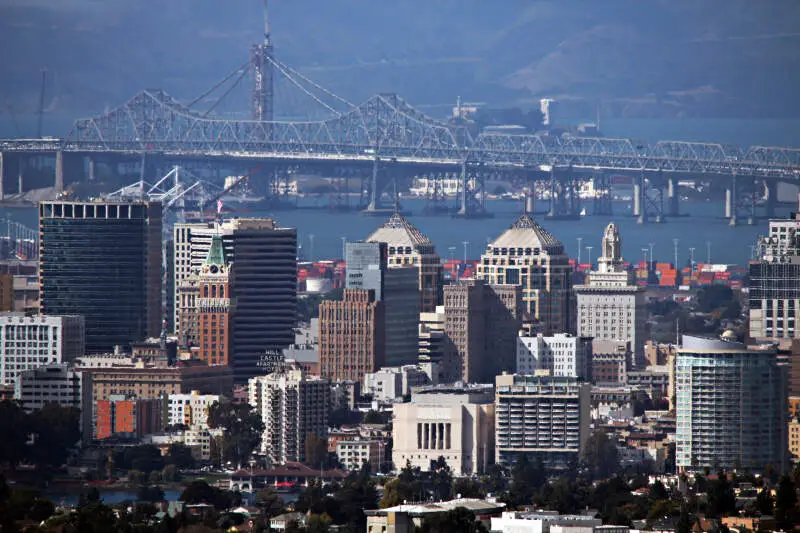
/10
Rank Last Year: 8 (No Change)
Population: 437,548
Population 2010: 386,909
Growth: 13.1%
More on Oakland: Data | Crime | Cost Of Living | Real Estate
/10
Rank Last Year: 9 (No Change)
Population: 398,756
Population 2010: 331,868
Growth: 20.2%
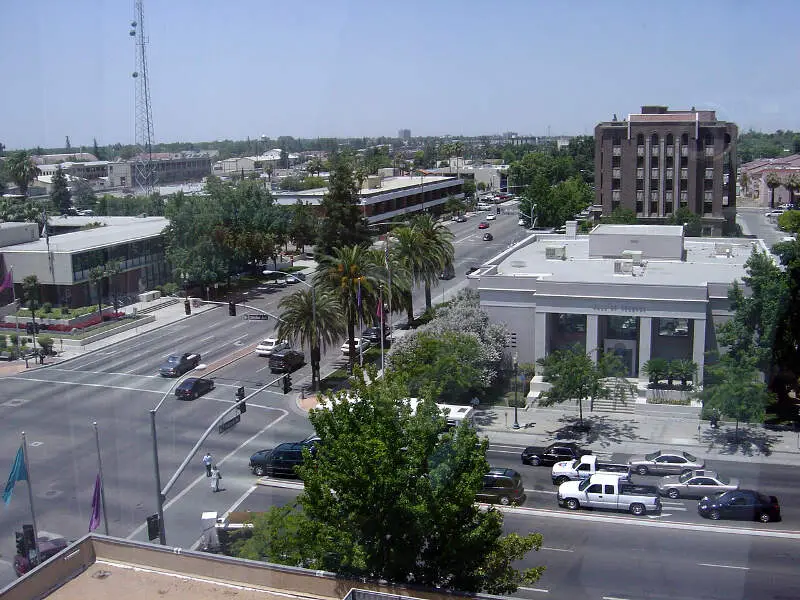
More on Bakersfield: Data | Crime | Cost Of Living | Real Estate
/10
Rank Last Year: 10 (No Change)
Population: 348,204
Population 2010: 333,039
Growth: 4.6%
More on Anaheim: Data | Crime | Cost Of Living | Real Estate
How We Determined The Largest Cities In California
We've been ranking and dissecting cities in the Golden State for over 4 years now -- making this actually the fourth time we've run the numbers. We always use the best data, the US Census. In this case, that means we are using the American Community Survey.
It what is probably the most simple analysis we run each year, we ranked every place in California from biggest to smallest. The biggest city this year? That would be Los Angeles.
The smallest? South Dos Palos, although there are places smaller than 1,000 people not listed here, so keep that in mind as we take a look at the top ten.
Now on to numbers 11-100 Biggest in California
We hope that you find the big city, or really any city, that's right for you. Below is a list of the rest of the biggest cities along with every other place in California.
Have fun snacking around in the Golden State!
For more reading on California, check out:
- Best Places To Raise A Family In California
- Best Places To Retire In California
- Richest Cities In California
- Safest Places In California
- Worst Places To Live In California
- Most Expensive Places To Live In California
Detailed List Of The Biggest Cities In California
| Rank | City | Current Population | 2010 | Growth | |||||
|---|---|---|---|---|---|---|---|---|---|
| 1 | Los Angeles | 3,902,440 | 3,772,486 | 3.4% | |||||
| 2 | San Diego | 1,385,398 | 1,282,800 | 8.0% | |||||
| 3 | San Jose | 1,013,337 | 925,300 | 9.5% | |||||
| 4 | San Francisco | 865,933 | 789,172 | 9.7% | |||||
| 5 | Fresno | 538,678 | 484,008 | 11.3% | |||||
| 6 | Sacramento | 518,605 | 459,511 | 12.9% | |||||
| 7 | Long Beach | 466,565 | 461,823 | 1.0% | |||||
| 8 | Oakland | 437,548 | 386,909 | 13.1% | |||||
| 9 | Bakersfield | 398,756 | 331,868 | 20.2% | |||||
| 10 | Anaheim | 348,204 | 333,039 | 4.6% | |||||
| 11 | Stockton | 317,818 | 287,377 | 10.6% | |||||
| 12 | Riverside | 314,858 | 300,553 | 4.8% | |||||
| 13 | Santa Ana | 313,818 | 325,216 | -3.5% | |||||
| 14 | Irvine | 297,868 | 199,117 | 49.6% | |||||
| 15 | Chula Vista | 274,818 | 229,614 | 19.7% | |||||
| 16 | Fremont | 231,502 | 209,235 | 10.6% | |||||
| 17 | Santa Clarita | 227,182 | 172,253 | 31.9% | |||||
| 18 | San Bernardino | 220,821 | 209,174 | 5.6% | |||||
| 19 | Modesto | 217,728 | 201,898 | 7.8% | |||||
| 20 | Moreno Valley | 208,371 | 187,428 | 11.2% | |||||
| 21 | Fontana | 208,087 | 189,466 | 9.8% | |||||
| 22 | Oxnard | 202,981 | 192,520 | 5.4% | |||||
| 23 | Huntington Beach | 198,735 | 188,914 | 5.2% | |||||
| 24 | Glendale | 196,512 | 192,190 | 2.2% | |||||
| 25 | Santa Rosa | 179,213 | 162,647 | 10.2% | |||||
| 26 | Elk Grove | 175,510 | 141,200 | 24.3% | |||||
| 27 | Ontario | 175,223 | 165,215 | 6.1% | |||||
| 28 | Oceanside | 174,461 | 164,709 | 5.9% | |||||
| 29 | Rancho Cucamonga | 173,946 | 160,780 | 8.2% | |||||
| 30 | Garden Grove | 172,708 | 169,009 | 2.2% | |||||
| 31 | Lancaster | 171,820 | 149,709 | 14.8% | |||||
| 32 | Palmdale | 167,987 | 146,184 | 14.9% | |||||
| 33 | Salinas | 163,004 | 147,074 | 10.8% | |||||
| 34 | Hayward | 162,254 | 141,498 | 14.7% | |||||
| 35 | Corona | 157,844 | 150,497 | 4.9% | |||||
| 36 | Sunnyvale | 155,550 | 136,480 | 14.0% | |||||
| 37 | Pomona | 151,592 | 148,775 | 1.9% | |||||
| 38 | Escondido | 151,443 | 140,998 | 7.4% | |||||
| 39 | Torrance | 147,156 | 143,951 | 2.2% | |||||
| 40 | Roseville | 145,687 | 113,820 | 28.0% | |||||
| 41 | Fullerton | 142,964 | 132,872 | 7.6% | |||||
| 42 | Visalia | 140,109 | 119,312 | 17.4% | |||||
| 43 | Orange | 139,195 | 134,569 | 3.4% | |||||
| 44 | Pasadena | 138,771 | 136,449 | 1.7% | |||||
| 45 | Victorville | 132,924 | 108,088 | 23.0% | |||||
| 46 | Santa Clara | 127,922 | 112,466 | 13.7% | |||||
| 47 | Thousand Oaks | 127,274 | 124,671 | 2.1% | |||||
| 48 | Simi Valley | 126,809 | 121,662 | 4.2% | |||||
| 49 | Concord | 125,769 | 121,326 | 3.7% | |||||
| 50 | Vallejo | 125,350 | 116,030 | 8.0% | |||||
| 51 | Berkeley | 119,607 | 109,408 | 9.3% | |||||
| 52 | East Los Angeles | 118,964 | 123,136 | -3.4% | |||||
| 53 | Fairfield | 118,932 | 103,698 | 14.7% | |||||
| 54 | Clovis | 118,488 | 91,166 | 30.0% | |||||
| 55 | Richmond | 115,677 | 102,264 | 13.1% | |||||
| 56 | Carlsbad | 114,858 | 99,753 | 15.1% | |||||
| 57 | Antioch | 114,750 | 99,717 | 15.1% | |||||
| 58 | Downey | 114,293 | 110,921 | 3.0% | |||||
| 59 | Costa Mesa | 112,148 | 109,316 | 2.6% | |||||
| 60 | Murrieta | 111,096 | 95,668 | 16.1% | |||||
| 61 | San Buenaventura (Ventura) | 110,572 | 105,211 | 5.1% | |||||
| 62 | El Monte | 110,144 | 113,888 | -3.3% | |||||
| 63 | West Covina | 109,396 | 105,552 | 3.6% | |||||
| 64 | Temecula | 109,376 | 95,829 | 14.1% | |||||
| 65 | Santa Maria | 109,309 | 94,645 | 15.5% | |||||
| 66 | Inglewood | 108,206 | 110,053 | -1.7% | |||||
| 67 | Burbank | 107,364 | 102,723 | 4.5% | |||||
| 68 | El Cajon | 106,043 | 97,932 | 8.3% | |||||
| 69 | San Mateo | 105,087 | 94,751 | 10.9% | |||||
| 70 | Daly City | 104,914 | 99,829 | 5.1% | |||||
| 71 | Jurupa Valley | 104,684 | 0 | nan% | |||||
| 72 | Chico | 103,898 | 85,130 | 22.0% | |||||
| 73 | Rialto | 103,799 | 99,311 | 4.5% | |||||
| 74 | Norwalk | 103,330 | 105,108 | -1.7% | |||||
| 75 | Vacaville | 102,256 | 91,928 | 11.2% | |||||
| 76 | Menifee | 101,089 | 72,494 | 39.4% | |||||
| 77 | Hesperia | 99,287 | 86,405 | 14.9% | |||||
| 78 | Vista | 98,651 | 92,478 | 6.7% | |||||
| 79 | Compton | 96,083 | 95,761 | 0.3% | |||||
| 80 | Arden-Arcade | 95,909 | 90,920 | 5.5% | |||||
| 81 | Carson | 95,104 | 91,299 | 4.2% | |||||
| 82 | San Marcos | 94,313 | 78,127 | 20.7% | |||||
| 83 | Mission Viejo | 93,932 | 92,615 | 1.4% | |||||
| 84 | South Gate | 93,308 | 94,683 | -1.5% | |||||
| 85 | Redding | 93,251 | 89,380 | 4.3% | |||||
| 86 | Santa Monica | 92,828 | 88,679 | 4.7% | |||||
| 87 | Tracy | 92,792 | 79,416 | 16.8% | |||||
| 88 | Westminster | 91,267 | 88,921 | 2.6% | |||||
| 89 | San Leandro | 91,176 | 82,830 | 10.1% | |||||
| 90 | Chino | 90,279 | 77,729 | 16.1% | |||||
| 91 | Santa Barbara | 89,132 | 87,859 | 1.4% | |||||
| 92 | Hemet | 88,903 | 76,403 | 16.4% | |||||
| 93 | Indio | 88,542 | 72,486 | 22.2% | |||||
| 94 | Livermore | 88,403 | 78,520 | 12.6% | |||||
| 95 | Hawthorne | 87,863 | 84,195 | 4.4% | |||||
| 96 | Citrus Heights | 87,521 | 84,351 | 3.8% | |||||
| 97 | Whittier | 87,184 | 84,997 | 2.6% | |||||
| 98 | Merced | 85,993 | 77,080 | 11.6% | |||||
| 99 | Newport Beach | 85,806 | 83,571 | 2.7% | |||||
| 100 | San Ramon | 85,688 | 66,822 | 28.2% | |||||
| 101 | Lake Forest | 85,516 | 76,724 | 11.5% | |||||
| 102 | Buena Park | 83,974 | 79,744 | 5.3% | |||||
| 103 | Redwood City | 83,905 | 75,193 | 11.6% | |||||
| 104 | Alhambra | 83,174 | 83,389 | -0.3% | |||||
| 105 | Lakewood | 82,419 | 79,859 | 3.2% | |||||
| 106 | Mountain View | 82,409 | 72,510 | 13.7% | |||||
| 107 | Manteca | 82,408 | 64,959 | 26.9% | |||||
| 108 | Tustin | 79,895 | 73,731 | 8.4% | |||||
| 109 | Napa | 79,700 | 76,006 | 4.9% | |||||
| 110 | Milpitas | 79,593 | 65,150 | 22.2% | |||||
| 111 | Pleasanton | 79,558 | 68,204 | 16.6% | |||||
| 112 | Folsom | 79,201 | 69,068 | 14.7% | |||||
| 113 | Bellflower | 79,070 | 75,944 | 4.1% | |||||
| 114 | Upland | 78,624 | 73,887 | 6.4% | |||||
| 115 | Rancho Cordova | 78,358 | 63,297 | 23.8% | |||||
| 116 | Alameda | 78,320 | 72,512 | 8.0% | |||||
| 117 | Chino Hills | 78,229 | 74,410 | 5.1% | |||||
| 118 | Perris | 78,106 | 63,644 | 22.7% | |||||
| 119 | Carmichael | 77,358 | 61,806 | 25.2% | |||||
| 120 | Pittsburg | 75,701 | 61,723 | 22.6% | |||||
| 121 | Apple Valley | 75,311 | 67,396 | 11.7% | |||||
| 122 | Baldwin Park | 72,813 | 75,387 | -3.4% | |||||
| 123 | Redlands | 72,649 | 68,852 | 5.5% | |||||
| 124 | Turlock | 72,494 | 67,376 | 7.6% | |||||
| 125 | Redondo Beach | 70,998 | 66,054 | 7.5% | |||||
| 126 | Union City | 70,828 | 68,081 | 4.0% | |||||
| 127 | Camarillo | 70,593 | 63,599 | 11.0% | |||||
| 128 | Rocklin | 70,317 | 54,276 | 29.6% | |||||
| 129 | Walnut Creek | 69,876 | 63,808 | 9.5% | |||||
| 130 | Dublin | 69,818 | 42,657 | 63.7% | |||||
| 131 | Yuba City | 69,540 | 63,435 | 9.6% | |||||
| 132 | Lake Elsinore | 68,822 | 48,644 | 41.5% | |||||
| 133 | Palo Alto | 68,624 | 62,486 | 9.8% | |||||
| 134 | Eastvale | 68,539 | 0 | nan% | |||||
| 135 | Tulare | 68,395 | 56,938 | 20.1% | |||||
| 136 | Yorba Linda | 68,319 | 62,915 | 8.6% | |||||
| 137 | Lynwood | 67,497 | 69,806 | -3.3% | |||||
| 138 | Davis | 67,208 | 64,842 | 3.6% | |||||
| 139 | South San Francisco | 66,331 | 62,016 | 7.0% | |||||
| 140 | Castro Valley | 66,324 | 60,625 | 9.4% | |||||
| 141 | Madera | 66,173 | 59,006 | 12.1% | |||||
| 142 | Lodi | 66,107 | 62,225 | 6.2% | |||||
| 143 | Laguna Niguel | 64,608 | 62,614 | 3.2% | |||||
| 144 | San Clemente | 64,600 | 60,774 | 6.3% | |||||
| 145 | Florence-Graham | 64,109 | 60,834 | 5.4% | |||||
| 146 | Brentwood | 63,618 | 46,283 | 37.5% | |||||
| 147 | La Habra | 63,287 | 59,772 | 5.9% | |||||
| 148 | Montebello | 62,828 | 62,416 | 0.7% | |||||
| 149 | Santa Cruz | 62,714 | 58,269 | 7.6% | |||||
| 150 | Pico Rivera | 62,383 | 62,988 | -1.0% | |||||
| 151 | Porterville | 62,164 | 52,762 | 17.8% | |||||
| 152 | Encinitas | 62,140 | 58,761 | 5.8% | |||||
| 153 | San Rafael | 61,158 | 56,930 | 7.4% | |||||
| 154 | Monterey Park | 61,153 | 60,176 | 1.6% | |||||
| 155 | La Mesa | 61,040 | 56,250 | 8.5% | |||||
| 156 | Woodland | 60,977 | 54,785 | 11.3% | |||||
| 157 | Gardena | 60,917 | 58,668 | 3.8% | |||||
| 158 | Cupertino | 60,681 | 56,498 | 7.4% | |||||
| 159 | Petaluma | 60,050 | 56,689 | 5.9% | |||||
| 160 | Santee | 59,679 | 52,966 | 12.7% | |||||
| 161 | Gilroy | 58,802 | 46,807 | 25.6% | |||||
| 162 | South Whittier | 58,800 | 56,882 | 3.4% | |||||
| 163 | Hanford | 57,359 | 52,315 | 9.6% | |||||
| 164 | Fountain Valley | 57,139 | 54,961 | 4.0% | |||||
| 165 | National City | 56,846 | 57,343 | -0.9% | |||||
| 166 | Highland | 56,733 | 52,341 | 8.4% | |||||
| 167 | Arcadia | 56,697 | 55,704 | 1.8% | |||||
| 168 | Huntington Park | 55,439 | 58,642 | -5.5% | |||||
| 169 | Diamond Bar | 55,339 | 55,701 | -0.6% | |||||
| 170 | Hacienda Heights | 54,841 | 53,639 | 2.2% | |||||
| 171 | Yucaipa | 54,312 | 50,227 | 8.1% | |||||
| 172 | Paramount | 53,904 | 54,187 | -0.5% | |||||
| 173 | Colton | 53,894 | 52,187 | 3.3% | |||||
| 174 | West Sacramento | 53,589 | 45,961 | 16.6% | |||||
| 175 | San Jacinto | 53,299 | 41,203 | 29.4% | |||||
| 176 | Novato | 53,214 | 50,488 | 5.4% | |||||
| 177 | Watsonville | 52,966 | 49,580 | 6.8% | |||||
| 178 | Glendora | 52,458 | 49,882 | 5.2% | |||||
| 179 | Delano | 52,206 | 51,310 | 1.7% | |||||
| 180 | Beaumont | 52,081 | 32,847 | 58.6% | |||||
| 181 | Placentia | 51,951 | 49,566 | 4.8% | |||||
| 182 | Aliso Viejo | 51,943 | 46,329 | 12.1% | |||||
| 183 | Cathedral City | 51,836 | 50,597 | 2.4% | |||||
| 184 | Rosemead | 51,698 | 53,670 | -3.7% | |||||
| 185 | Florin | 51,568 | 47,869 | 7.7% | |||||
| 186 | Palm Desert | 51,081 | 48,534 | 5.2% | |||||
| 187 | Covina | 51,061 | 47,533 | 7.4% | |||||
| 188 | Cypress | 50,279 | 47,314 | 6.3% | |||||
| 189 | Cerritos | 49,630 | 49,432 | 0.4% | |||||
| 190 | Azusa | 49,457 | 46,015 | 7.5% | |||||
| 191 | Lincoln | 49,203 | 37,771 | 30.3% | |||||
| 192 | Ceres | 49,132 | 44,153 | 11.3% | |||||
| 193 | Poway | 49,005 | 47,481 | 3.2% | |||||
| 194 | Rowland Heights | 48,765 | 51,566 | -5.4% | |||||
| 195 | El Dorado Hills | 48,612 | 43,179 | 12.6% | |||||
| 196 | North Highlands | 48,424 | 42,683 | 13.5% | |||||
| 197 | Antelope | 48,421 | 45,691 | 6.0% | |||||
| 198 | Rancho Santa Margarita | 48,190 | 47,539 | 1.4% | |||||
| 199 | La Mirada | 47,957 | 48,174 | -0.5% | |||||
| 200 | Newark | 47,815 | 41,981 | 13.9% | |||||
| 201 | San Luis Obispo | 47,257 | 44,959 | 5.1% | |||||
| 202 | Brea | 46,912 | 38,427 | 22.1% | |||||
| 203 | Morgan Hill | 45,267 | 36,630 | 23.6% | |||||
| 204 | Palm Springs | 44,799 | 45,012 | -0.5% | |||||
| 205 | Los Banos | 44,421 | 34,548 | 28.6% | |||||
| 206 | Rohnert Park | 44,420 | 40,521 | 9.6% | |||||
| 207 | El Centro | 44,322 | 41,581 | 6.6% | |||||
| 208 | Lompoc | 44,232 | 41,864 | 5.7% | |||||
| 209 | Campbell | 43,954 | 38,692 | 13.6% | |||||
| 210 | San Bruno | 43,775 | 40,231 | 8.8% | |||||
| 211 | Danville | 43,673 | 41,738 | 4.6% | |||||
| 212 | Altadena | 43,384 | 45,446 | -4.5% | |||||
| 213 | Oakley | 42,996 | 33,496 | 28.4% | |||||
| 214 | Rancho Palos Verdes | 42,316 | 41,535 | 1.9% | |||||
| 215 | Coachella | 42,123 | 38,144 | 10.4% | |||||
| 216 | Vineyard | 41,505 | 25,388 | 63.5% | |||||
| 217 | Hollister | 41,077 | 34,539 | 18.9% | |||||
| 218 | Culver City | 40,640 | 38,827 | 4.7% | |||||
| 219 | French Valley | 40,188 | 21,008 | 91.3% | |||||
| 220 | Bell Gardens | 39,870 | 42,408 | -6.0% | |||||
| 221 | San Gabriel | 39,673 | 39,670 | 0.0% | |||||
| 222 | Calexico | 38,798 | 36,304 | 6.9% | |||||
| 223 | Pacifica | 38,595 | 36,805 | 4.9% | |||||
| 224 | La Presa | 38,492 | 34,885 | 10.3% | |||||
| 225 | La Puente | 38,447 | 40,075 | -4.1% | |||||
| 226 | Stanton | 38,167 | 37,990 | 0.5% | |||||
| 227 | Monrovia | 37,999 | 36,616 | 3.8% | |||||
| 228 | Montclair | 37,871 | 36,704 | 3.2% | |||||
| 229 | La Quinta | 37,846 | 35,661 | 6.1% | |||||
| 230 | Foothill Farms | 37,432 | 32,800 | 14.1% | |||||
| 231 | Martinez | 37,308 | 35,622 | 4.7% | |||||
| 232 | Adelanto | 37,229 | 29,764 | 25.1% | |||||
| 233 | Temple City | 36,526 | 35,222 | 3.7% | |||||
| 234 | Wildomar | 36,511 | 30,637 | 19.2% | |||||
| 235 | Claremont | 36,312 | 34,713 | 4.6% | |||||
| 236 | Moorpark | 36,201 | 33,808 | 7.1% | |||||
| 237 | Westmont | 35,913 | 31,301 | 14.7% | |||||
| 238 | Orangevale | 35,729 | 34,202 | 4.5% | |||||
| 239 | West Hollywood | 35,678 | 34,657 | 2.9% | |||||
| 240 | Manhattan Beach | 35,585 | 34,867 | 2.1% | |||||
| 241 | San Juan Capistrano | 35,319 | 34,263 | 3.1% | |||||
| 242 | San Dimas | 34,775 | 33,635 | 3.4% | |||||
| 243 | Pleasant Hill | 34,649 | 32,826 | 5.6% | |||||
| 244 | Oildale | 34,350 | 32,754 | 4.9% | |||||
| 245 | Bell | 33,915 | 35,648 | -4.9% | |||||
| 246 | Menlo Park | 33,677 | 31,318 | 7.5% | |||||
| 247 | Foster City | 33,511 | 29,746 | 12.7% | |||||
| 248 | Dana Point | 33,327 | 33,484 | -0.5% | |||||
| 249 | Los Gatos | 33,309 | 28,878 | 15.3% | |||||
| 250 | Fallbrook | 32,999 | 29,892 | 10.4% | |||||
| 251 | Beverly Hills | 32,903 | 33,980 | -3.2% | |||||
| 252 | Goleta | 32,677 | 29,397 | 11.2% | |||||
| 253 | Seaside | 32,631 | 32,431 | 0.6% | |||||
| 254 | Lawndale | 32,035 | 32,552 | -1.6% | |||||
| 255 | Desert Hot Springs | 31,988 | 24,675 | 29.6% | |||||
| 256 | San Pablo | 31,975 | 29,136 | 9.7% | |||||
| 257 | Fair Oaks | 31,750 | 30,715 | 3.4% | |||||
| 258 | El Paso De Robles (Paso Robles) | 31,593 | 28,794 | 9.7% | |||||
| 259 | Los Altos | 31,562 | 28,409 | 11.1% | |||||
| 260 | La Verne | 31,423 | 31,177 | 0.8% | |||||
| 261 | Laguna Hills | 31,409 | 30,416 | 3.3% | |||||
| 262 | Atwater | 31,401 | 27,587 | 13.8% | |||||
| 263 | Saratoga | 31,194 | 29,523 | 5.7% | |||||
| 264 | Burlingame | 31,142 | 28,204 | 10.4% | |||||
| 265 | Orcutt | 30,940 | 28,696 | 7.8% | |||||
| 266 | San Carlos | 30,754 | 27,830 | 10.5% | |||||
| 267 | Santa Paula | 30,741 | 29,145 | 5.5% | |||||
| 268 | San Lorenzo | 30,420 | 23,562 | 29.1% | |||||
| 269 | Monterey | 30,014 | 27,827 | 7.9% | |||||
| 270 | East Palo Alto | 29,888 | 27,894 | 7.1% | |||||
| 271 | Atascadero | 29,771 | 27,981 | 6.4% | |||||
| 272 | Banning | 29,664 | 29,030 | 2.2% | |||||
| 273 | Suisun City | 29,436 | 27,742 | 6.1% | |||||
| 274 | Walnut | 28,641 | 29,327 | -2.3% | |||||
| 275 | Belmont | 28,109 | 25,281 | 11.2% | |||||
| 276 | Lathrop | 28,078 | 17,040 | 64.8% | |||||
| 277 | Ridgecrest | 27,989 | 27,386 | 2.2% | |||||
| 278 | Temescal Valley | 27,546 | 22,630 | 21.7% | |||||
| 279 | Lemon Grove | 27,513 | 25,074 | 9.7% | |||||
| 280 | Wasco | 27,505 | 25,143 | 9.4% | |||||
| 281 | Benicia | 27,191 | 26,959 | 0.9% | |||||
| 282 | Twentynine Palms | 27,176 | 26,215 | 3.7% | |||||
| 283 | South Pasadena | 26,837 | 25,376 | 5.8% | |||||
| 284 | Eureka | 26,763 | 26,954 | -0.7% | |||||
| 285 | Lemoore | 26,631 | 23,901 | 11.4% | |||||
| 286 | Windsor | 26,548 | 25,760 | 3.1% | |||||
| 287 | Brawley | 26,431 | 24,288 | 8.8% | |||||
| 288 | Sanger | 26,424 | 23,370 | 13.1% | |||||
| 289 | Imperial Beach | 26,375 | 26,254 | 0.5% | |||||
| 290 | West Whittier-Los Nietos | 26,275 | 25,188 | 4.3% | |||||
| 291 | Norco | 26,176 | 26,984 | -3.0% | |||||
| 292 | Hercules | 26,050 | 23,061 | 13.0% | |||||
| 293 | El Cerrito | 25,898 | 23,320 | 11.1% | |||||
| 294 | North Tustin | 25,708 | 24,520 | 4.8% | |||||
| 295 | Ladera Ranch | 25,526 | 18,170 | 40.5% | |||||
| 296 | Maywood | 25,477 | 27,515 | -7.4% | |||||
| 297 | Galt | 25,385 | 23,074 | 10.0% | |||||
| 298 | Lafayette | 25,384 | 23,769 | 6.8% | |||||
| 299 | Seal Beach | 25,216 | 24,081 | 4.7% | |||||
| 300 | Reedley | 25,168 | 23,669 | 6.3% | |||||
| 301 | Barstow | 25,123 | 22,983 | 9.3% | |||||
| 302 | Soledad | 25,102 | 25,350 | -1.0% | |||||
| 303 | Bay Point | 24,999 | 21,197 | 17.9% | |||||
| 304 | Riverbank | 24,714 | 21,778 | 13.5% | |||||
| 305 | Loma Linda | 24,712 | 22,837 | 8.2% | |||||
| 306 | Selma | 24,545 | 22,617 | 8.5% | |||||
| 307 | Dinuba | 24,383 | 20,823 | 17.1% | |||||
| 308 | Rosemont | 24,343 | 22,851 | 6.5% | |||||
| 309 | San Fernando | 24,086 | 23,623 | 2.0% | |||||
| 310 | Willowbrook | 24,006 | 35,174 | -31.8% | |||||
| 311 | Ashland | 23,640 | 22,098 | 7.0% | |||||
| 312 | Patterson | 23,517 | 19,110 | 23.1% | |||||
| 313 | Calabasas | 23,410 | 22,686 | 3.2% | |||||
| 314 | Linda | 23,304 | 17,406 | 33.9% | |||||
| 315 | Mountain House | 23,132 | 7,496 | 208.6% | |||||
| 316 | Laguna Beach | 23,121 | 22,788 | 1.5% | |||||
| 317 | Millbrae | 23,083 | 21,007 | 9.9% | |||||
| 318 | Oakdale | 23,016 | 20,076 | 14.6% | |||||
| 319 | West Puente Valley | 23,003 | 22,823 | 0.8% | |||||
| 320 | Cudahy | 23,003 | 23,854 | -3.6% | |||||
| 321 | East San Gabriel | 22,941 | 15,131 | 51.6% | |||||
| 322 | Corcoran | 22,616 | 25,136 | -10.0% | |||||
| 323 | Marina | 22,246 | 19,529 | 13.9% | |||||
| 324 | Bloomington | 22,107 | 24,982 | -11.5% | |||||
| 325 | West Carson | 22,024 | 20,940 | 5.2% | |||||
| 326 | Rancho San Diego | 22,019 | 20,247 | 8.8% | |||||
| 327 | West Rancho Dominguez | 22,007 | 5,761 | 282.0% | |||||
| 328 | Winter Gardens | 21,978 | 20,193 | 8.8% | |||||
| 329 | Port Hueneme | 21,954 | 21,723 | 1.1% | |||||
| 330 | Ramona | 21,853 | 21,482 | 1.7% | |||||
| 331 | Valinda | 21,811 | 22,157 | -1.6% | |||||
| 332 | American Canyon | 21,735 | 17,692 | 22.9% | |||||
| 333 | Duarte | 21,723 | 21,380 | 1.6% | |||||
| 334 | Granite Bay | 21,673 | 22,681 | -4.4% | |||||
| 335 | Yucca Valley | 21,663 | 20,290 | 6.8% | |||||
| 336 | Lennox | 21,514 | 21,594 | -0.4% | |||||
| 337 | South Lake Tahoe | 21,355 | 22,114 | -3.4% | |||||
| 338 | Lomita | 20,884 | 20,186 | 3.5% | |||||
| 339 | Mead Valley | 20,698 | 17,616 | 17.5% | |||||
| 340 | Coronado | 20,627 | 19,721 | 4.6% | |||||
| 341 | Rosamond | 20,574 | 17,029 | 20.8% | |||||
| 342 | Oroville | 20,409 | 15,369 | 32.8% | |||||
| 343 | Agoura Hills | 20,362 | 20,328 | 0.2% | |||||
| 344 | La Crescenta-Montrose | 20,149 | 19,927 | 1.1% | |||||
| 345 | East Hemet | 19,998 | 19,962 | 0.2% | |||||
| 346 | Imperial | 19,982 | 13,406 | 49.1% | |||||
| 347 | Albany | 19,958 | 17,921 | 11.4% | |||||
| 348 | Shafter | 19,897 | 16,378 | 21.5% | |||||
| 349 | Prunedale | 19,893 | 19,044 | 4.5% | |||||
| 350 | South El Monte | 19,860 | 20,240 | -1.9% | |||||
| 351 | Casa De Oro-Mount Helix | 19,804 | 19,118 | 3.6% | |||||
| 352 | Hermosa Beach | 19,787 | 19,355 | 2.2% | |||||
| 353 | South San Jose Hills | 19,750 | 21,379 | -7.6% | |||||
| 354 | Arvin | 19,568 | 18,329 | 6.8% | |||||
| 355 | Valle Vista | 19,550 | 13,957 | 40.1% | |||||
| 356 | Stevenson Ranch | 19,518 | 16,934 | 15.3% | |||||
| 357 | Orinda | 19,497 | 17,485 | 11.5% | |||||
| 358 | Pinole | 19,065 | 18,461 | 3.3% | |||||
| 359 | Arcata | 19,038 | 17,100 | 11.3% | |||||
| 360 | Dixon | 19,038 | 17,924 | 6.2% | |||||
| 361 | Rosedale | 18,875 | 14,847 | 27.1% | |||||
| 362 | Greenfield | 18,833 | 15,480 | 21.7% | |||||
| 363 | Chowchilla | 18,826 | 18,090 | 4.1% | |||||
| 364 | Santa Fe Springs | 18,817 | 16,376 | 14.9% | |||||
| 365 | Phelan | 18,599 | 14,016 | 32.7% | |||||
| 366 | Nipomo | 18,440 | 16,179 | 14.0% | |||||
| 367 | Arroyo Grande | 18,422 | 16,990 | 8.4% | |||||
| 368 | Blythe | 18,125 | 21,164 | -14.4% | |||||
| 369 | Bostonia | 18,074 | 14,515 | 24.5% | |||||
| 370 | Castaic | 18,017 | 18,134 | -0.6% | |||||
| 371 | Cameron Park | 17,790 | 17,211 | 3.4% | |||||
| 372 | Coalinga | 17,560 | 13,086 | 34.2% | |||||
| 373 | Laguna Woods | 17,546 | 16,295 | 7.7% | |||||
| 374 | Woodcrest | 17,492 | 14,296 | 22.4% | |||||
| 375 | El Segundo | 17,243 | 16,534 | 4.3% | |||||
| 376 | Rio Linda | 17,181 | 14,695 | 16.9% | |||||
| 377 | Rancho Mirage | 17,129 | 16,726 | 2.4% | |||||
| 378 | Live Oak | 16,948 | 16,439 | 3.1% | |||||
| 379 | Truckee | 16,850 | 15,864 | 6.2% | |||||
| 380 | Moraga | 16,750 | 15,975 | 4.9% | |||||
| 381 | Ukiah | 16,728 | 15,942 | 4.9% | |||||
| 382 | Clearlake | 16,468 | 15,074 | 9.2% | |||||
| 383 | Mckinleyville | 16,457 | 16,896 | -2.6% | |||||
| 384 | Walnut Park | 16,453 | 16,686 | -1.4% | |||||
| 385 | Vincent | 16,399 | 16,204 | 1.2% | |||||
| 386 | Artesia | 16,390 | 16,476 | -0.5% | |||||
| 387 | Fillmore | 16,373 | 14,721 | 11.2% | |||||
| 388 | Stanford | 16,333 | 14,256 | 14.6% | |||||
| 389 | Susanville | 16,305 | 17,460 | -6.6% | |||||
| 390 | Olivehurst | 16,262 | 13,298 | 22.3% | |||||
| 391 | Parkway | 16,091 | 14,153 | 13.7% | |||||
| 392 | Ripon | 15,961 | 13,792 | 15.7% | |||||
| 393 | Coto De Caza | 15,873 | 15,453 | 2.7% | |||||
| 394 | Kerman | 15,817 | 12,708 | 24.5% | |||||
| 395 | Isla Vista | 15,732 | 23,776 | -33.8% | |||||
| 396 | Discovery Bay | 15,704 | 11,438 | 37.3% | |||||
| 397 | Los Osos | 15,692 | 14,924 | 5.1% | |||||
| 398 | La Palma | 15,650 | 15,479 | 1.1% | |||||
| 399 | Alpine | 15,648 | 13,326 | 17.4% | |||||
| 400 | Cherryland | 15,552 | 13,326 | 16.7% | |||||
| 401 | Pacific Grove | 15,169 | 14,902 | 1.8% | |||||
| 402 | Camp Pendleton South | 15,131 | 13,402 | 12.9% | |||||
| 403 | California City | 14,914 | 13,264 | 12.4% | |||||
| 404 | Salida | 14,690 | 14,625 | 0.4% | |||||
| 405 | Parlier | 14,666 | 13,928 | 5.3% | |||||
| 406 | Red Bluff | 14,557 | 13,977 | 4.1% | |||||
| 407 | Lemon Hill | 14,471 | 13,424 | 7.8% | |||||
| 408 | East Rancho Dominguez | 14,462 | 13,599 | 6.3% | |||||
| 409 | North Fair Oaks | 14,360 | 14,270 | 0.6% | |||||
| 410 | North Auburn | 14,307 | 12,561 | 13.9% | |||||
| 411 | Lamont | 14,269 | 15,365 | -7.1% | |||||
| 412 | Mill Valley | 14,240 | 13,702 | 3.9% | |||||
| 413 | Hawaiian Gardens | 14,178 | 14,328 | -1.0% | |||||
| 414 | Mcfarland | 14,085 | 12,302 | 14.5% | |||||
| 415 | Livingston | 14,078 | 12,733 | 10.6% | |||||
| 416 | Avenal | 13,881 | 15,749 | -11.9% | |||||
| 417 | Alamo | 13,852 | 15,177 | -8.7% | |||||
| 418 | Auburn | 13,738 | 13,451 | 2.1% | |||||
| 419 | Oak Park | 13,561 | 14,044 | -3.4% | |||||
| 420 | Grass Valley | 13,550 | 12,765 | 6.1% | |||||
| 421 | King City | 13,419 | 12,399 | 8.2% | |||||
| 422 | Palos Verdes Estates | 13,403 | 13,406 | 0.0% | |||||
| 423 | Tehachapi | 13,346 | 14,080 | -5.2% | |||||
| 424 | Avocado Heights | 13,322 | 15,473 | -13.9% | |||||
| 425 | Carpinteria | 13,289 | 13,122 | 1.3% | |||||
| 426 | Grand Terrace | 13,079 | 12,115 | 8.0% | |||||
| 427 | Solana Beach | 13,025 | 12,790 | 1.8% | |||||
| 428 | Larkspur | 12,972 | 11,804 | 9.9% | |||||
| 429 | Bonita | 12,970 | 14,065 | -7.8% | |||||
| 430 | Sun Village | 12,961 | 10,692 | 21.2% | |||||
| 431 | Big Bear City | 12,913 | 11,937 | 8.2% | |||||
| 432 | Home Gardens | 12,910 | 10,947 | 17.9% | |||||
| 433 | Grover Beach | 12,846 | 13,137 | -2.2% | |||||
| 434 | San Anselmo | 12,795 | 12,203 | 4.9% | |||||
| 435 | Emeryville | 12,747 | 9,393 | 35.7% | |||||
| 436 | San Marino | 12,620 | 13,114 | -3.8% | |||||
| 437 | Lindsay | 12,551 | 11,528 | 8.9% | |||||
| 438 | Tamalpais-Homestead Valley | 12,535 | 10,601 | 18.2% | |||||
| 439 | Mendota | 12,534 | 10,459 | 19.8% | |||||
| 440 | Lake Los Angeles | 12,497 | 12,506 | -0.1% | |||||
| 441 | Fortuna | 12,480 | 11,646 | 7.2% | |||||
| 442 | Commerce | 12,459 | 12,758 | -2.3% | |||||
| 443 | Lakeland Village | 12,455 | 12,125 | 2.7% | |||||
| 444 | Marysville | 12,451 | 12,295 | 1.3% | |||||
| 445 | Kingsburg | 12,413 | 11,041 | 12.4% | |||||
| 446 | Scotts Valley | 12,317 | 11,351 | 8.5% | |||||
| 447 | Alum Rock | 12,218 | 16,049 | -23.9% | |||||
| 448 | Newman | 12,154 | 9,806 | 23.9% | |||||
| 449 | Rossmoor | 11,822 | 10,492 | 12.7% | |||||
| 450 | Half Moon Bay | 11,792 | 11,126 | 6.0% | |||||
| 451 | Signal Hill | 11,780 | 10,700 | 10.1% | |||||
| 452 | Los Alamitos | 11,780 | 11,414 | 3.2% | |||||
| 453 | La Riviera | 11,723 | 11,148 | 5.2% | |||||
| 454 | Winton | 11,623 | 11,103 | 4.7% | |||||
| 455 | Diamond Springs | 11,545 | 11,327 | 1.9% | |||||
| 456 | Healdsburg | 11,439 | 11,082 | 3.2% | |||||
| 457 | Valley Center | 11,435 | 9,022 | 26.7% | |||||
| 458 | Hillsborough | 11,390 | 10,650 | 6.9% | |||||
| 459 | Piedmont | 11,368 | 10,573 | 7.5% | |||||
| 460 | View Park-Windsor Hills | 11,313 | 10,768 | 5.1% | |||||
| 461 | Sierra Madre | 11,253 | 10,854 | 3.7% | |||||
| 462 | Anderson | 11,208 | 9,910 | 13.1% | |||||
| 463 | Clayton | 11,136 | 10,819 | 2.9% | |||||
| 464 | Canyon Lake | 11,071 | 10,618 | 4.3% | |||||
| 465 | Fairview | 11,050 | 9,812 | 12.6% | |||||
| 466 | Muscoy | 10,925 | 11,294 | -3.3% | |||||
| 467 | Delhi | 10,921 | 10,481 | 4.2% | |||||
| 468 | Malibu | 10,915 | 12,794 | -14.7% | |||||
| 469 | Blackhawk | 10,874 | 9,607 | 13.2% | |||||
| 470 | Sonoma | 10,819 | 10,292 | 5.1% | |||||
| 471 | Soquel | 10,806 | 9,392 | 15.1% | |||||
| 472 | Morro Bay | 10,785 | 10,255 | 5.2% | |||||
| 473 | Placerville | 10,777 | 10,384 | 3.8% | |||||
| 474 | Citrus | 10,626 | 10,108 | 5.1% | |||||
| 475 | Del Aire | 10,617 | 9,582 | 10.8% | |||||
| 476 | Magalia | 10,537 | 11,640 | -9.5% | |||||
| 477 | Farmersville | 10,441 | 10,283 | 1.5% | |||||
| 478 | Garden Acres | 10,411 | 10,471 | -0.6% | |||||
| 479 | Shasta Lake | 10,399 | 10,081 | 3.2% | |||||
| 480 | San Diego Country Estates | 10,366 | 10,657 | -2.7% | |||||
| 481 | Exeter | 10,349 | 10,139 | 2.1% | |||||
| 482 | Corte Madera | 10,145 | 9,110 | 11.4% | |||||
| 483 | Madera Acres | 10,106 | 9,065 | 11.5% | |||||
| 484 | Quartz Hill | 10,079 | 10,398 | -3.1% | |||||
| 485 | Calimesa | 10,053 | 7,869 | 27.8% | |||||
| 486 | Golden Hills | 10,051 | 8,574 | 17.2% | |||||
| 487 | Capitola | 10,041 | 9,801 | 2.4% | |||||
| 488 | East Whittier | 9,995 | 0 | nan% | |||||
| 489 | Rio Vista | 9,850 | 6,874 | 43.3% | |||||
| 490 | August | 9,829 | 8,332 | 18.0% | |||||
| 491 | Charter Oak | 9,825 | 9,298 | 5.7% | |||||
| 492 | Mentone | 9,708 | 8,854 | 9.6% | |||||
| 493 | Orange Cove | 9,680 | 8,718 | 11.0% | |||||
| 494 | Country Club | 9,667 | 8,819 | 9.6% | |||||
| 495 | Lake Arrowhead | 9,647 | 9,578 | 0.7% | |||||
| 496 | West Athens | 9,621 | 8,307 | 15.8% | |||||
| 497 | Rodeo | 9,575 | 9,127 | 4.9% | |||||
| 498 | Marina Del Rey | 9,355 | 9,196 | 1.7% | |||||
| 499 | Crestline | 9,350 | 8,936 | 4.6% | |||||
| 500 | Rio Del Mar | 9,264 | 9,422 | -1.7% | |||||