
Cities with highest divorce rate in Montana research summary. We used Saturday Night Science to analyze Montana’s most recent Census data to determine the divorce rate for each city in Montana based on the percentage of currently divorced residents. Here are the results of our analysis:
-
The city with the highest divorce rate in Montana is Deer Lodge based on the most recent Census data.
-
Deer Lodge is 17.0% Divorced.
-
The city with the lowest divorce rate in Montana is West Yellowstone.
-
West Yellowstone is 0.0% Divorced.
-
Montana is 6.0% Divorced.
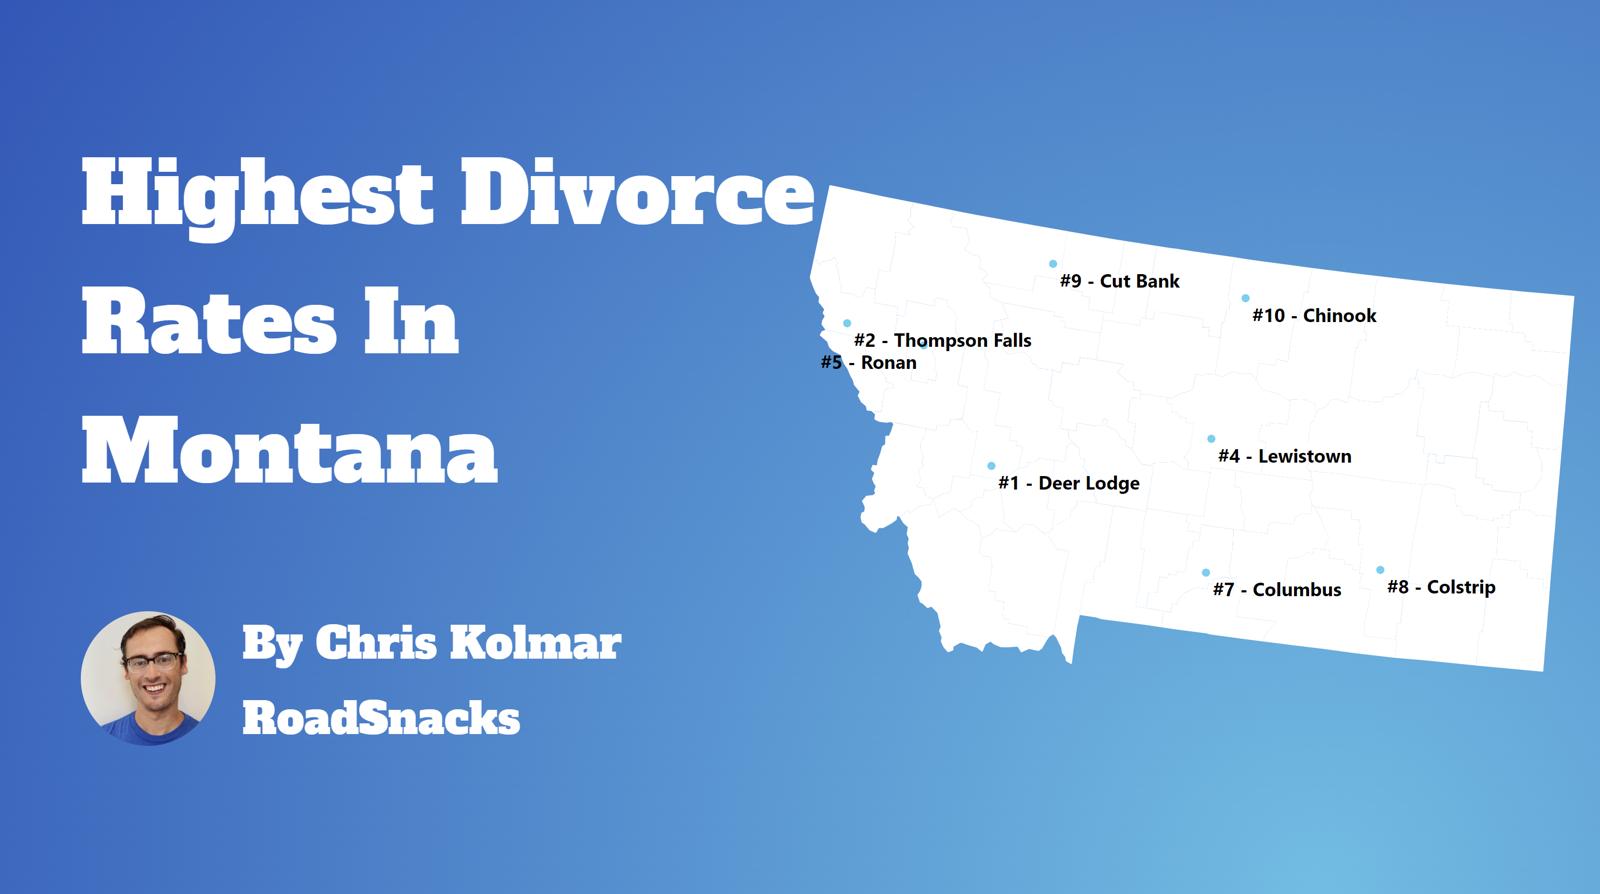
Table Of Contents: Top Ten | Methodology | Summary | Table
There are some 53,043 people living in Montana over fifteen years of age who are divorced. You can compare that to the 28,339,199 Americans who are currently divorced in 2025.
Many people decide to run away – or split up – across the Treasure State.
Isn’t the divorce rate in America close to 50%? Yes indeed. But we’re measuring something else; we are looking at counts and percentages of people over 15 years old who are currently divorced. That 50% statistic is for the percentage of people who have ever been divorced.
For today’s analysis, the focus will be on the number of currently divorced people.
So now that we have you biting your nails, rethinking your worldview, and pulling out your hair, let’s look at the places in Montana with the highest rates of divorcees.
The 10 Cities In Montana With The Highest Divorce Rates
Let’s quickly recap before we dive into the Saturday Night Science behind the data.
What is the city in Montana with the highest divorce rate? That would be Deer Lodge, with 17.0% of people over 15 years of age being divorced, per the most recent census data.
What is the overall Montana divorce rate? According to the 2019-2023 Community Survey, the overall divorce rate in Montana is 6.0%, which compares to the US divorce rate of 10.9%.
Alrighty, on to how we calculated the places with the highest divorce rates in Montana.
For more Montana reading, check out:
The 10 Places With The Highest Divorce Rate In Montana For 2025
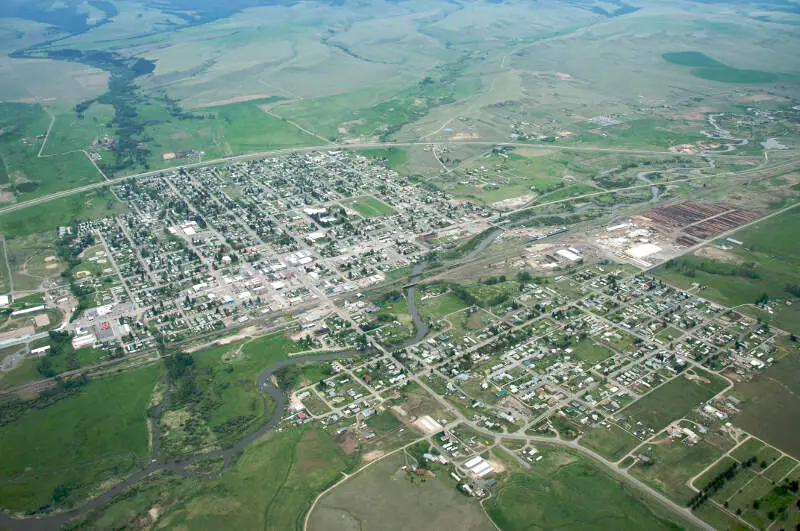
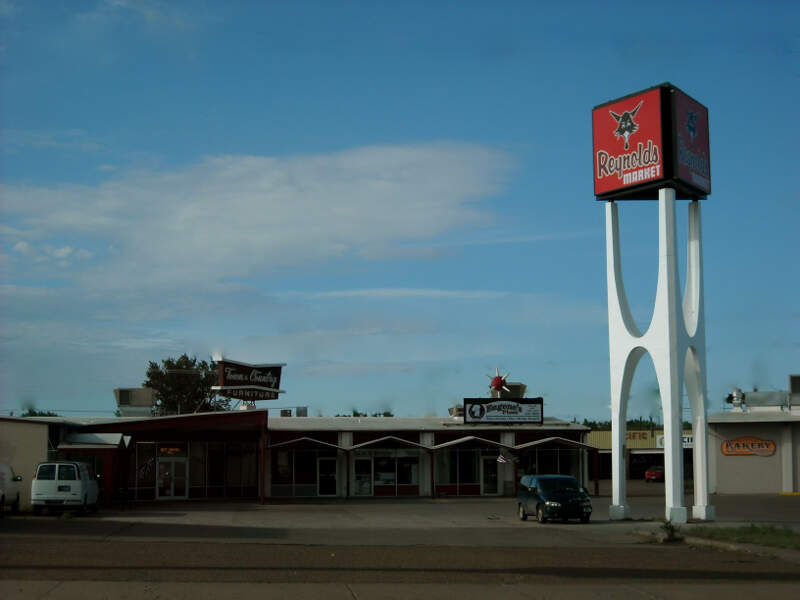
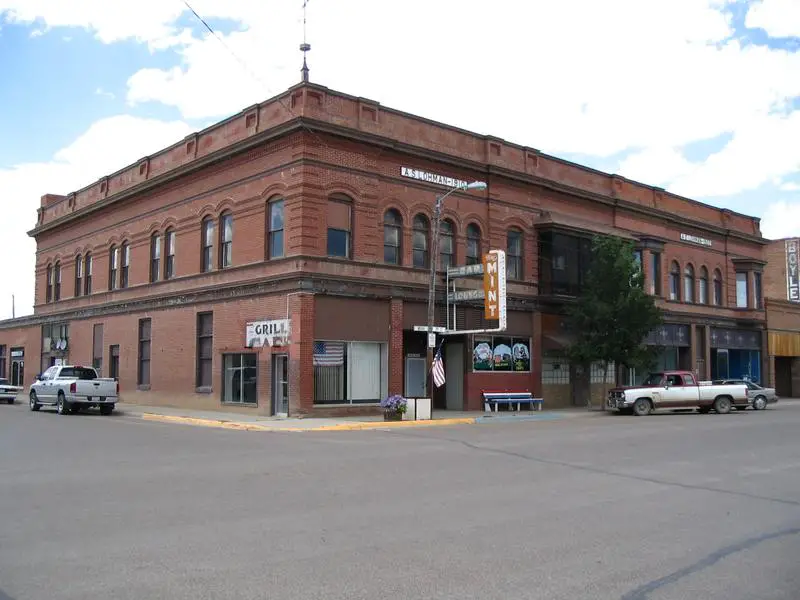
1. Deer Lodge
/10
Population: 3,035
Divorce Rate: 17.0%
Divorcees: 412
Median Income: $53,676
More on Deer Lodge:

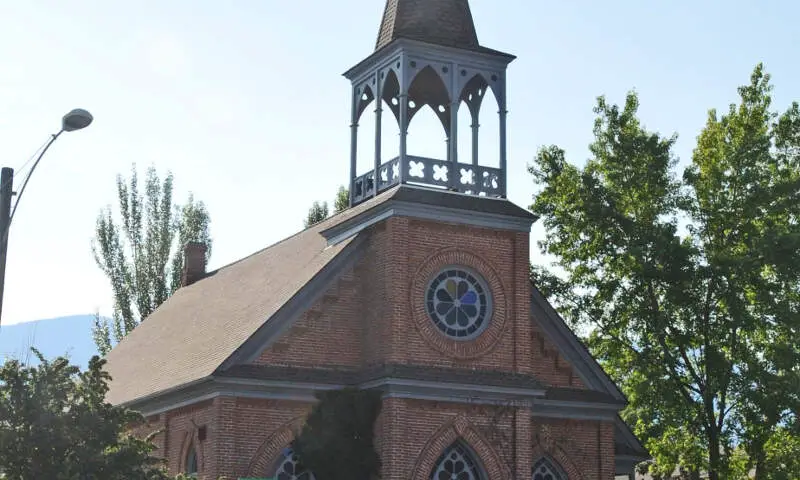
/10
Population: 6,028
Divorce Rate: 14.0%
Divorcees: 675
Median Income: $44,195
More on Lewistown: Data
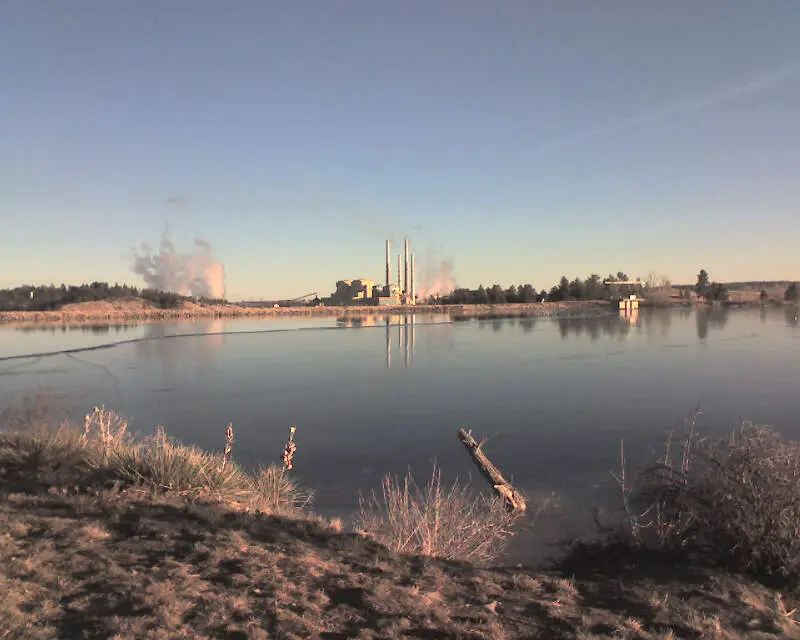
3. Colstrip
/10
Population: 2,156
Divorce Rate: 13.0%
Divorcees: 224
Median Income: $86,000
More on Colstrip:
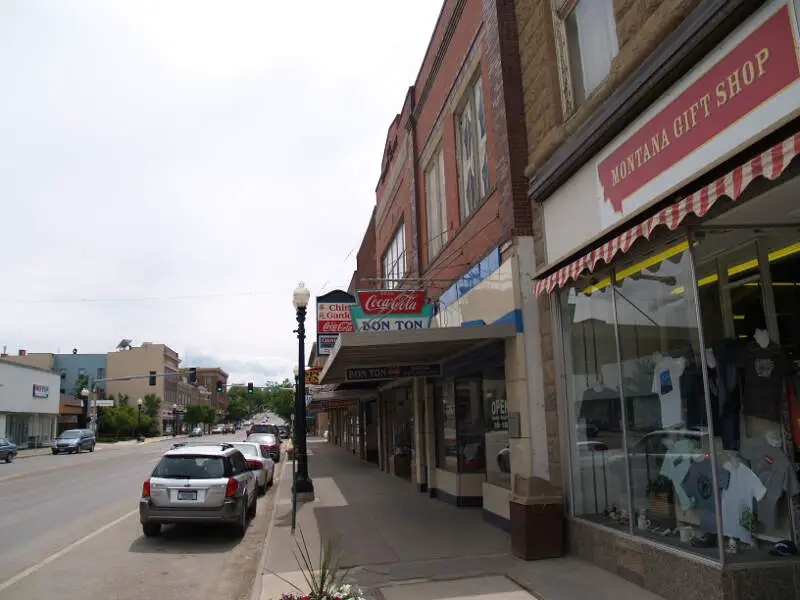
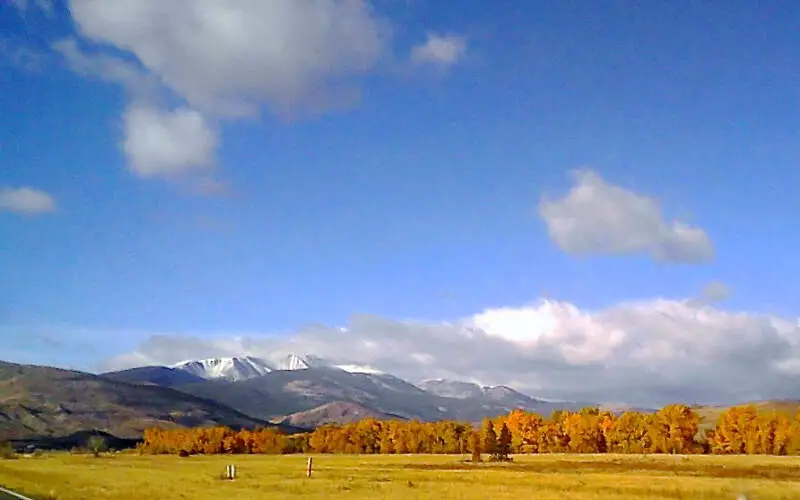
4. White Sulphur Springs
Population: 1,097
Divorce Rate: 12.0%
Divorcees: 105
Median Income: $56,424
More on White Sulphur Springs:
5. Glasgow
/10
Population: 3,194
Divorce Rate: 12.0%
Divorcees: 306
Median Income: $76,985
More on Glasgow:
6. Cut Bank
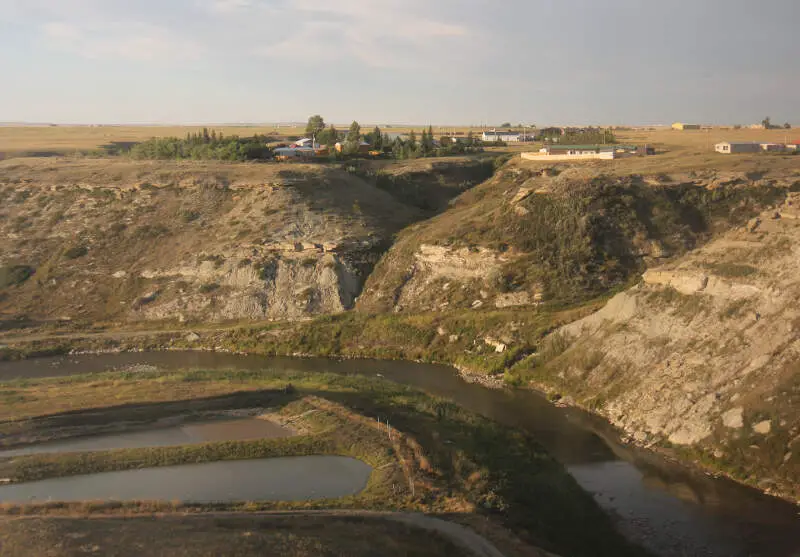
/10
Population: 3,040
Divorce Rate: 12.0%
Divorcees: 291
Median Income: $55,848
More on Cut Bank:
7. Ronan
/10
Population: 1,962
Divorce Rate: 12.0%
Divorcees: 188
Median Income: $41,429
More on Ronan:
/10
Population: 9,512
Divorce Rate: 11.0%
Divorcees: 837
Median Income: $49,533
More on Anaconda-Deer Lodge County: Data
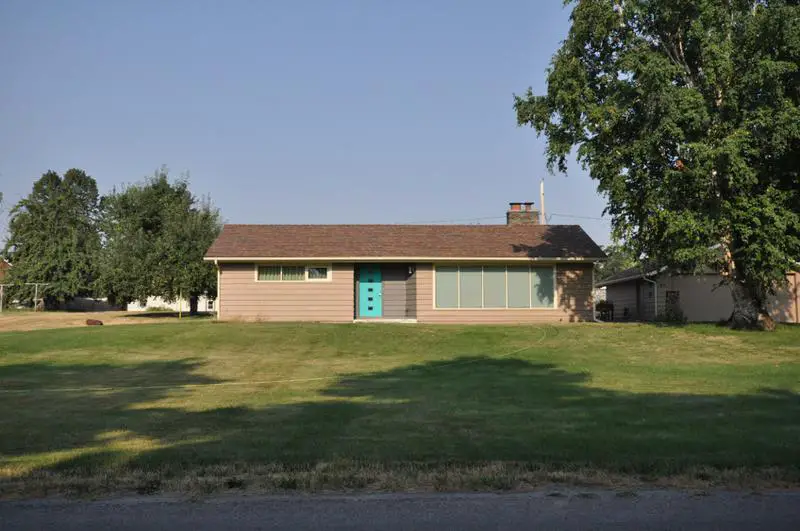
9. Chinook
/10
Population: 1,460
Divorce Rate: 11.0%
Divorcees: 128
Median Income: $71,500
More on Chinook:
10. Columbia Falls
/10
Population: 5,531
Divorce Rate: 11.0%
Divorcees: 486
Median Income: $65,313
More on Columbia Falls:
How We Determined The Places In Montana That Get Un-Hitched The Most
Since this is the 58th category of rankings we are compiling for the site, we had a pretty good idea of where to find data on marriage and divorce in America. We used Saturday Night Science to look at the U.S. Census Bureau on divorce rates. Because who likes tracking misery more than the U.S. government?
Specifically, we looked at the 2019-2023 American Community Survey table S1201 — Marital Status.
Pretty straightforward on that front — we just had to extract the following column of data:
- Population 15 Years and Over -> Divorced
There are some interesting/fun/sad data like .1% of female Americans aged 15-19 are divorced, but 0% of males (That’s probably a rounding issue, but still).
But the national data is for another day. Today, the analysis focuses on the 56 places in Montana with a population of over 1,000.
We ranked each place by the percentage of divorcees over 15 years of age from highest to lowest. We crowned the divorce capital of Montana the place with the highest incidence of divorcees, Deer Lodge.
And if you’re trying to avoid divorce, check out West Yellowstone, the city with the lowest divorce rate in Montana.
We updated this article for 2025 and this list is our fifth time ranking the cities in Montana with the highest divorce rates.
Getting Some Closure In Montana After Untying The Know
Besides just coming up with what we thought would be a great new blog/book title, “Untying the Knot In Montana: Life After Divorce,” we now have a sense of what places in the Treasure State don’t pay much attention to the whole “’til death do we part” phrase.
The cities with the highest divorce rate in Montana are Deer Lodge, Lewistown, Colstrip, White Sulphur Springs, Glasgow, Cut Bank, Ronan, Anaconda-Deer Lodge County, Chinook, and Columbia Falls.
Try to keep in mind that the reason cities rank where they do in Montana could be because of the age, education, and income distribution, as all of those things impact the rate of divorce.
And that’s probably for the best. Getting out of a toxic relationship is much better than staying in it.
Just make sure you have your running shoes ready to go.
For more Montana reading, check out:
Cities With The Highest Divorce Rates In Montana
| Rank | City | Population | Divorcees | Divorce Rate |
|---|---|---|---|---|
| 1 | Deer Lodge, MT | 3,035 | 412 | 17.0% |
| 2 | Lewistown, MT | 6,028 | 675 | 14.0% |
| 3 | Colstrip, MT | 2,156 | 224 | 13.0% |
| 4 | White Sulphur Springs, MT | 1,097 | 105 | 12.0% |
| 5 | Glasgow, MT | 3,194 | 306 | 12.0% |
| 6 | Cut Bank, MT | 3,040 | 291 | 12.0% |
| 7 | Ronan, MT | 1,962 | 188 | 12.0% |
| 8 | Anaconda-Deer Lodge County, MT | 9,512 | 837 | 11.0% |
| 9 | Chinook, MT | 1,460 | 128 | 11.0% |
| 10 | Columbia Falls, MT | 5,531 | 486 | 11.0% |
| 11 | Havre, MT | 9,333 | 746 | 10.0% |
| 12 | Thompson Falls, MT | 1,568 | 125 | 10.0% |
| 13 | Columbus, MT | 1,925 | 138 | 9.0% |
| 14 | Eureka, MT | 2,009 | 144 | 9.0% |
| 15 | Boulder, MT | 1,326 | 84 | 8.0% |
| 16 | Billings, MT | 118,321 | 7,572 | 8.0% |
| 17 | Miles City, MT | 8,412 | 538 | 8.0% |
| 18 | Malta, MT | 1,902 | 121 | 8.0% |
| 19 | Townsend, MT | 2,232 | 142 | 8.0% |
| 20 | Great Falls, MT | 60,412 | 3,866 | 8.0% |
| 21 | Conrad, MT | 2,553 | 163 | 8.0% |
| 22 | Whitehall, MT | 1,151 | 64 | 7.0% |
| 23 | Plains, MT | 1,077 | 60 | 7.0% |
| 24 | Laurel, MT | 7,198 | 403 | 7.0% |
| 25 | Plentywood, MT | 1,677 | 93 | 7.0% |
| 26 | Helena, MT | 33,126 | 1,855 | 7.0% |
| 27 | Wolf Point, MT | 2,604 | 145 | 7.0% |
| 28 | Baker, MT | 1,535 | 73 | 6.0% |
| 29 | St. Ignatius, MT | 1,053 | 50 | 6.0% |
| 30 | Sidney, MT | 6,235 | 299 | 6.0% |
| 31 | Shelby, MT | 3,129 | 150 | 6.0% |
| 32 | Roundup, MT | 1,964 | 94 | 6.0% |
| 33 | Harlowton, MT | 1,054 | 50 | 6.0% |
| 34 | East Helena, MT | 1,855 | 89 | 6.0% |
| 35 | Hardin, MT | 3,766 | 180 | 6.0% |
| 36 | Hamilton, MT | 4,949 | 237 | 6.0% |
| 37 | Kalispell, MT | 26,830 | 1,287 | 6.0% |
| 38 | Libby, MT | 2,948 | 141 | 6.0% |
| 39 | Glendive, MT | 4,831 | 193 | 5.0% |
| 40 | Belgrade, MT | 11,425 | 457 | 5.0% |
| 41 | Fort Benton, MT | 1,470 | 58 | 5.0% |
| 42 | Polson, MT | 5,334 | 213 | 5.0% |
| 43 | Livingston, MT | 8,635 | 345 | 5.0% |
| 44 | Choteau, MT | 1,719 | 68 | 5.0% |
| 45 | Missoula, MT | 75,600 | 3,024 | 5.0% |
| 46 | Red Lodge, MT | 2,399 | 95 | 5.0% |
| 47 | Manhattan, MT | 2,149 | 68 | 4.0% |
| 48 | Dillon, MT | 4,020 | 128 | 4.0% |
| 49 | Whitefish, MT | 8,422 | 269 | 4.0% |
| 50 | Three Forks, MT | 2,034 | 48 | 3.0% |
| 51 | Philipsburg, MT | 1,012 | 24 | 3.0% |
| 52 | Bozeman, MT | 55,042 | 880 | 2.0% |
| 53 | Stevensville, MT | 2,172 | 34 | 2.0% |
| 54 | Big Timber, MT | 1,530 | 24 | 2.0% |
| 55 | Forsyth, MT | 1,682 | 26 | 2.0% |
| 56 | West Yellowstone, MT | 1,457 | 0 | 0.0% |