
Cities with highest divorce rate in New York research summary. We used Saturday Night Science to analyze New York’s most recent Census data to determine the divorce rate for each city in New York based on the percentage of currently divorced residents. Here are the results of our analysis:
-
The city with the highest divorce rate in New York is Hudson Falls based on the most recent Census data.
-
Hudson Falls is 19.0% Divorced.
-
The city with the lowest divorce rate in New York is New Square.
-
New Square is 0.0% Divorced.
-
New York is 5.0% Divorced.
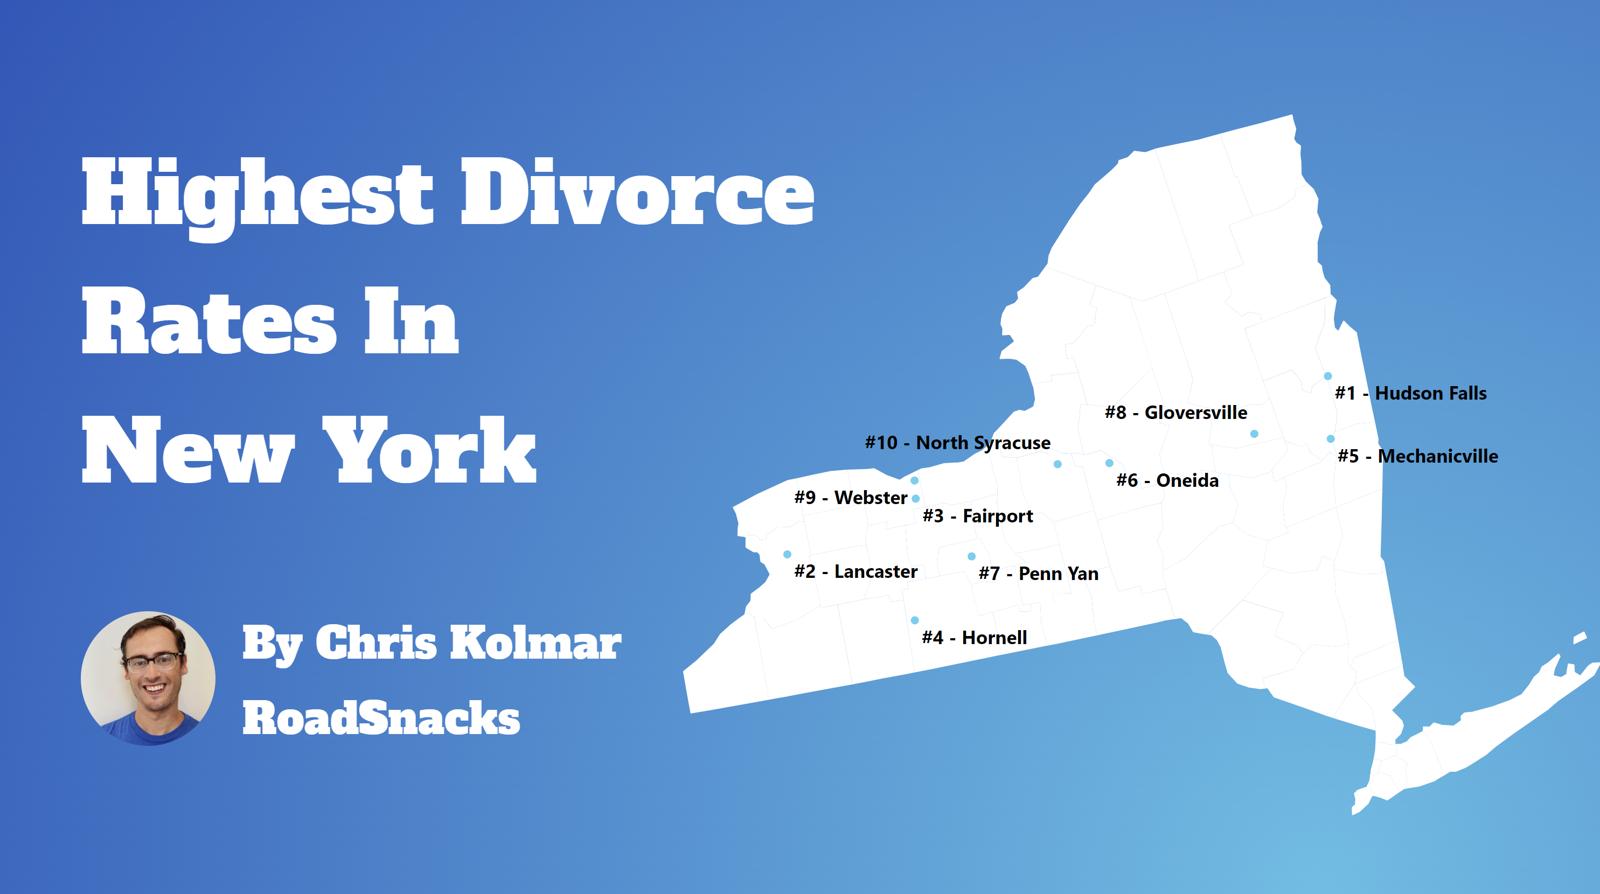
Table Of Contents: Top Ten | Methodology | Summary | Table
There are some 794,892 people living in New York over fifteen years of age who are divorced. You can compare that to the 28,339,199 Americans who are currently divorced in 2025.
Many people decide to run away – or split up – across the Empire State.
Isn’t the divorce rate in America close to 50%? Yes indeed. But we’re measuring something else; we are looking at counts and percentages of people over 15 years old who are currently divorced. That 50% statistic is for the percentage of people who have ever been divorced.
For today’s analysis, the focus will be on the number of currently divorced people.
So now that we have you biting your nails, rethinking your worldview, and pulling out your hair, let’s look at the places in New York with the highest rates of divorcees.
The 10 Cities In New York With The Highest Divorce Rates
Let’s quickly recap before we dive into the Saturday Night Science behind the data.
What is the city in New York with the highest divorce rate? That would be Hudson Falls, with 19.0% of people over 15 years of age being divorced, per the most recent census data.
What is the overall New York divorce rate? According to the 2019-2023 Community Survey, the overall divorce rate in New York is 5.0%, which compares to the US divorce rate of 10.9%.
Alrighty, on to how we calculated the places with the highest divorce rates in New York.
For more New York reading, check out:
- Richest Cities In New York
- Safest Places In New York According To Science
- Best Places To Raise A Family In New York
The 10 Places With The Highest Divorce Rate In New York For 2025

/10
Population: 7,401
Divorce Rate: 19.0%
Divorcees: 1,124
Median Income: $62,237
More on Hudson Falls: Data

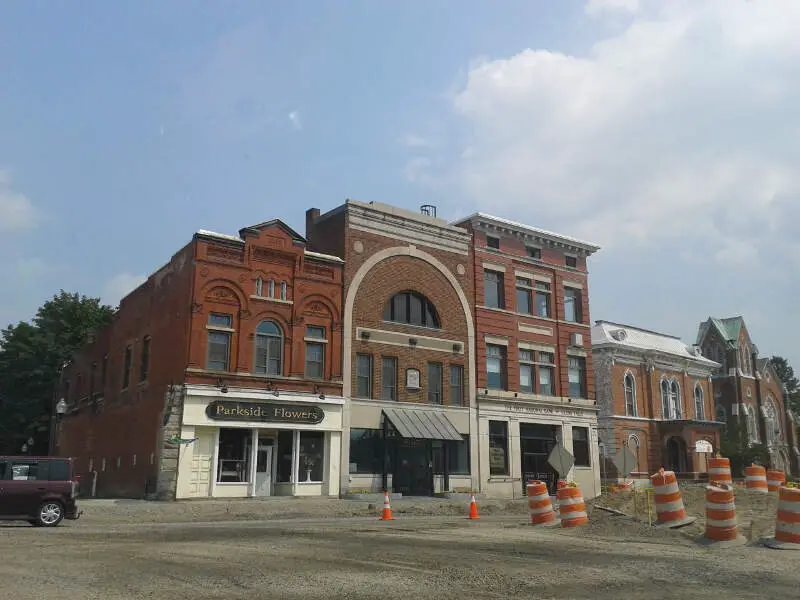
/10
Population: 10,127
Divorce Rate: 17.0%
Divorcees: 1,377
Median Income: $63,902
More on Lancaster: Data

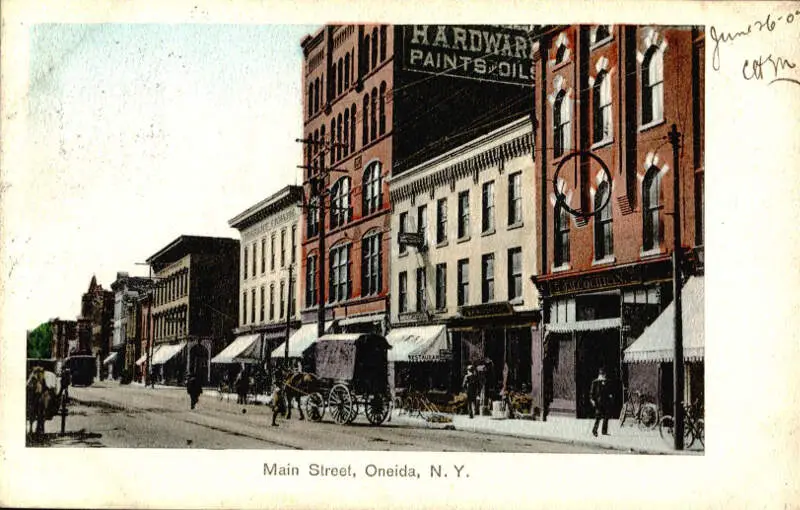
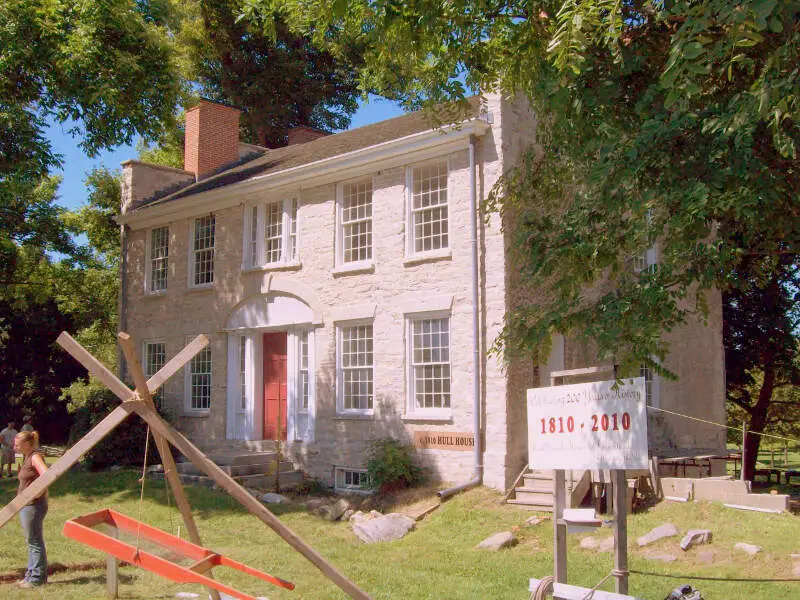
/10
Population: 10,240
Divorce Rate: 15.0%
Divorcees: 1,228
Median Income: $60,380
More on Oneida: Data

/10
Population: 8,173
Divorce Rate: 14.0%
Divorcees: 915
Median Income: $46,321
More on Hornell: Data
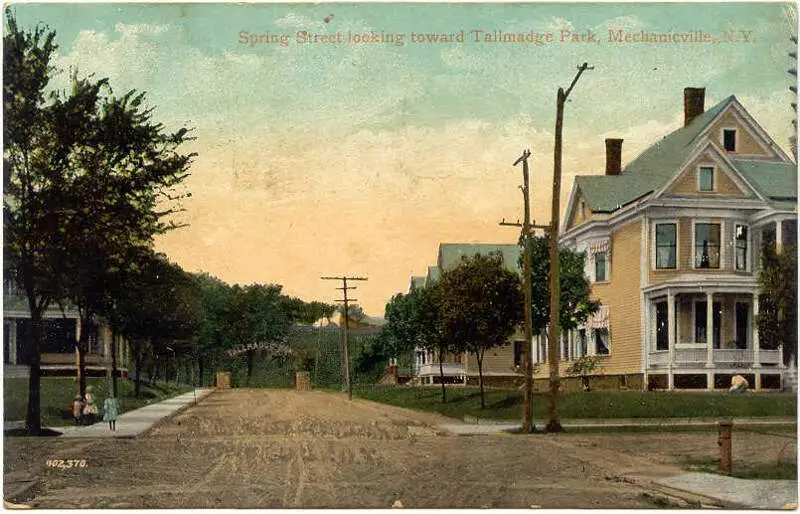
/10
Population: 5,143
Divorce Rate: 14.0%
Divorcees: 576
Median Income: $47,331
More on Mechanicville: Data

/10
Population: 15,010
Divorce Rate: 14.0%
Divorcees: 1,681
Median Income: $49,155
More on Gloversville: Data

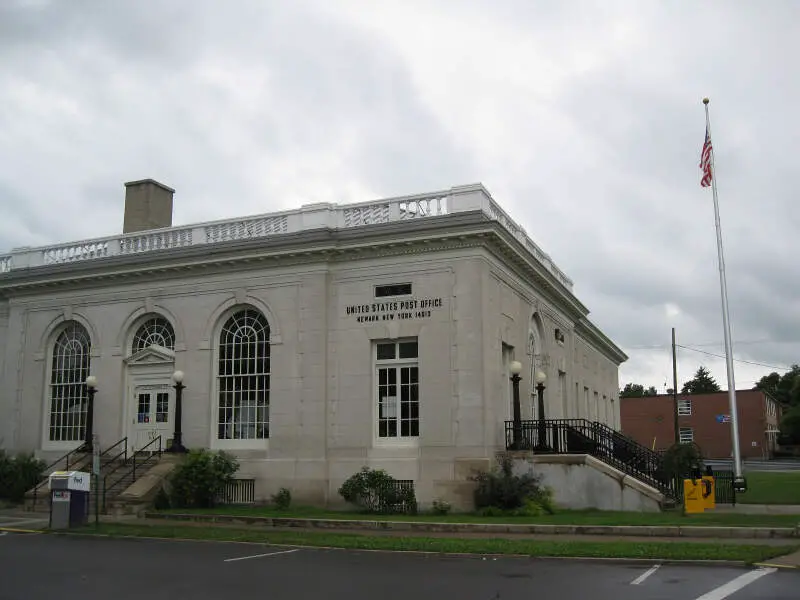
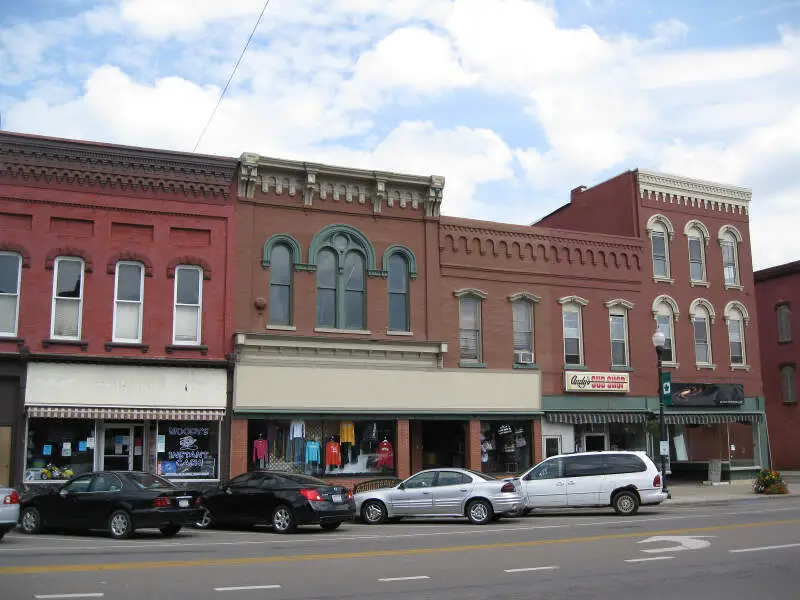
/10
Population: 9,040
Divorce Rate: 13.0%
Divorcees: 940
Median Income: $58,096
More on Newark: Data

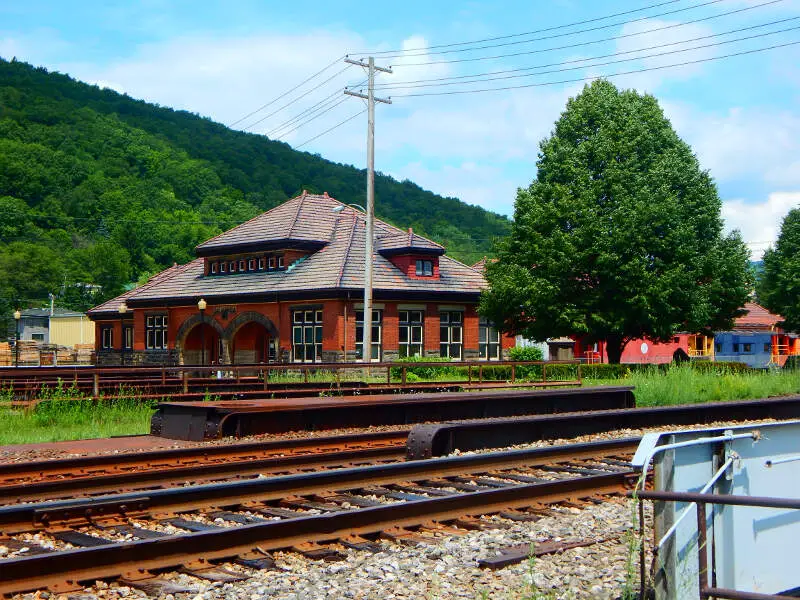
/10
Population: 5,878
Divorce Rate: 13.0%
Divorcees: 611
Median Income: $39,871
More on Salamanca: Data

/10
Population: 5,799
Divorce Rate: 13.0%
Divorcees: 603
Median Income: $63,972
More on Medina: Data

/10
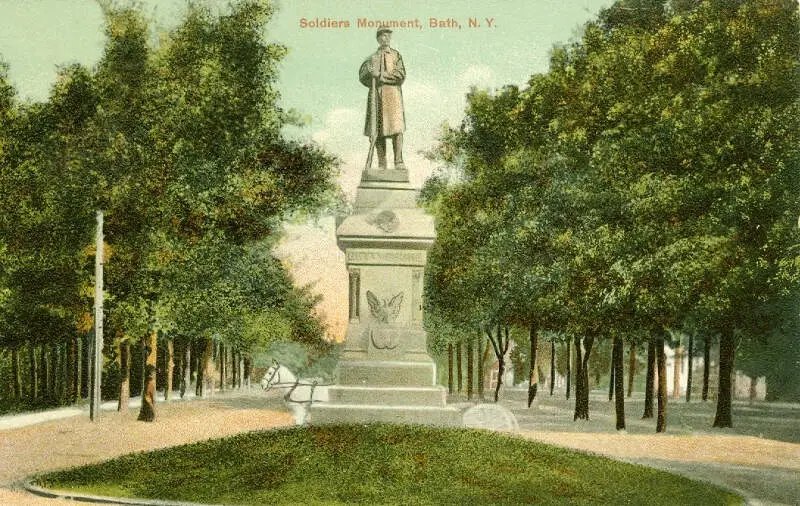
Population: 5,595
Divorce Rate: 13.0%
Divorcees: 581
Median Income: $45,514
More on Bath: Data
How We Determined The Places In New York That Get Un-Hitched The Most
Since this is the 58th category of rankings we are compiling for the site, we had a pretty good idea of where to find data on marriage and divorce in America. We used Saturday Night Science to look at the U.S. Census Bureau on divorce rates. Because who likes tracking misery more than the U.S. government?
Specifically, we looked at the 2019-2023 American Community Survey table S1201 — Marital Status.
Pretty straightforward on that front — we just had to extract the following column of data:
- Population 15 Years and Over -> Divorced
There are some interesting/fun/sad data like .1% of female Americans aged 15-19 are divorced, but 0% of males (That’s probably a rounding issue, but still).
But the national data is for another day. Today, the analysis focuses on the 170 places in New York with a population of over 5,000.
We ranked each place by the percentage of divorcees over 15 years of age from highest to lowest. We crowned the divorce capital of New York the place with the highest incidence of divorcees, Hudson Falls.
And if you’re trying to avoid divorce, check out New Square, the city with the lowest divorce rate in New York.
We updated this article for 2025 and this list is our fifth time ranking the cities in New York with the highest divorce rates.
Getting Some Closure In New York After Untying The Know
Besides just coming up with what we thought would be a great new blog/book title, “Untying the Knot In New York: Life After Divorce,” we now have a sense of what places in the Empire State don’t pay much attention to the whole “’til death do we part” phrase.
The cities with the highest divorce rate in New York are Hudson Falls, Lancaster, Oneida, Hornell, Mechanicville, Gloversville, Newark, Salamanca, Medina, and Bath.
Try to keep in mind that the reason cities rank where they do in New York could be because of the age, education, and income distribution, as all of those things impact the rate of divorce.
And that’s probably for the best. Getting out of a toxic relationship is much better than staying in it.
Just make sure you have your running shoes ready to go.
For more New York reading, check out:
- Richest Cities In New York
- Safest Places In New York According To Science
- Best Places To Raise A Family In New York
Cities With The Highest Divorce Rates In New York
| Rank | City | Population | Divorcees | Divorce Rate |
|---|---|---|---|---|
| 1 | Hudson Falls, NY | 7,401 | 1,124 | 19.0% |
| 2 | Lancaster, NY | 10,127 | 1,377 | 17.0% |
| 3 | Oneida, NY | 10,240 | 1,228 | 15.0% |
| 4 | Hornell, NY | 8,173 | 915 | 14.0% |
| 5 | Mechanicville, NY | 5,143 | 576 | 14.0% |
| 6 | Gloversville, NY | 15,010 | 1,681 | 14.0% |
| 7 | Newark, NY | 9,040 | 940 | 13.0% |
| 8 | Salamanca, NY | 5,878 | 611 | 13.0% |
| 9 | Medina, NY | 5,799 | 603 | 13.0% |
| 10 | Bath, NY | 5,595 | 581 | 13.0% |
| 11 | Fairport, NY | 5,436 | 565 | 13.0% |
| 12 | Ballston Spa, NY | 5,080 | 528 | 13.0% |
| 13 | Ogdensburg, NY | 9,600 | 921 | 12.0% |
| 14 | Baldwinsville, NY | 7,732 | 742 | 12.0% |
| 15 | Lackawanna, NY | 19,779 | 1,898 | 12.0% |
| 16 | Williamsville, NY | 5,430 | 521 | 12.0% |
| 17 | Northport, NY | 7,320 | 702 | 12.0% |
| 18 | Jamestown, NY | 28,401 | 2,726 | 12.0% |
| 19 | Johnstown, NY | 8,153 | 782 | 12.0% |
| 20 | Webster, NY | 5,734 | 550 | 12.0% |
| 21 | Fulton, NY | 11,339 | 1,088 | 12.0% |
| 22 | Wappingers Falls, NY | 5,694 | 501 | 11.0% |
| 23 | East Rochester, NY | 6,263 | 551 | 11.0% |
| 24 | Albion, NY | 5,495 | 483 | 11.0% |
| 25 | Watertown, NY | 24,574 | 2,162 | 11.0% |
| 26 | Colonie, NY | 7,705 | 678 | 11.0% |
| 27 | Olean, NY | 13,798 | 1,214 | 11.0% |
| 28 | North Syracuse, NY | 6,727 | 591 | 11.0% |
| 29 | Endicott, NY | 13,456 | 1,184 | 11.0% |
| 30 | Auburn, NY | 26,475 | 2,329 | 11.0% |
| 31 | Batavia, NY | 15,494 | 1,363 | 11.0% |
| 32 | Canandaigua, NY | 10,542 | 927 | 11.0% |
| 33 | Herkimer, NY | 7,335 | 586 | 10.0% |
| 34 | Ilion, NY | 7,636 | 610 | 10.0% |
| 35 | Massena, NY | 10,234 | 818 | 10.0% |
| 36 | Horseheads, NY | 6,494 | 519 | 10.0% |
| 37 | Great Neck Plaza, NY | 7,503 | 600 | 10.0% |
| 38 | Lockport, NY | 20,699 | 1,655 | 10.0% |
| 39 | Glens Falls, NY | 14,678 | 1,174 | 10.0% |
| 40 | Tonawanda, NY | 15,044 | 1,203 | 10.0% |
| 41 | Depew, NY | 15,065 | 1,205 | 10.0% |
| 42 | Kenmore, NY | 15,097 | 1,207 | 10.0% |
| 43 | Rome, NY | 31,795 | 2,543 | 10.0% |
| 44 | Corning, NY | 10,666 | 853 | 10.0% |
| 45 | Cohoes, NY | 18,043 | 1,443 | 10.0% |
| 46 | Niagara Falls, NY | 48,198 | 3,855 | 10.0% |
| 47 | Norwich, NY | 6,880 | 550 | 10.0% |
| 48 | Amsterdam, NY | 18,162 | 1,452 | 10.0% |
| 49 | Oswego, NY | 17,028 | 1,362 | 10.0% |
| 50 | Elmira, NY | 26,349 | 2,107 | 10.0% |
| 51 | Patchogue, NY | 12,368 | 890 | 9.0% |
| 52 | Kingston, NY | 23,942 | 1,723 | 9.0% |
| 53 | Schenectady, NY | 68,521 | 4,933 | 9.0% |
| 54 | Scotia, NY | 7,260 | 522 | 9.0% |
| 55 | Liberty, NY | 5,083 | 365 | 9.0% |
| 56 | Goshen, NY | 5,751 | 414 | 9.0% |
| 57 | North Tonawanda, NY | 30,338 | 2,184 | 9.0% |
| 58 | Cortland, NY | 17,465 | 1,257 | 9.0% |
| 59 | Poughkeepsie, NY | 31,778 | 2,288 | 9.0% |
| 60 | Watervliet, NY | 10,285 | 740 | 9.0% |
| 61 | Dunkirk, NY | 12,597 | 906 | 9.0% |
| 62 | East Aurora, NY | 5,997 | 431 | 9.0% |
| 63 | Tarr, NY | 11,752 | 752 | 8.0% |
| 64 | Babylon, NY | 12,182 | 779 | 8.0% |
| 65 | Long Beach, NY | 34,741 | 2,223 | 8.0% |
| 66 | Binghamton, NY | 47,357 | 3,030 | 8.0% |
| 67 | Buffalo, NY | 276,397 | 17,689 | 8.0% |
| 68 | Warwick, NY | 6,625 | 424 | 8.0% |
| 69 | Solvay, NY | 6,590 | 421 | 8.0% |
| 70 | Port Jefferson, NY | 8,029 | 513 | 8.0% |
| 71 | Port Jervis, NY | 8,709 | 557 | 8.0% |
| 72 | Rensselaer, NY | 9,247 | 591 | 8.0% |
| 73 | Geneva, NY | 12,573 | 804 | 8.0% |
| 74 | Suffern, NY | 11,395 | 729 | 8.0% |
| 75 | Troy, NY | 51,054 | 3,267 | 8.0% |
| 76 | Hamburg, NY | 9,762 | 624 | 8.0% |
| 77 | Farmingdale, NY | 8,450 | 540 | 8.0% |
| 78 | Malone, NY | 5,466 | 306 | 7.0% |
| 79 | Rochester, NY | 209,720 | 11,744 | 7.0% |
| 80 | Mount Kisco, NY | 10,782 | 603 | 7.0% |
| 81 | Lynbrook, NY | 20,251 | 1,134 | 7.0% |
| 82 | Fredonia, NY | 9,601 | 537 | 7.0% |
| 83 | Amityville, NY | 9,513 | 532 | 7.0% |
| 84 | Brockport, NY | 7,153 | 400 | 7.0% |
| 85 | Walden, NY | 6,871 | 384 | 7.0% |
| 86 | Utica, NY | 64,440 | 3,608 | 7.0% |
| 87 | Syracuse, NY | 146,211 | 8,187 | 7.0% |
| 88 | Hilton, NY | 5,990 | 335 | 7.0% |
| 89 | Peekskill, NY | 25,484 | 1,427 | 7.0% |
| 90 | Lake Grove, NY | 11,050 | 618 | 7.0% |
| 91 | Sea Cliff, NY | 5,037 | 282 | 7.0% |
| 92 | Saratoga Springs, NY | 28,542 | 1,598 | 7.0% |
| 93 | Johnson City, NY | 15,130 | 847 | 7.0% |
| 94 | Nyack, NY | 7,469 | 358 | 6.0% |
| 95 | Canton, NY | 7,222 | 346 | 6.0% |
| 96 | Saranac Lake, NY | 5,099 | 244 | 6.0% |
| 97 | Freeport, NY | 44,102 | 2,116 | 6.0% |
| 98 | Beacon, NY | 14,629 | 702 | 6.0% |
| 99 | Plattsburgh, NY | 19,878 | 954 | 6.0% |
| 100 | Bayville, NY | 6,744 | 323 | 6.0% |