
Cities with highest divorce rate in South Carolina research summary. We used Saturday Night Science to analyze South Carolina’s most recent Census data to determine the divorce rate for each city in South Carolina based on the percentage of currently divorced residents. Here are the results of our analysis:
-
The city with the highest divorce rate in South Carolina is Union based on the most recent Census data.
-
Union is 11.0% Divorced.
-
The city with the lowest divorce rate in South Carolina is Tega Cay.
-
Tega Cay is 0.0% Divorced.
-
South Carolina is 5.0% Divorced.
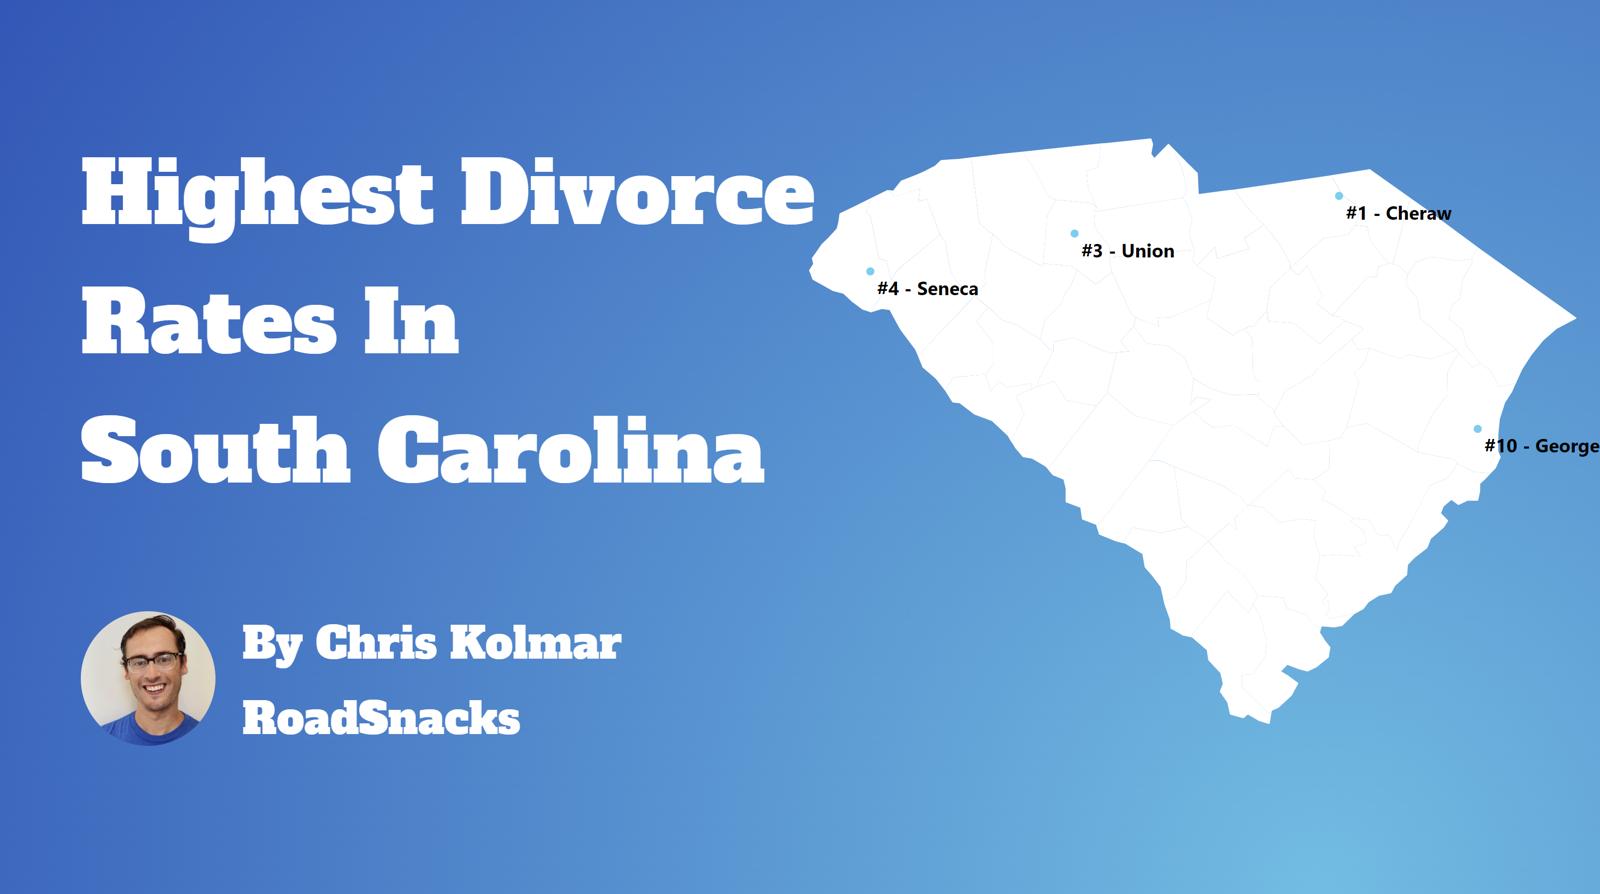
Table Of Contents: Top Ten | Methodology | Summary | Table
There are some 208,510 people living in South Carolina over fifteen years of age who are divorced. You can compare that to the 28,339,199 Americans who are currently divorced in 2025.
Many people decide to run away – or split up – across the Palmetto State.
Isn’t the divorce rate in America close to 50%? Yes indeed. But we’re measuring something else; we are looking at counts and percentages of people over 15 years old who are currently divorced. That 50% statistic is for the percentage of people who have ever been divorced.
For today’s analysis, the focus will be on the number of currently divorced people.
So now that we have you biting your nails, rethinking your worldview, and pulling out your hair, let’s look at the places in South Carolina with the highest rates of divorcees.
The 10 Cities In South Carolina With The Highest Divorce Rates
Let’s quickly recap before we dive into the Saturday Night Science behind the data.
What is the city in South Carolina with the highest divorce rate? That would be Union, with 11.0% of people over 15 years of age being divorced, per the most recent census data.
What is the overall South Carolina divorce rate? According to the 2019-2023 Community Survey, the overall divorce rate in South Carolina is 5.0%, which compares to the US divorce rate of 10.9%.
Alrighty, on to how we calculated the places with the highest divorce rates in South Carolina.
For more South Carolina reading, check out:
- Richest Cities In South Carolina
- Worst Places To Live In South Carolina
- Most Dangerous Cities In South Carolina
The 10 Places With The Highest Divorce Rate In South Carolina For 2025

/10
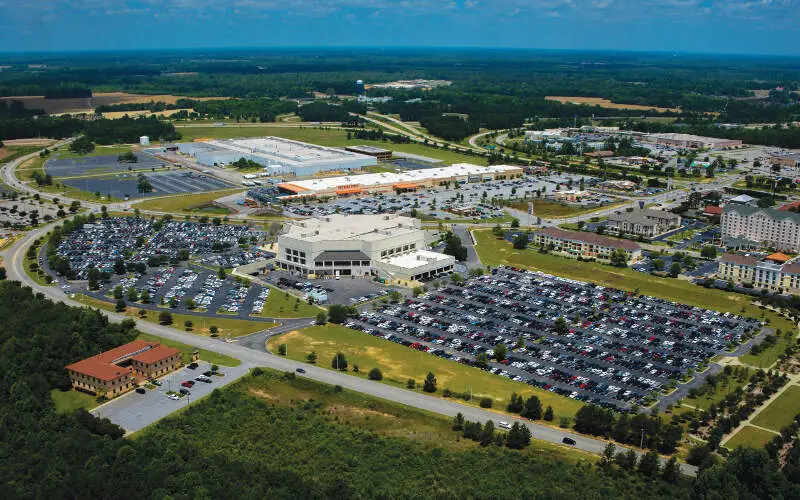
Population: 8,047
Divorce Rate: 11.0%
Divorcees: 708
Median Income: $34,112
More on Union: Data

/10
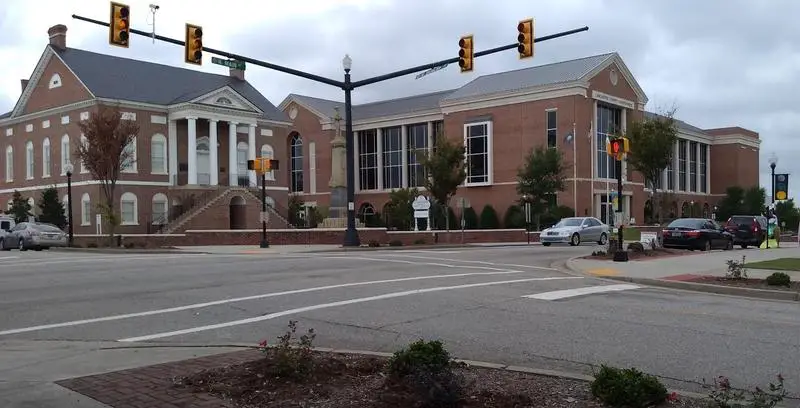
Population: 7,422
Divorce Rate: 9.0%
Divorcees: 534
Median Income: $47,720
More on Hartsville: Data

/10
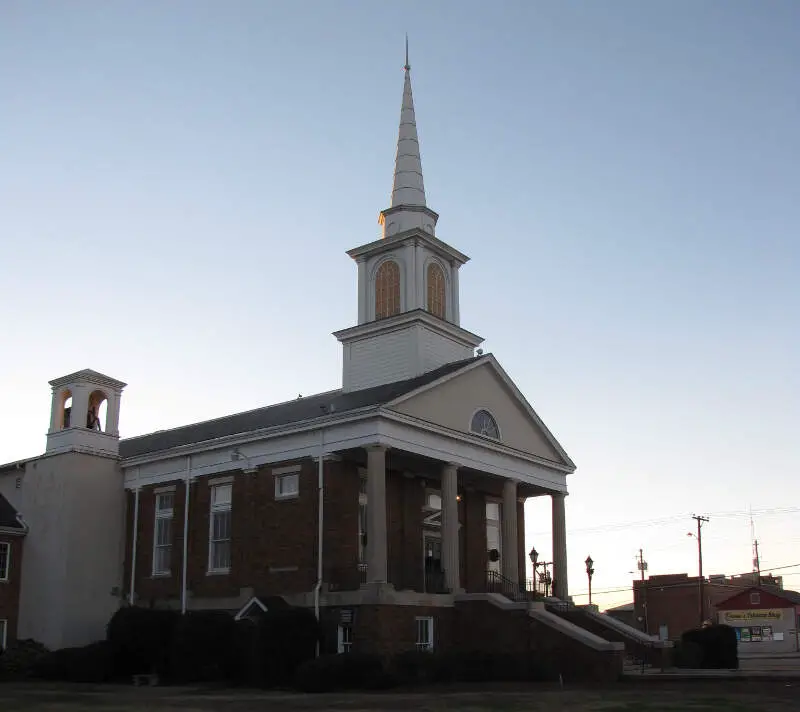
Population: 5,241
Divorce Rate: 9.0%
Divorcees: 377
Median Income: $41,231
More on Chester: Data

/10
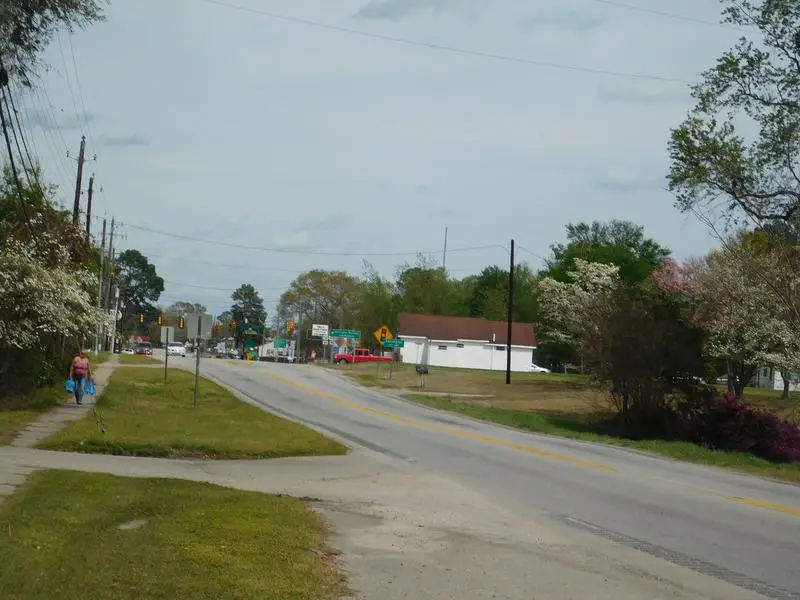
Population: 40,205
Divorce Rate: 9.0%
Divorcees: 2,894
Median Income: $56,433
More on Florence: Data

/10
Population: 8,738
Divorce Rate: 8.0%
Divorcees: 559
Median Income: $43,234
More on Lancaster: Data

/10
Population: 6,406
Divorce Rate: 8.0%
Divorcees: 409
Median Income: $34,964
More on Dillon: Data

/10
Population: 6,128
Divorce Rate: 8.0%
Divorcees: 392
Median Income: $31,240
More on Darlington: Data

/10
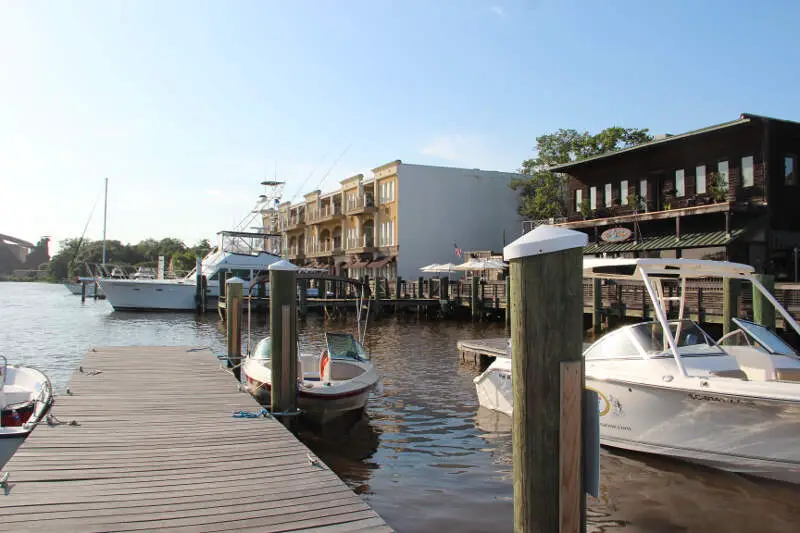
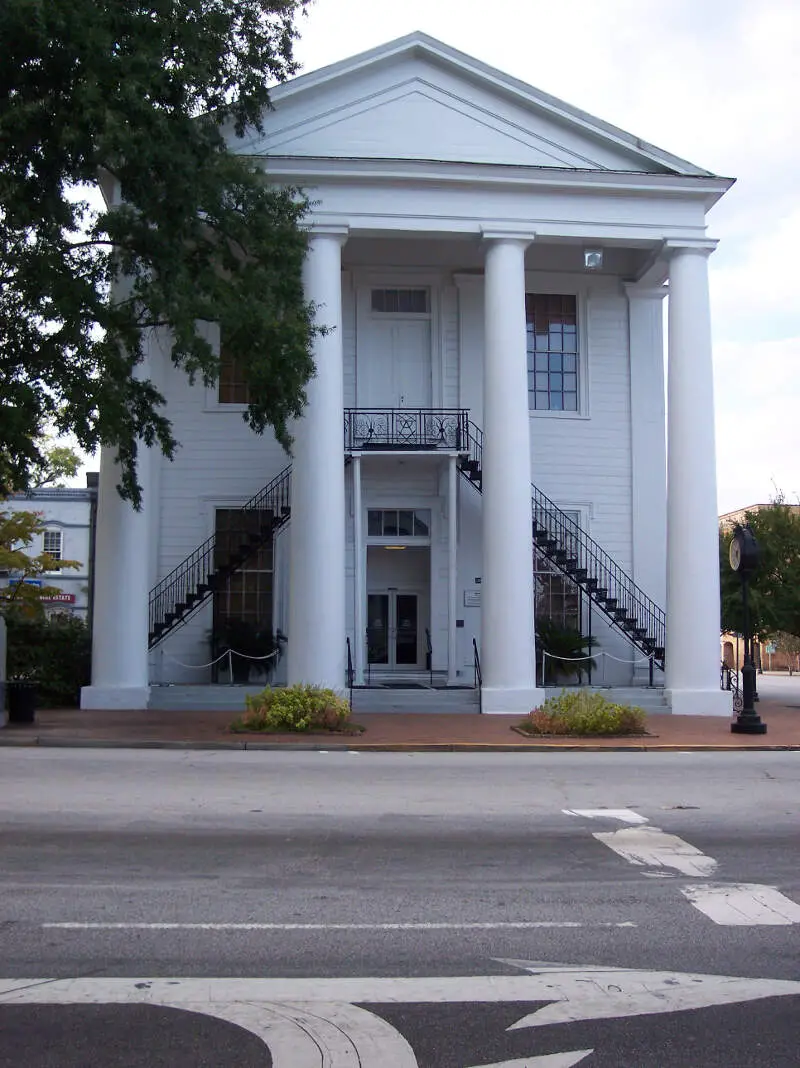
Population: 8,511
Divorce Rate: 8.0%
Divorcees: 544
Median Income: $57,704
More on Georgetown: Data

/10
Population: 5,024
Divorce Rate: 8.0%
Divorcees: 321
Median Income: $27,275
More on Cheraw: Data

/10
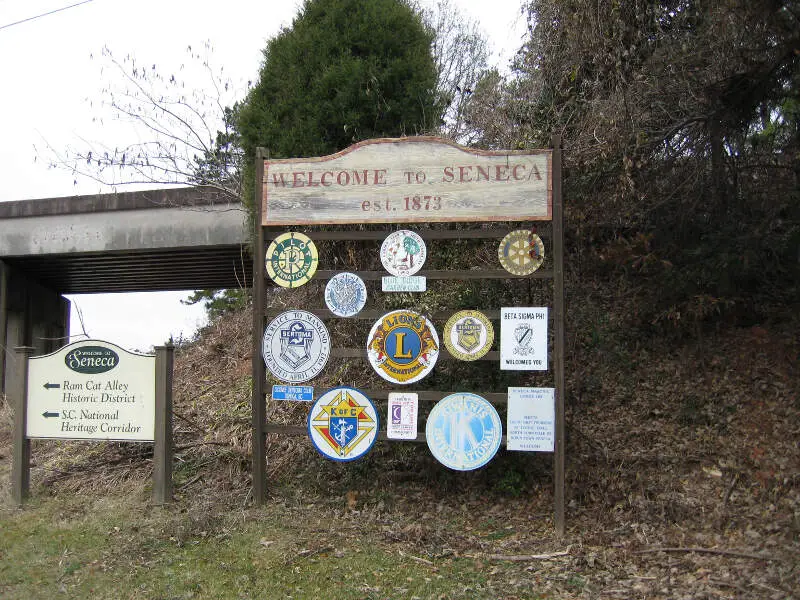
Population: 8,910
Divorce Rate: 8.0%
Divorcees: 570
Median Income: $52,207
More on Seneca: Data
How We Determined The Places In South Carolina That Get Un-Hitched The Most
Since this is the 58th category of rankings we are compiling for the site, we had a pretty good idea of where to find data on marriage and divorce in America. We used Saturday Night Science to look at the U.S. Census Bureau on divorce rates. Because who likes tracking misery more than the U.S. government?
Specifically, we looked at the 2019-2023 American Community Survey table S1201 — Marital Status.
Pretty straightforward on that front — we just had to extract the following column of data:
- Population 15 Years and Over -> Divorced
There are some interesting/fun/sad data like .1% of female Americans aged 15-19 are divorced, but 0% of males (That’s probably a rounding issue, but still).
But the national data is for another day. Today, the analysis focuses on the 65 places in South Carolina with a population of over 5,000.
We ranked each place by the percentage of divorcees over 15 years of age from highest to lowest. We crowned the divorce capital of South Carolina the place with the highest incidence of divorcees, Union.
And if you’re trying to avoid divorce, check out Tega Cay, the city with the lowest divorce rate in South Carolina.
We updated this article for 2025 and this list is our fifth time ranking the cities in South Carolina with the highest divorce rates.
Getting Some Closure In South Carolina After Untying The Know
Besides just coming up with what we thought would be a great new blog/book title, “Untying the Knot In South Carolina: Life After Divorce,” we now have a sense of what places in the Palmetto State don’t pay much attention to the whole “’til death do we part” phrase.
The cities with the highest divorce rate in South Carolina are Union, Hartsville, Chester, Florence, Lancaster, Dillon, Darlington, Georgetown, Cheraw, and Seneca.
Try to keep in mind that the reason cities rank where they do in South Carolina could be because of the age, education, and income distribution, as all of those things impact the rate of divorce.
And that’s probably for the best. Getting out of a toxic relationship is much better than staying in it.
Just make sure you have your running shoes ready to go.
For more South Carolina reading, check out:
- Richest Cities In South Carolina
- Worst Places To Live In South Carolina
- Most Dangerous Cities In South Carolina
Cities With The Highest Divorce Rates In South Carolina
| Rank | City | Population | Divorcees | Divorce Rate |
|---|---|---|---|---|
| 1 | Union, SC | 8,047 | 708 | 11.0% |
| 2 | Hartsville, SC | 7,422 | 534 | 9.0% |
| 3 | Chester, SC | 5,241 | 377 | 9.0% |
| 4 | Florence, SC | 40,205 | 2,894 | 9.0% |
| 5 | Lancaster, SC | 8,738 | 559 | 8.0% |
| 6 | Dillon, SC | 6,406 | 409 | 8.0% |
| 7 | Darlington, SC | 6,128 | 392 | 8.0% |
| 8 | Georgetown, SC | 8,511 | 544 | 8.0% |
| 9 | Cheraw, SC | 5,024 | 321 | 8.0% |
| 10 | Seneca, SC | 8,910 | 570 | 8.0% |
| 11 | Sumter, SC | 43,065 | 2,756 | 8.0% |
| 12 | Bennettsville, SC | 6,798 | 435 | 8.0% |
| 13 | Laurens, SC | 9,307 | 595 | 8.0% |
| 14 | Cayce, SC | 13,718 | 768 | 7.0% |
| 15 | Spartanburg, SC | 38,578 | 2,160 | 7.0% |
| 16 | Gaffney, SC | 12,612 | 706 | 7.0% |
| 17 | Clinton, SC | 7,624 | 426 | 7.0% |
| 18 | Fountain Inn, SC | 11,307 | 633 | 7.0% |
| 19 | Moncks Corner, SC | 14,362 | 804 | 7.0% |
| 20 | Lexington, SC | 24,132 | 1,351 | 7.0% |
| 21 | Irmo, SC | 11,799 | 660 | 7.0% |
| 22 | Lake City, SC | 6,032 | 289 | 6.0% |
| 23 | West Columbia, SC | 17,723 | 850 | 6.0% |
| 24 | Hollywood, SC | 5,330 | 255 | 6.0% |
| 25 | North Charleston, SC | 117,460 | 5,638 | 6.0% |
| 26 | Orangeburg, SC | 13,189 | 633 | 6.0% |
| 27 | Walterboro, SC | 5,490 | 263 | 6.0% |
| 28 | Easley, SC | 23,942 | 1,149 | 6.0% |
| 29 | Rock Hill, SC | 74,769 | 2,990 | 5.0% |
| 30 | Newberry, SC | 10,733 | 429 | 5.0% |
| 31 | York, SC | 8,697 | 347 | 5.0% |
| 32 | Anderson, SC | 29,563 | 1,182 | 5.0% |
| 33 | Camden, SC | 8,025 | 321 | 5.0% |
| 34 | Greenwood, SC | 22,527 | 901 | 5.0% |
| 35 | Columbia, SC | 138,019 | 5,520 | 5.0% |
| 36 | Forest Acres, SC | 10,491 | 419 | 5.0% |
| 37 | Clover, SC | 7,013 | 224 | 4.0% |
| 38 | Hanahan, SC | 21,119 | 675 | 4.0% |
| 39 | Marion, SC | 6,338 | 202 | 4.0% |
| 40 | Conway, SC | 26,082 | 834 | 4.0% |
| 41 | Aiken, SC | 32,334 | 1,034 | 4.0% |
| 42 | Greer, SC | 39,191 | 1,254 | 4.0% |
| 43 | Greenville, SC | 71,755 | 2,296 | 4.0% |
| 44 | Lyman, SC | 6,317 | 151 | 3.0% |
| 45 | Summerville, SC | 51,262 | 1,230 | 3.0% |
| 46 | Simpsonville, SC | 25,125 | 603 | 3.0% |
| 47 | Central, SC | 5,299 | 127 | 3.0% |
| 48 | Charleston, SC | 152,014 | 3,648 | 3.0% |
| 49 | Beaufort, SC | 13,660 | 327 | 3.0% |
| 50 | North Myrtle Beach, SC | 19,343 | 464 | 3.0% |
| 51 | North Augusta, SC | 24,928 | 598 | 3.0% |
| 52 | Myrtle Beach, SC | 37,214 | 893 | 3.0% |
| 53 | Mauldin, SC | 25,985 | 623 | 3.0% |
| 54 | Goose Creek, SC | 46,964 | 1,127 | 3.0% |
| 55 | Clemson, SC | 17,759 | 426 | 3.0% |
| 56 | Travelers Rest, SC | 8,137 | 195 | 3.0% |
| 57 | Fort Mill, SC | 28,281 | 452 | 2.0% |
| 58 | Mount Pleasant, SC | 92,662 | 1,482 | 2.0% |
| 59 | James Island, SC | 11,738 | 187 | 2.0% |
| 60 | Blythewood, SC | 5,309 | 84 | 2.0% |
| 61 | Port Royal, SC | 15,047 | 120 | 1.0% |
| 62 | Hilton Head Island, SC | 37,805 | 302 | 1.0% |
| 63 | Hardeeville, SC | 9,293 | 74 | 1.0% |
| 64 | Bluffton, SC | 31,323 | 0 | 0.0% |
| 65 | Tega Cay, SC | 13,267 | 0 | 0.0% |