
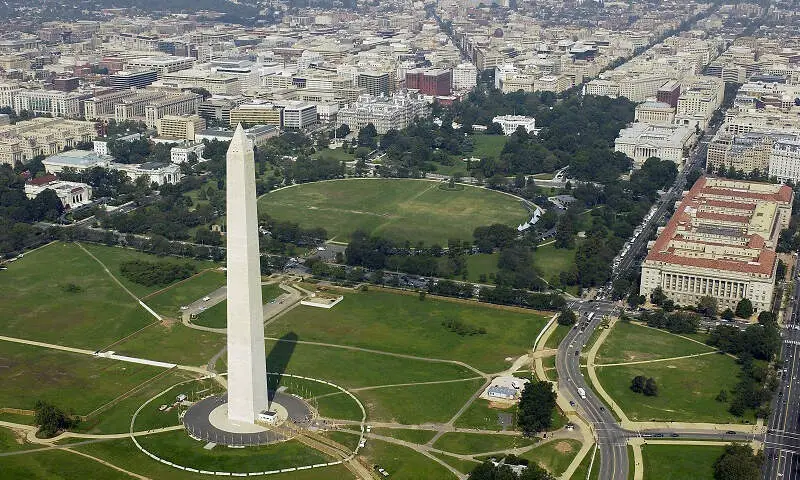
Washington’s neighborhoods conjure up too many stereotypes to count. You’ve got hipster areas, preppy places, neighborhoods where college kids thrive, and of course, ghettos.
It seems as if there’s a neighborhood for everyone in Washington.
And while the city consistently ranks as one of the best places to live in Washington Dc thanks in part to tons of entertainment and jobs, it’s not all rainbows and sunshine in Washington. Some neighborhoods aren’t as safe as others.
So the question arises, which Washington neighborhoods are the most dangerous and which are the safest?
Today, we’ll use Saturday Night Science to determine which Washington hoods need a little tender loving care – the sore thumbs of the Washington area if you will. Realistically, you can’t expect all the neighborhoods to be amazing, although Au-Tenleytown ranks way above the rest.
We examined 34 of Washington’s neighborhoods to find out the most dangerous places to live. These places don’t quite measure up to Washington’s reputation.
Table Of Contents: Top 10 | Methodology | Summary | Table
So what’s the worst neighborhood to live in Washington for 2025? According to the most recent census data, Brentwood looks to be the worst neighborhood in Washington.
Read on to see how we determined the places around Washington that need a pick-me-up. And remember, don’t blame the messenger.
For more Washington Dc reading, check out:
The 10 Most Dangerous Neighborhoods In Washington For 2025
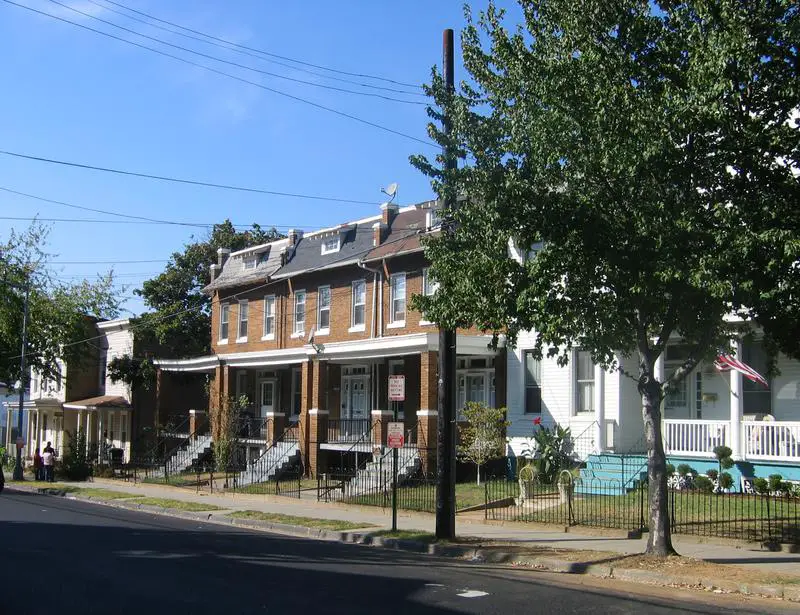
1. Brentwood
/10
Population: 28,660
Violent Crimes Per 100k: 1,858
Property Crime Per 100k: 7,172
Median Home Value: $375,268 (4th worst)
Median Income: $57,873 (3rd worst)
2. Deanwood
/10
Population: 29,798
Violent Crimes Per 100k: 2,884
Property Crime Per 100k: 5,757
Median Home Value: $221,083 (2nd worst)
Median Income: $41,869 (2nd worst)
3. Anacostia
/10
Population: 117,488
Violent Crimes Per 100k: 1,822
Property Crime Per 100k: 3,505
Median Home Value: $204,972 (worst)
Median Income: $38,135 (worst)
4. Stadium-Armory
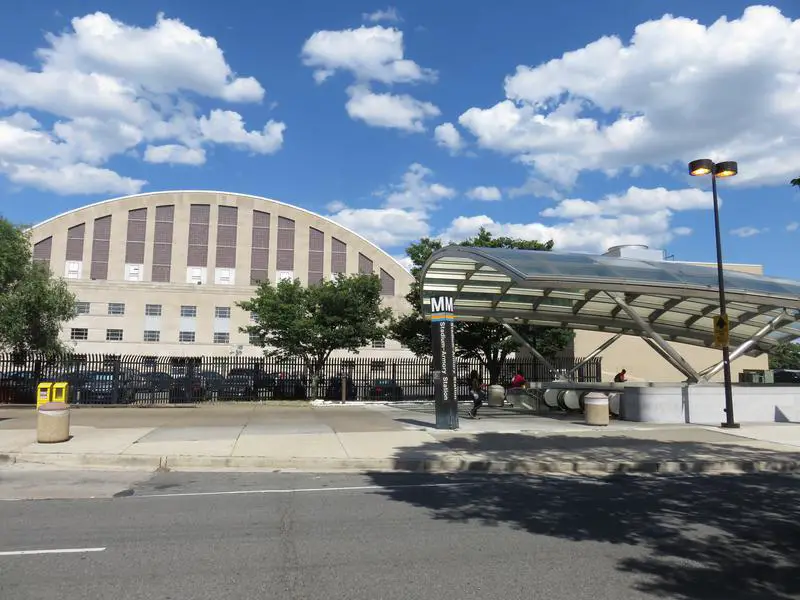
/10
Population: 21,142
Violent Crimes Per 100k: 1,512
Property Crime Per 100k: 4,824
Median Home Value: $383,542 (7th worst)
Median Income: $67,389 (5th worst)
5. Downtown
/10
Population: 8,132
Violent Crimes Per 100k: 1,166
Property Crime Per 100k: 4,628
Median Home Value: $376,550 (6th worst)
Median Income: $96,571 (15th worst)
6. South West
/10
Population: 11,100
Violent Crimes Per 100k: 1,189
Property Crime Per 100k: 5,310
Median Home Value: $376,320 (5th worst)
Median Income: $73,812 (7th worst)
7. Fort Totten-Upper Northeast
/10
Population: 24,123
Violent Crimes Per 100k: 729
Property Crime Per 100k: 3,313
Median Home Value: $409,893 (8th worst)
Median Income: $69,793 (6th worst)
8. Catholic University-Brookland
/10
Population: 57,481
Violent Crimes Per 100k: 763
Property Crime Per 100k: 3,225
Median Home Value: $437,657 (9th worst)
Median Income: $77,486 (8th worst)
9. Capitol Hill
/10
Population: 55,592
Violent Crimes Per 100k: 958
Property Crime Per 100k: 5,638
Median Home Value: $587,596 (17th worst)
Median Income: $102,238 (19th worst)
10. Mount Vernon Square
/10
Population: 6,077
Violent Crimes Per 100k: 704
Property Crime Per 100k: 8,734
Median Home Value: $551,333 (14th worst)
Median Income: $86,024 (11th worst)
Methodology: How we determined the most dangerous Washington neighborhoods in 2025
To figure out how bad a place is to live in, we only needed to know what kinds of things people like and then decide what places have the least amount of those things. We plugged the following criteria into Saturday Night Science to get the worst neighborhoods in Washington:
- High crime (Estimated)
- High unemployment (Less jobs)
- Low median income (Less pay)
- Low population density (No things to do)
- Low home values (No one’s willing to pay to live here)
Then, we ranked each neighborhood in Washington, Washington Dc for each of these criteria from worst to best.
Next, we averaged the individual rankings for each criterion into a “Worst Score.”
The neighborhood with the lowest “Worst Score” ranks as the most dangerous neighborhood of Washington.
The article is an opinion based on facts and is meant as infotainment. We updated this article for 2025. This report is our time ranking the worst neighborhoods to live in Washington.
Skip to the end to see the list of all 34 neighborhoods ranked from worst to best.
Summary: The Worst Neighborhoods Around Washington
Well, there you have it — the worst of the neighborhoods in Washington with Brentwood landing at the bottom of the pack.
The worst neighborhoods in Washington are Brentwood, Deanwood, Anacostia, Stadium-Armory, Downtown, South West, Fort Totten-Upper Northeast, Catholic University-Brookland, Capitol Hill, and Mount Vernon Square.
As mentioned earlier, the neighborhoods in Washington aren’t all bad. Au-Tenleytown takes the cake as the best place to live in Washington.
The best neighborhoods in Washington are Au-Tenleytown, Cleveland Park, The Palisades, Chevy Chase, and Woodley Park.
We ranked the neighborhoods from worst to best in the chart below.
For more Washington Dc reading, check out:
Most Dangerous Neighborhoods To Live In Washington For 2025?
| Rank | Neighborhood | Population | Home Value | Median Income |
|---|---|---|---|---|
| 1 | Brentwood | 28,660 | $375,268 | $57,873 |
| 2 | Deanwood | 29,798 | $221,083 | $41,869 |
| 3 | Anacostia | 117,488 | $204,972 | $38,135 |
| 4 | Stadium-Armory | 21,142 | $383,542 | $67,389 |
| 5 | Downtown | 8,132 | $376,550 | $96,571 |
| 6 | South West | 11,100 | $376,320 | $73,812 |
| 7 | Fort Totten-Upper Northeast | 24,123 | $409,893 | $69,793 |
| 8 | Catholic University-Brookland | 57,481 | $437,657 | $77,486 |
| 9 | Capitol Hill | 55,592 | $587,596 | $102,238 |
| 10 | Mount Vernon Square | 6,077 | $551,333 | $86,024 |
| 11 | Columbia Heights | 34,835 | $549,242 | $79,273 |
| 12 | Shaw | 13,782 | $652,492 | $88,444 |
| 13 | Brightwood | 16,318 | $600,254 | $81,113 |
| 14 | Foggy Bottom | 16,297 | $364,920 | $66,121 |
| 15 | Ledroit Park | 11,683 | $599,300 | $94,929 |
| 16 | Petworth | 11,886 | $716,475 | $102,992 |
| 17 | U Street Corridor | 10,104 | $669,883 | $107,136 |
| 18 | Dupont Circle | 13,633 | $522,360 | $98,703 |
| 19 | Takoma Park | 5,302 | $751,983 | $154,600 |
| 20 | Mount Pleasant | 12,696 | $552,782 | $91,084 |
| 21 | Adams Morgan | 17,154 | $529,538 | $101,976 |
| 22 | Friendship Heights | 3,065 | $828,100 | $147,242 |
| 23 | Foxhall Village | 912 | $944,350 | $115,365 |
| 24 | Logan Circle | 13,768 | $538,670 | $100,118 |
| 25 | Georgetown | 14,118 | $1,056,531 | $150,426 |
| 26 | Glover Park | 12,937 | $573,173 | $115,917 |
| 27 | Berkley | 2,252 | $1,083,560 | $156,869 |
| 28 | Kalorama | 2,608 | $1,335,200 | $134,859 |
| 29 | Barnaby Woods | 9,436 | $1,017,370 | $176,403 |
| 30 | Woodley Park | 7,667 | $948,260 | $140,259 |
| 31 | Chevy Chase | 18,506 | $919,342 | $142,356 |
| 32 | The Palisades | 3,598 | $1,188,500 | $166,149 |
| 33 | Cleveland Park | 11,732 | $759,100 | $138,234 |
| 34 | Au-Tenleytown | 18,855 | $973,793 | $178,534 |