
Cities with highest divorce rate in Connecticut research summary. We used Saturday Night Science to analyze Connecticut’s most recent Census data to determine the divorce rate for each city in Connecticut based on the percentage of currently divorced residents. Here are the results of our analysis:
-
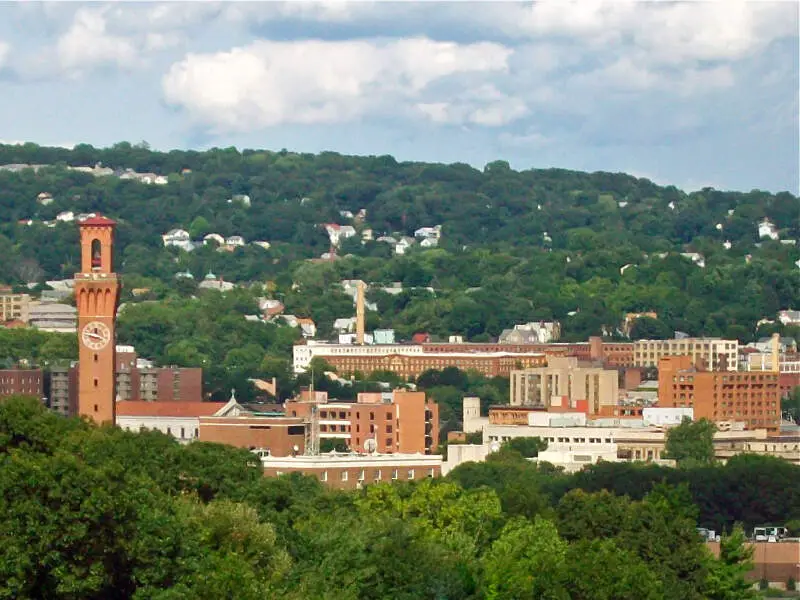
The city with the highest divorce rate in Connecticut is Ansonia based on the most recent Census data.
-
Ansonia is 9.0% Divorced.
-
The city with the lowest divorce rate in Connecticut is Stamford.
-
Stamford is 2.0% Divorced.
-
Connecticut is 5.0% Divorced.
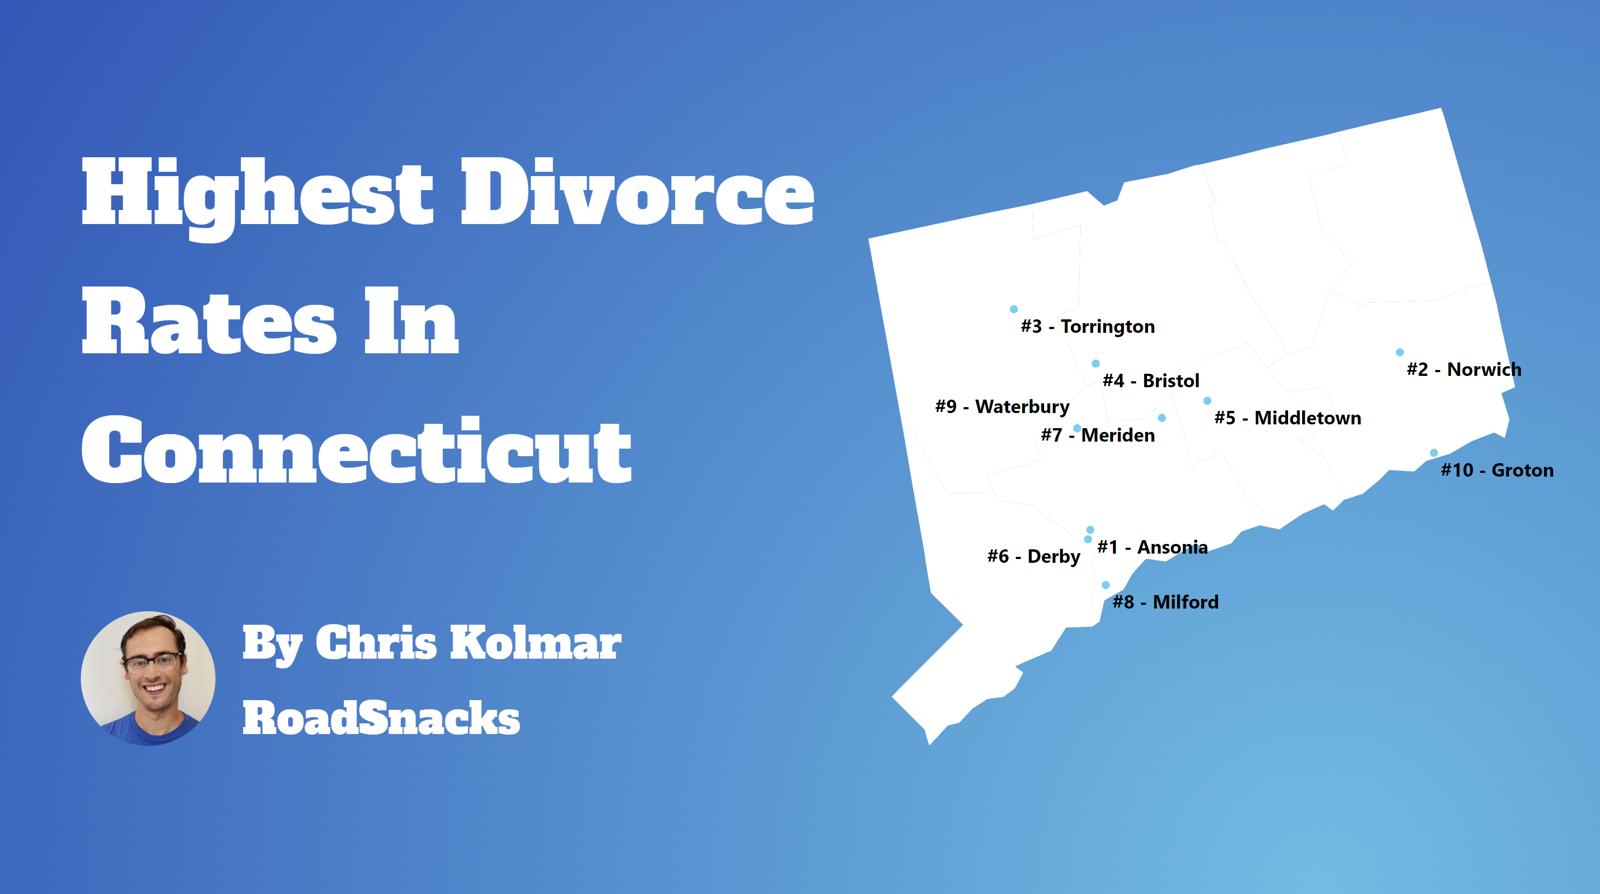
Table Of Contents: Top Ten | Methodology | Summary | Table
There are some 143,933 people living in Connecticut over fifteen years of age who are divorced. You can compare that to the 28,339,199 Americans who are currently divorced in 2025.
Many people decide to run away – or split up – across the Constitution State.
Isn’t the divorce rate in America close to 50%? Yes indeed. But we’re measuring something else; we are looking at counts and percentages of people over 15 years old who are currently divorced. That 50% statistic is for the percentage of people who have ever been divorced.
For today’s analysis, the focus will be on the number of currently divorced people.
So now that we have you biting your nails, rethinking your worldview, and pulling out your hair, let’s look at the places in Connecticut with the highest rates of divorcees.
The 10 Cities In Connecticut With The Highest Divorce Rates
Let’s quickly recap before we dive into the Saturday Night Science behind the data.
What is the city in Connecticut with the highest divorce rate? That would be Ansonia, with 9.0% of people over 15 years of age being divorced, per the most recent census data.
What is the overall Connecticut divorce rate? According to the 2019-2023 Community Survey, the overall divorce rate in Connecticut is 5.0%, which compares to the US divorce rate of 10.9%.
Alrighty, on to how we calculated the places with the highest divorce rates in Connecticut.
For more Connecticut reading, check out:
- Most Dangerous Cities In Connecticut
- Richest Cities In Connecticut
- Best Places To Raise A Family In Connecticut
The 10 Places With The Highest Divorce Rate In Connecticut For 2025

/10
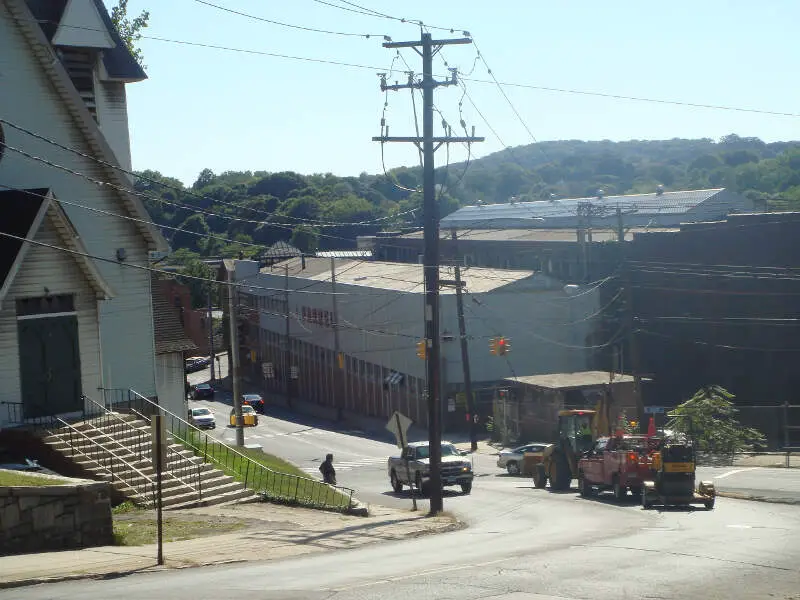
Population: 18,951
Divorce Rate: 9.0%
Divorcees: 1,364
Median Income: $80,585
More on Ansonia: Data


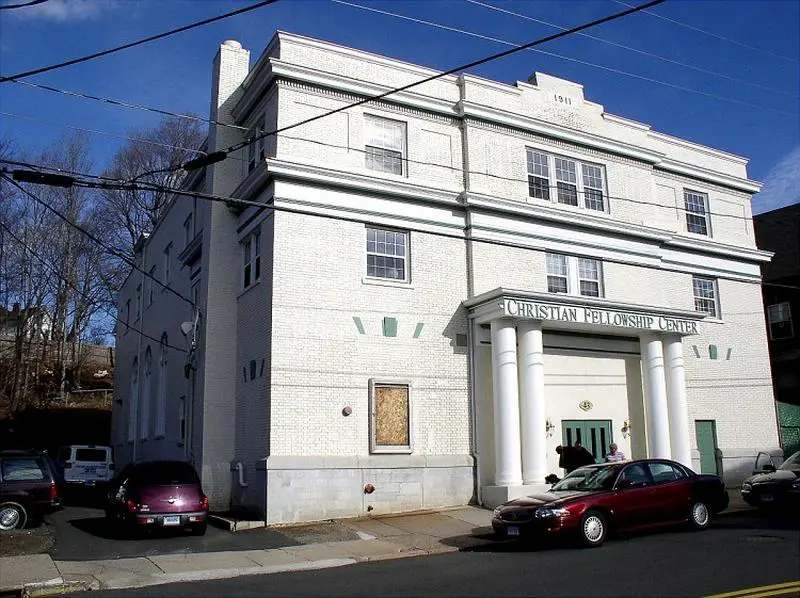
/10
Population: 35,481
Divorce Rate: 9.0%
Divorcees: 2,554
Median Income: $69,611
More on Torrington: Data


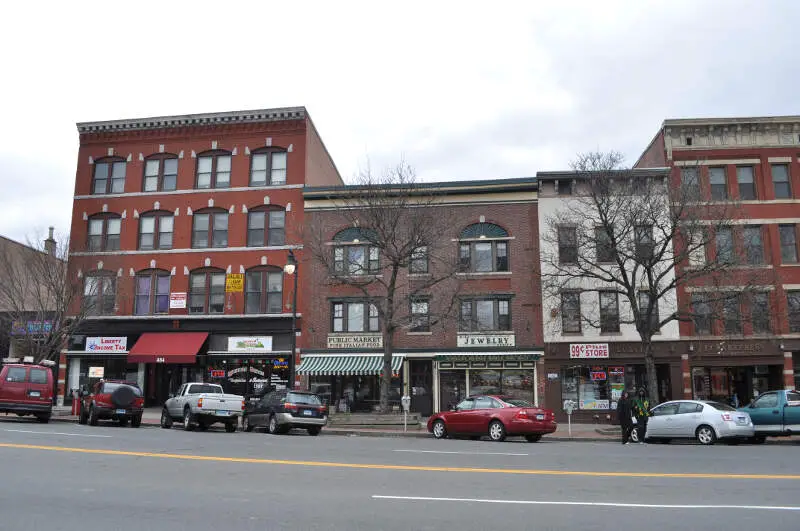
/10
Population: 60,418
Divorce Rate: 8.0%
Divorcees: 3,866
Median Income: $68,617
More on Meriden: Data

/10
Population: 61,129
Divorce Rate: 7.0%
Divorcees: 3,423
Median Income: $83,458
More on Bristol: Data


/10
Population: 41,402
Divorce Rate: 7.0%
Divorcees: 2,318
Median Income: $114,739
More on Shelton: Data


/10
Population: 12,359
Divorce Rate: 7.0%
Divorcees: 692
Median Income: $76,263
More on Derby: Data

/10
Population: 47,646
Divorce Rate: 7.0%
Divorcees: 2,668
Median Income: $73,979
More on Middletown: Data


/10
Population: 50,749
Divorce Rate: 7.0%
Divorcees: 2,841
Median Income: $110,126
More on Milford: Data


/10
Population: 39,992
Divorce Rate: 6.0%
Divorcees: 1,919
Median Income: $64,185
More on Norwich: Data

/10
Population: 114,356
Divorce Rate: 6.0%
Divorcees: 5,489
Median Income: $51,642
More on Waterbury: Data
How We Determined The Places In Connecticut That Get Un-Hitched The Most
Since this is the 58th category of rankings we are compiling for the site, we had a pretty good idea of where to find data on marriage and divorce in America. We used Saturday Night Science to look at the U.S. Census Bureau on divorce rates. Because who likes tracking misery more than the U.S. government?
Specifically, we looked at the 2019-2023 American Community Survey table S1201 — Marital Status.
Pretty straightforward on that front — we just had to extract the following column of data:
- Population 15 Years and Over -> Divorced
There are some interesting/fun/sad data like .1% of female Americans aged 15-19 are divorced, but 0% of males (That’s probably a rounding issue, but still).
But the national data is for another day. Today, the analysis focuses on the 21 places in Connecticut with a population of over 9,000.
We ranked each place by the percentage of divorcees over 15 years of age from highest to lowest. We crowned the divorce capital of Connecticut the place with the highest incidence of divorcees, Ansonia.
And if you’re trying to avoid divorce, check out Stamford, the city with the lowest divorce rate in Connecticut.
We updated this article for 2025 and this list is our fifth time ranking the cities in Connecticut with the highest divorce rates.
Getting Some Closure In Connecticut After Untying The Know
Besides just coming up with what we thought would be a great new blog/book title, “Untying the Knot In Connecticut: Life After Divorce,” we now have a sense of what places in the Constitution State don’t pay much attention to the whole “’til death do we part” phrase.
The cities with the highest divorce rate in Connecticut are Ansonia, Torrington, Meriden, Bristol, Shelton, Derby, Middletown, Milford, Norwich, and Waterbury.
Try to keep in mind that the reason cities rank where they do in Connecticut could be because of the age, education, and income distribution, as all of those things impact the rate of divorce.
And that’s probably for the best. Getting out of a toxic relationship is much better than staying in it.
Just make sure you have your running shoes ready to go.
For more Connecticut reading, check out:
- Most Dangerous Cities In Connecticut
- Richest Cities In Connecticut
- Best Places To Raise A Family In Connecticut
Cities With The Highest Divorce Rates In Connecticut
| Rank | City | Population | Divorcees | Divorce Rate |
|---|---|---|---|---|
| 1 | Ansonia, CT | 18,951 | 1,364 | 9.0% |
| 2 | Torrington, CT | 35,481 | 2,554 | 9.0% |
| 3 | Meriden, CT | 60,418 | 3,866 | 8.0% |
| 4 | Bristol, CT | 61,129 | 3,423 | 7.0% |
| 5 | Shelton, CT | 41,402 | 2,318 | 7.0% |
| 6 | Derby, CT | 12,359 | 692 | 7.0% |
| 7 | Middletown, CT | 47,646 | 2,668 | 7.0% |
| 8 | Milford, CT | 50,749 | 2,841 | 7.0% |
| 9 | Norwich, CT | 39,992 | 1,919 | 6.0% |
| 10 | Waterbury, CT | 114,356 | 5,489 | 6.0% |
| 11 | Naugatuck, CT | 31,634 | 1,518 | 6.0% |
| 12 | New Britain, CT | 73,301 | 2,932 | 5.0% |
| 13 | Groton, CT | 9,343 | 373 | 5.0% |
| 14 | West Haven, CT | 55,147 | 2,205 | 5.0% |
| 15 | New Haven, CT | 132,893 | 4,252 | 4.0% |
| 16 | New London, CT | 27,199 | 870 | 4.0% |
| 17 | Bridgeport, CT | 148,012 | 4,736 | 4.0% |
| 18 | Danbury, CT | 86,086 | 2,066 | 3.0% |
| 19 | Hartford, CT | 119,970 | 2,879 | 3.0% |
| 20 | Norwalk, CT | 91,375 | 1,462 | 2.0% |
| 21 | Stamford, CT | 135,806 | 2,172 | 2.0% |