
Cities with highest divorce rate in Kentucky research summary. We used Saturday Night Science to analyze Kentucky’s most recent Census data to determine the divorce rate for each city in Kentucky based on the percentage of currently divorced residents. Here are the results of our analysis:
-
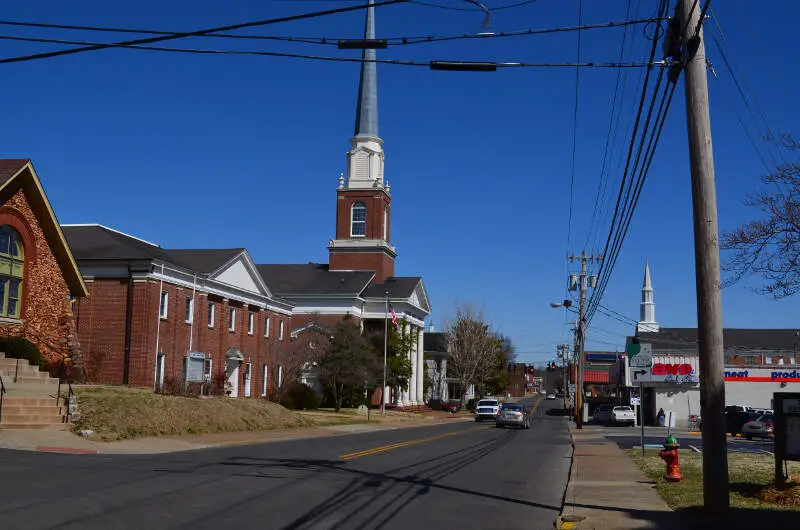
The city with the highest divorce rate in Kentucky is Lebanon based on the most recent Census data.
-
Lebanon is 17.0% Divorced.
-
The city with the lowest divorce rate in Kentucky is Oak Grove.
-
Oak Grove is 1.0% Divorced.
-
Kentucky is 8.0% Divorced.
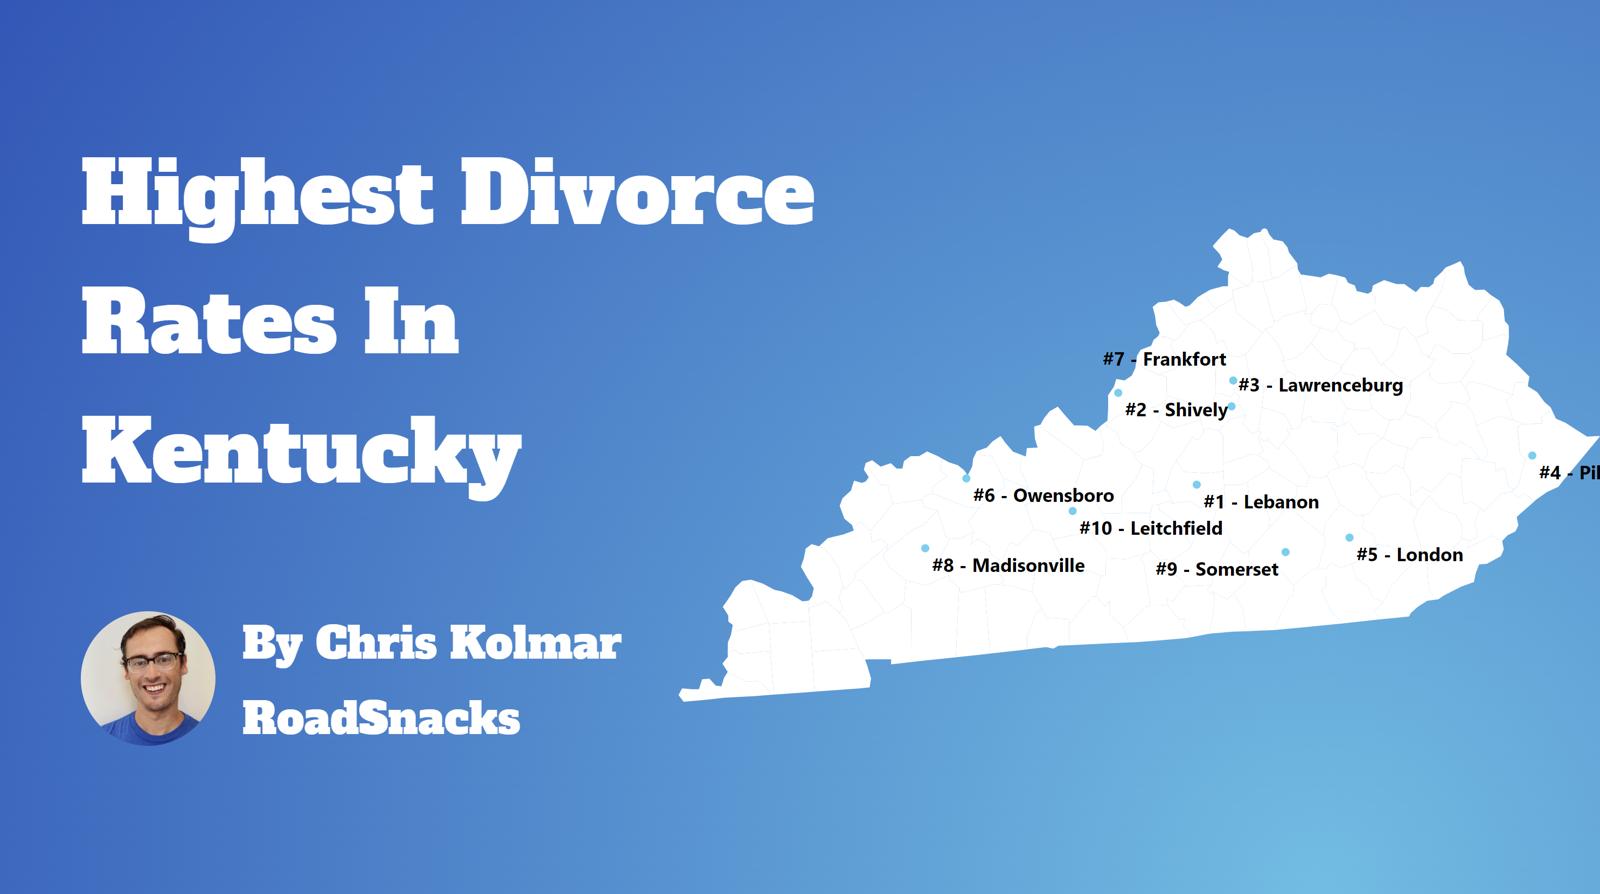
Table Of Contents: Top Ten | Methodology | Summary | Table
There are some 288,686 people living in Kentucky over fifteen years of age who are divorced. You can compare that to the 28,339,199 Americans who are currently divorced in 2025.
Many people decide to run away – or split up – across the Bluegrass State.
Isn’t the divorce rate in America close to 50%? Yes indeed. But we’re measuring something else; we are looking at counts and percentages of people over 15 years old who are currently divorced. That 50% statistic is for the percentage of people who have ever been divorced.
For today’s analysis, the focus will be on the number of currently divorced people.
So now that we have you biting your nails, rethinking your worldview, and pulling out your hair, let’s look at the places in Kentucky with the highest rates of divorcees.
The 10 Cities In Kentucky With The Highest Divorce Rates
Let’s quickly recap before we dive into the Saturday Night Science behind the data.
What is the city in Kentucky with the highest divorce rate? That would be Lebanon, with 17.0% of people over 15 years of age being divorced, per the most recent census data.
What is the overall Kentucky divorce rate? According to the 2019-2023 Community Survey, the overall divorce rate in Kentucky is 8.0%, which compares to the US divorce rate of 10.9%.
Alrighty, on to how we calculated the places with the highest divorce rates in Kentucky.
For more Kentucky reading, check out:
- Richest Cities In Kentucky
- Best Places To Raise A Family In Kentucky
- Most Dangerous Cities In Kentucky
The 10 Places With The Highest Divorce Rate In Kentucky For 2025

/10
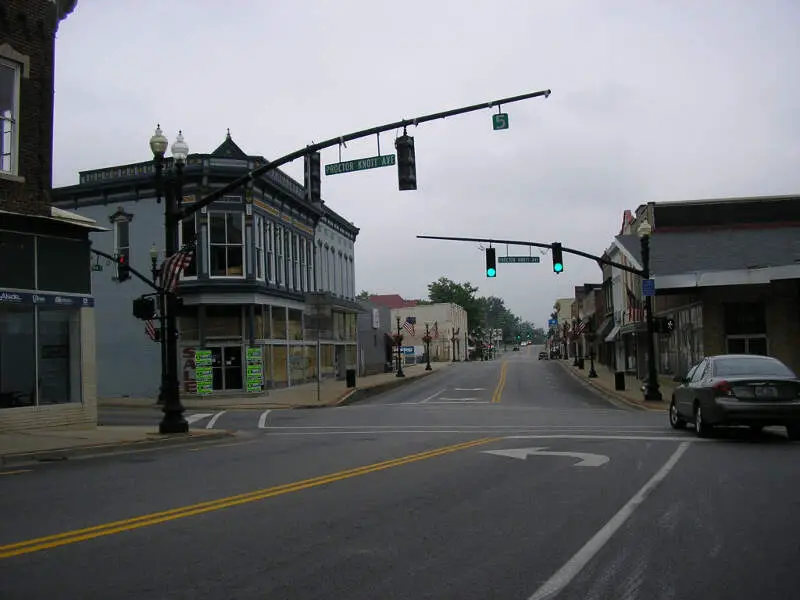
Population: 6,364
Divorce Rate: 17.0%
Divorcees: 865
Median Income: $39,483
More on Lebanon: Data

/10
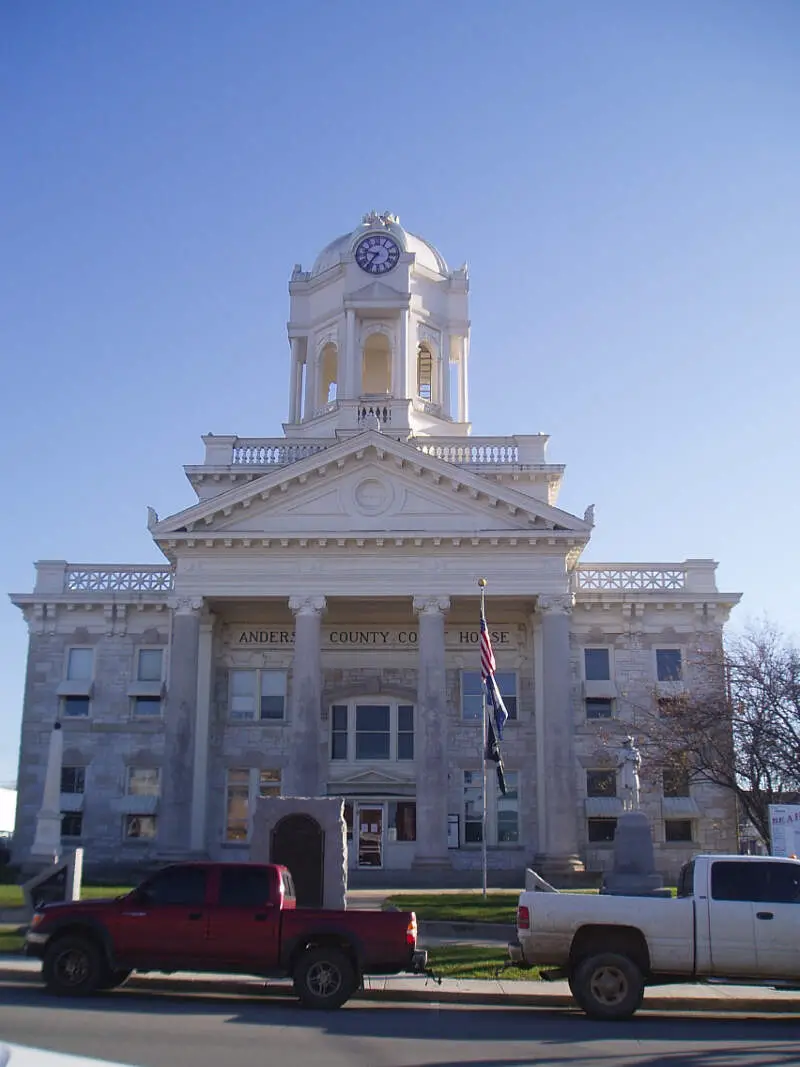
Population: 11,838
Divorce Rate: 17.0%
Divorcees: 1,609
Median Income: $63,690
More on Lawrenceburg: Data

/10
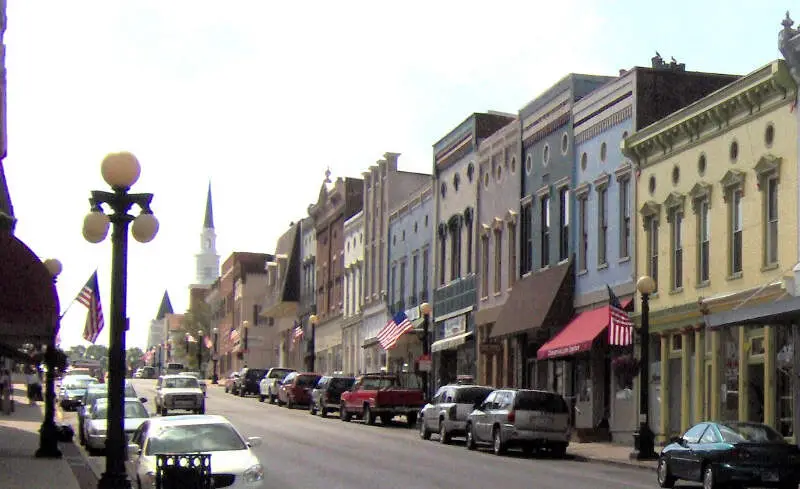
Population: 9,126
Divorce Rate: 15.0%
Divorcees: 1,095
Median Income: $46,821
More on Harrodsburg: Data

/10
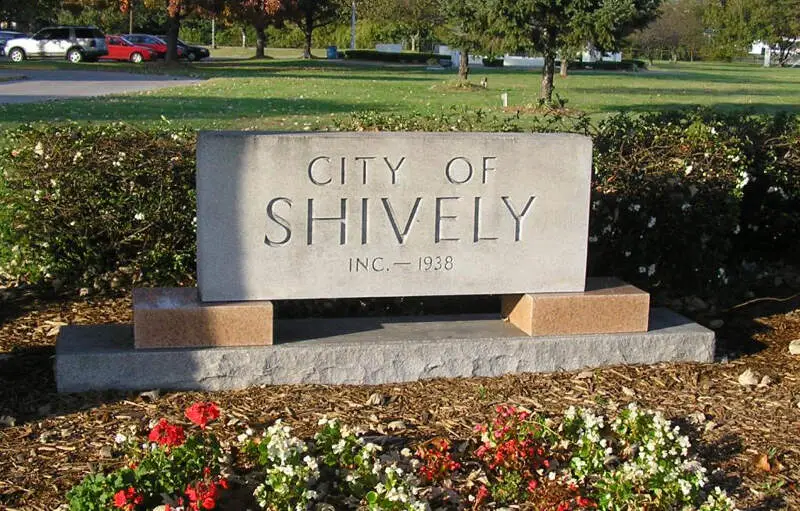
Population: 15,556
Divorce Rate: 14.0%
Divorcees: 1,742
Median Income: $46,522
More on Shively: Data

/10
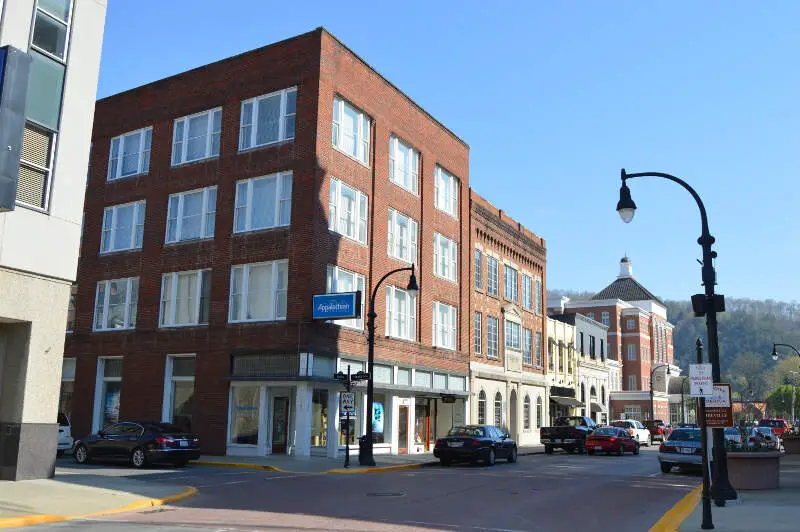
Population: 7,560
Divorce Rate: 14.0%
Divorcees: 846
Median Income: $39,216
More on Pikeville: Data

/10
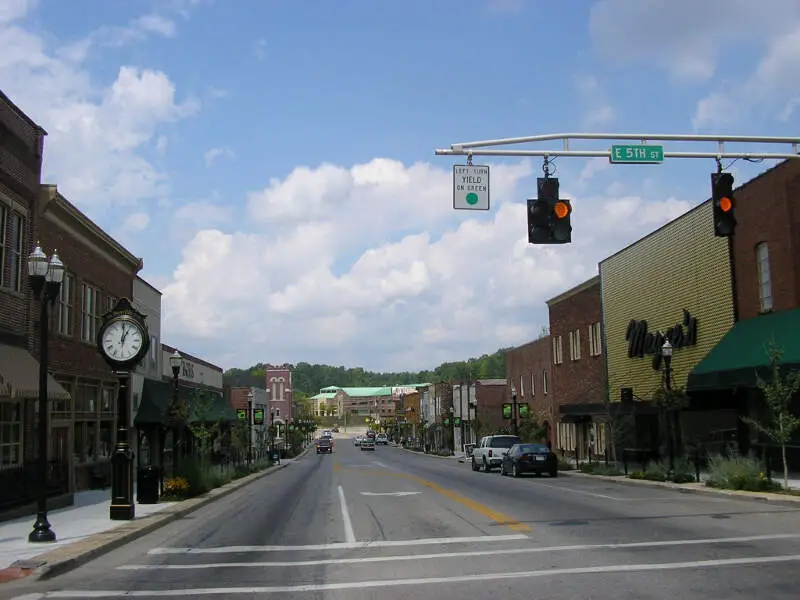
Population: 7,576
Divorce Rate: 14.0%
Divorcees: 848
Median Income: $45,850
More on London: Data

/10
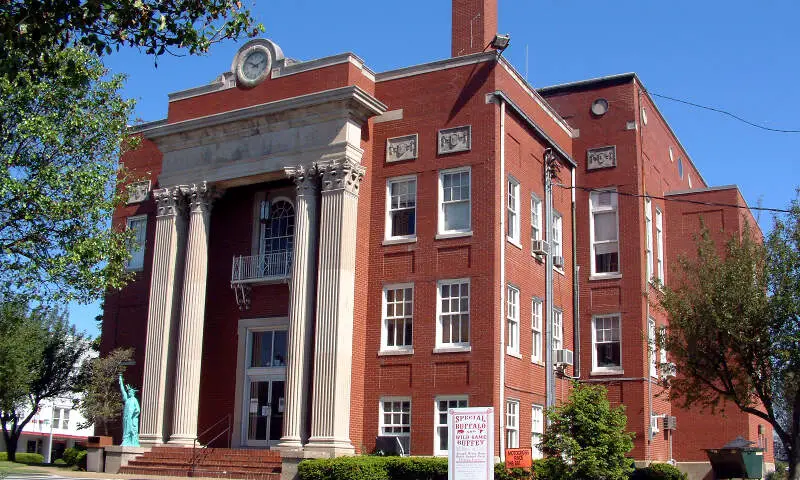
Population: 6,434
Divorce Rate: 14.0%
Divorcees: 720
Median Income: $47,168
More on Leitchfield: Data

/10
Population: 15,141
Divorce Rate: 14.0%
Divorcees: 1,695
Median Income: $42,417
More on Glasgow: Data

/10
Population: 28,452
Divorce Rate: 14.0%
Divorcees: 3,186
Median Income: $54,438
More on Frankfort: Data

/10
Population: 12,108
Divorce Rate: 13.0%
Divorcees: 1,259
Median Income: $32,910
More on Somerset: Data
How We Determined The Places In Kentucky That Get Un-Hitched The Most
Since this is the 58th category of rankings we are compiling for the site, we had a pretty good idea of where to find data on marriage and divorce in America. We used Saturday Night Science to look at the U.S. Census Bureau on divorce rates. Because who likes tracking misery more than the U.S. government?
Specifically, we looked at the 2019-2023 American Community Survey table S1201 — Marital Status.
Pretty straightforward on that front — we just had to extract the following column of data:
- Population 15 Years and Over -> Divorced
There are some interesting/fun/sad data like .1% of female Americans aged 15-19 are divorced, but 0% of males (That’s probably a rounding issue, but still).
But the national data is for another day. Today, the analysis focuses on the 80 places in Kentucky with a population of over 5,000.
We ranked each place by the percentage of divorcees over 15 years of age from highest to lowest. We crowned the divorce capital of Kentucky the place with the highest incidence of divorcees, Lebanon.
And if you’re trying to avoid divorce, check out Oak Grove, the city with the lowest divorce rate in Kentucky.
We updated this article for 2025 and this list is our fifth time ranking the cities in Kentucky with the highest divorce rates.
Getting Some Closure In Kentucky After Untying The Know
Besides just coming up with what we thought would be a great new blog/book title, “Untying the Knot In Kentucky: Life After Divorce,” we now have a sense of what places in the Bluegrass State don’t pay much attention to the whole “’til death do we part” phrase.
The cities with the highest divorce rate in Kentucky are Lebanon, Lawrenceburg, Harrodsburg, Shively, Pikeville, London, Leitchfield, Glasgow, Frankfort, and Somerset.
Try to keep in mind that the reason cities rank where they do in Kentucky could be because of the age, education, and income distribution, as all of those things impact the rate of divorce.
And that’s probably for the best. Getting out of a toxic relationship is much better than staying in it.
Just make sure you have your running shoes ready to go.
For more Kentucky reading, check out:
- Richest Cities In Kentucky
- Best Places To Raise A Family In Kentucky
- Most Dangerous Cities In Kentucky
Cities With The Highest Divorce Rates In Kentucky
| Rank | City | Population | Divorcees | Divorce Rate |
|---|---|---|---|---|
| 1 | Lebanon, KY | 6,364 | 865 | 17.0% |
| 2 | Lawrenceburg, KY | 11,838 | 1,609 | 17.0% |
| 3 | Harrodsburg, KY | 9,126 | 1,095 | 15.0% |
| 4 | Shively, KY | 15,556 | 1,742 | 14.0% |
| 5 | Pikeville, KY | 7,560 | 846 | 14.0% |
| 6 | London, KY | 7,576 | 848 | 14.0% |
| 7 | Leitchfield, KY | 6,434 | 720 | 14.0% |
| 8 | Glasgow, KY | 15,141 | 1,695 | 14.0% |
| 9 | Frankfort, KY | 28,452 | 3,186 | 14.0% |
| 10 | Somerset, KY | 12,108 | 1,259 | 13.0% |
| 11 | Campbellsville, KY | 11,523 | 1,198 | 13.0% |
| 12 | Madisonville, KY | 19,442 | 2,021 | 13.0% |
| 13 | Versailles, KY | 10,382 | 996 | 12.0% |
| 14 | Shepherdsville, KY | 14,351 | 1,377 | 12.0% |
| 15 | Owensboro, KY | 60,112 | 5,770 | 12.0% |
| 16 | Hopkinsville, KY | 31,011 | 2,977 | 12.0% |
| 17 | Winchester, KY | 19,133 | 1,836 | 12.0% |
| 18 | Corbin, KY | 8,430 | 809 | 12.0% |
| 19 | Berea, KY | 15,557 | 1,493 | 12.0% |
| 20 | Middlesborough, KY | 9,258 | 814 | 11.0% |
| 21 | Maysville, KY | 8,778 | 772 | 11.0% |
| 22 | Cynthiana, KY | 6,412 | 564 | 11.0% |
| 23 | Mount Sterling, KY | 7,549 | 664 | 11.0% |
| 24 | Hillview, KY | 8,735 | 698 | 10.0% |
| 25 | Bardstown, KY | 13,673 | 1,093 | 10.0% |
| 26 | Paris, KY | 10,107 | 808 | 10.0% |
| 27 | Ashland, KY | 21,405 | 1,712 | 10.0% |
| 28 | Mayfield, KY | 9,905 | 792 | 10.0% |
| 29 | Danville, KY | 17,235 | 1,378 | 10.0% |
| 30 | Hazard, KY | 5,105 | 408 | 10.0% |
| 31 | Russellville, KY | 7,244 | 579 | 10.0% |
| 32 | Nicholasville, KY | 31,625 | 2,277 | 9.0% |
| 33 | Mount Washington, KY | 18,228 | 1,312 | 9.0% |
| 34 | Henderson, KY | 27,994 | 2,015 | 9.0% |
| 35 | Florence, KY | 32,334 | 2,328 | 9.0% |
| 36 | Bellevue, KY | 5,598 | 403 | 9.0% |
| 37 | Paducah, KY | 26,894 | 1,936 | 9.0% |
| 38 | Walton, KY | 5,513 | 352 | 8.0% |
| 39 | Lyndon, KY | 10,956 | 701 | 8.0% |
| 40 | Louisville/jefferson County Metro Government (Balance), KY | 627,210 | 40,141 | 8.0% |
| 41 | Erlanger, KY | 19,677 | 1,259 | 8.0% |
| 42 | Princeton, KY | 6,242 | 399 | 8.0% |
| 43 | Covington, KY | 40,902 | 2,617 | 8.0% |
| 44 | Crestwood, KY | 6,275 | 401 | 8.0% |
| 45 | Richmond, KY | 35,498 | 2,271 | 8.0% |
| 46 | Shelbyville, KY | 17,436 | 1,115 | 8.0% |
| 47 | Georgetown, KY | 38,206 | 2,445 | 8.0% |
| 48 | Taylor Mill, KY | 6,880 | 385 | 7.0% |
| 49 | Central City, KY | 5,736 | 321 | 7.0% |
| 50 | St. Matthews, KY | 17,491 | 979 | 7.0% |
| 51 | Elizabethtown, KY | 31,870 | 1,784 | 7.0% |
| 52 | Alexandria, KY | 10,430 | 584 | 7.0% |
| 53 | Middletown, KY | 9,622 | 538 | 7.0% |
| 54 | Flatwoods, KY | 7,281 | 407 | 7.0% |
| 55 | Fort Mitchell, KY | 8,676 | 485 | 7.0% |
| 56 | Douglass Hills, KY | 5,437 | 304 | 7.0% |
| 57 | Lexington-Fayette Urban County, KY | 321,122 | 17,982 | 7.0% |
| 58 | La Grange, KY | 10,188 | 570 | 7.0% |
| 59 | Dayton, KY | 5,703 | 319 | 7.0% |
| 60 | Jeffersontown, KY | 28,988 | 1,623 | 7.0% |
| 61 | Monticello, KY | 5,741 | 321 | 7.0% |
| 62 | Elsmere, KY | 9,151 | 439 | 6.0% |
| 63 | Vine Grove, KY | 6,721 | 322 | 6.0% |
| 64 | Franklin, KY | 10,254 | 492 | 6.0% |
| 65 | Highland Heights, KY | 6,531 | 313 | 6.0% |
| 66 | Bowling Green, KY | 73,638 | 3,534 | 6.0% |
| 67 | Wilmore, KY | 6,031 | 289 | 6.0% |
| 68 | Newport, KY | 14,039 | 673 | 6.0% |
| 69 | Independence, KY | 29,024 | 1,393 | 6.0% |
| 70 | Radcliff, KY | 22,967 | 918 | 5.0% |
| 71 | Fort Wright, KY | 5,882 | 235 | 5.0% |
| 72 | Fort Thomas, KY | 17,242 | 689 | 5.0% |
| 73 | Cold Spring, KY | 6,298 | 251 | 5.0% |
| 74 | Murray, KY | 17,888 | 715 | 5.0% |
| 75 | Union, KY | 7,494 | 239 | 4.0% |
| 76 | Villa Hills, KY | 7,378 | 236 | 4.0% |
| 77 | Edgewood, KY | 8,429 | 202 | 3.0% |
| 78 | Williamsburg, KY | 5,226 | 125 | 3.0% |
| 79 | Morehead, KY | 6,924 | 110 | 2.0% |
| 80 | Oak Grove, KY | 7,945 | 63 | 1.0% |