
Cities with highest divorce rate in Maryland research summary. We used Saturday Night Science to analyze Maryland’s most recent Census data to determine the divorce rate for each city in Maryland based on the percentage of currently divorced residents. Here are the results of our analysis:
-
The city with the highest divorce rate in Maryland is Cambridge based on the most recent Census data.
-
Cambridge is 12.0% Divorced.
-
The city with the lowest divorce rate in Maryland is Takoma Park.
-
Takoma Park is 0.0% Divorced.
-
Maryland is 4.0% Divorced.
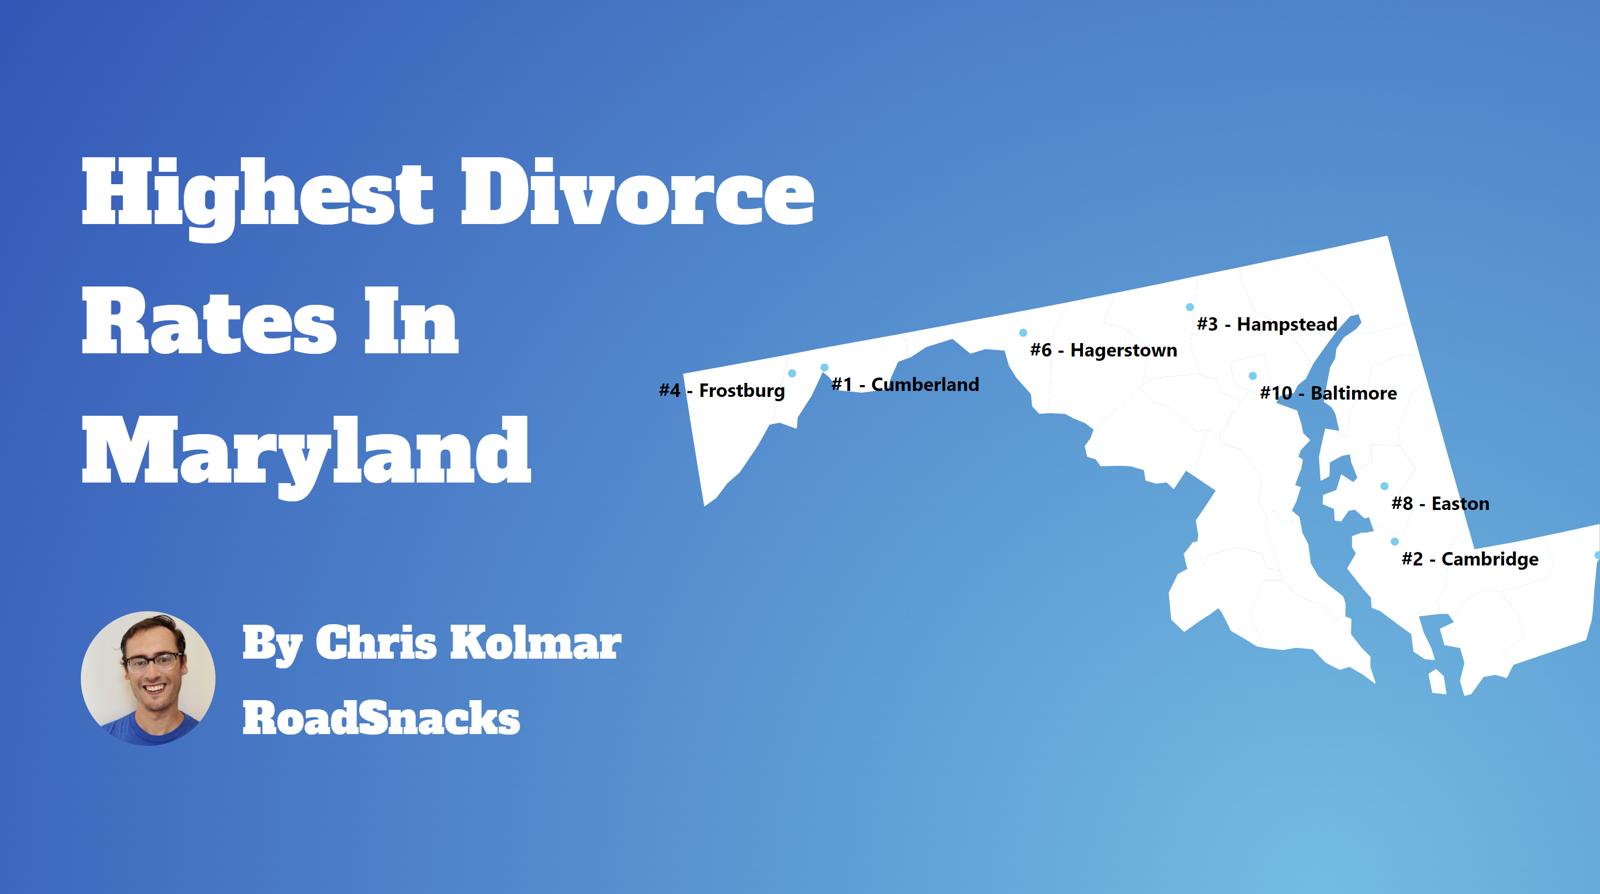
Table Of Contents: Top Ten | Methodology | Summary | Table
There are some 197,463 people living in Maryland over fifteen years of age who are divorced. You can compare that to the 28,339,199 Americans who are currently divorced in 2025.
Many people decide to run away – or split up – across the Old Line State.
Isn’t the divorce rate in America close to 50%? Yes indeed. But we’re measuring something else; we are looking at counts and percentages of people over 15 years old who are currently divorced. That 50% statistic is for the percentage of people who have ever been divorced.
For today’s analysis, the focus will be on the number of currently divorced people.
So now that we have you biting your nails, rethinking your worldview, and pulling out your hair, let’s look at the places in Maryland with the highest rates of divorcees.
The 10 Cities In Maryland With The Highest Divorce Rates
Let’s quickly recap before we dive into the Saturday Night Science behind the data.
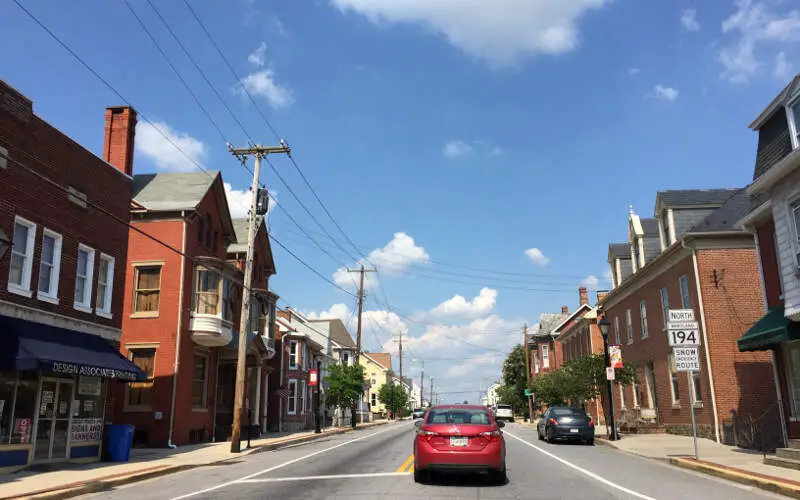
What is the city in Maryland with the highest divorce rate? That would be Cambridge, with 12.0% of people over 15 years of age being divorced, per the most recent census data.
What is the overall Maryland divorce rate? According to the 2019-2023 Community Survey, the overall divorce rate in Maryland is 4.0%, which compares to the US divorce rate of 10.9%.
Alrighty, on to how we calculated the places with the highest divorce rates in Maryland.
For more Maryland reading, check out:
- Cheapest Places To Live In Maryland
- Best Places To Raise A Family In Maryland
- Most Dangerous Cities In Maryland
The 10 Places With The Highest Divorce Rate In Maryland For 2025

/10
Population: 13,094
Divorce Rate: 12.0%
Divorcees: 1,257
Median Income: $46,261
More on Cambridge: Data

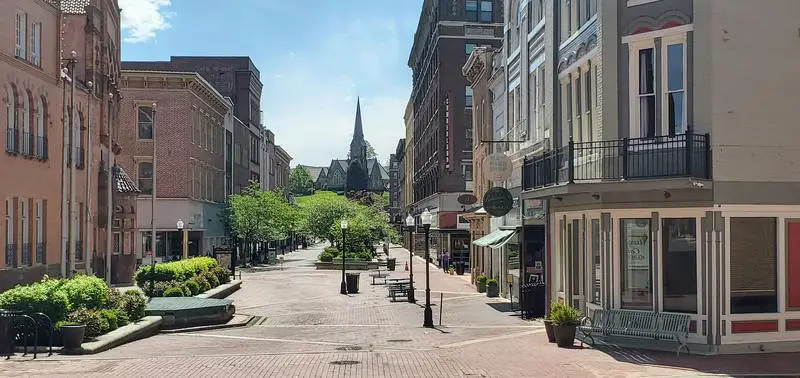
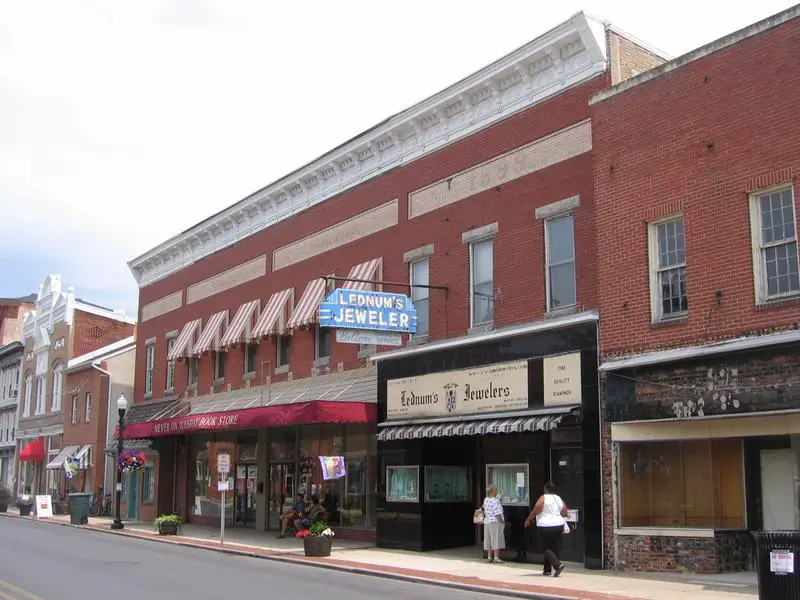
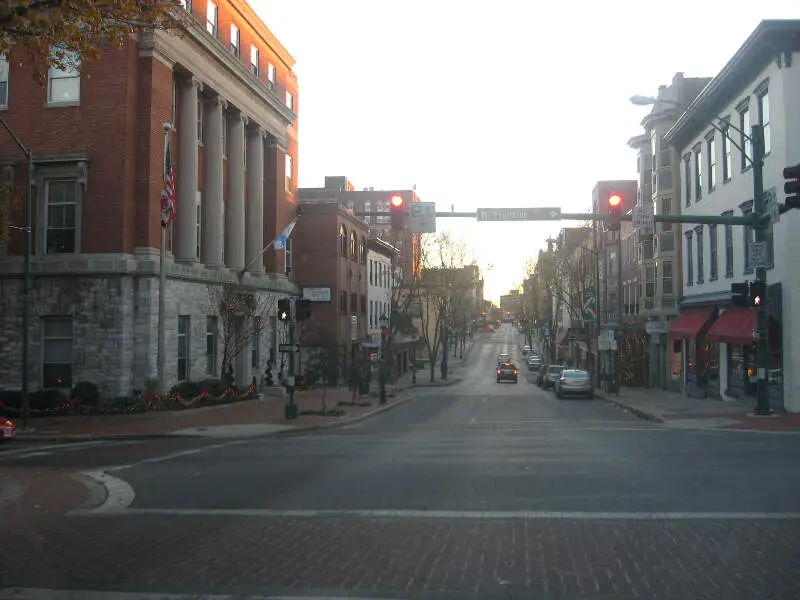
/10
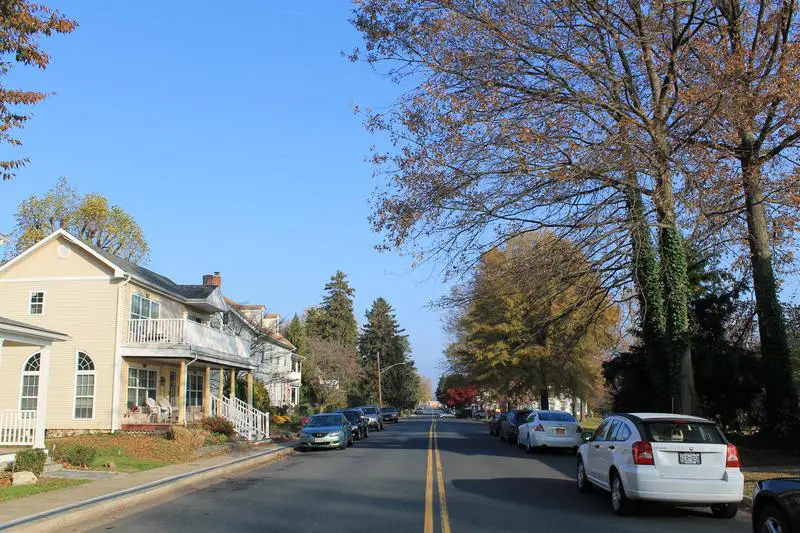
Population: 18,938
Divorce Rate: 11.0%
Divorcees: 1,666
Median Income: $47,819
More on Cumberland: Data

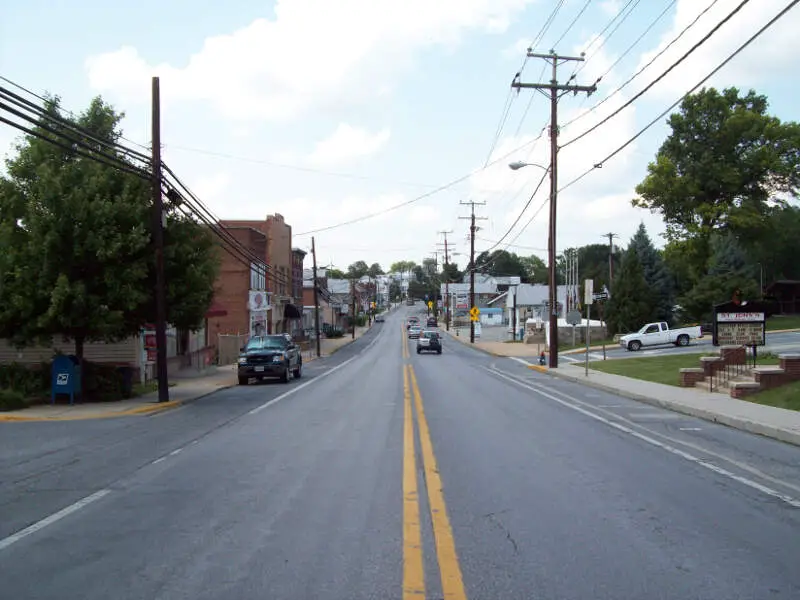
/10
Population: 6,311
Divorce Rate: 10.0%
Divorcees: 504
Median Income: $96,802
More on Hampstead: Data

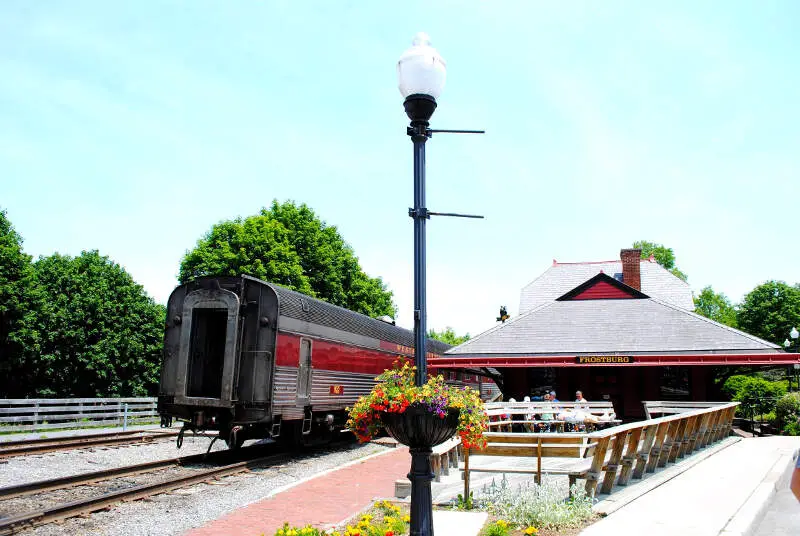
/10
Population: 7,025
Divorce Rate: 9.0%
Divorcees: 505
Median Income: $51,052
More on Frostburg: Data

/10
Population: 43,490
Divorce Rate: 8.0%
Divorcees: 2,783
Median Income: $49,957
More on Hagerstown: Data


/10
Population: 17,202
Divorce Rate: 8.0%
Divorcees: 1,100
Median Income: $73,460
More on Easton: Data

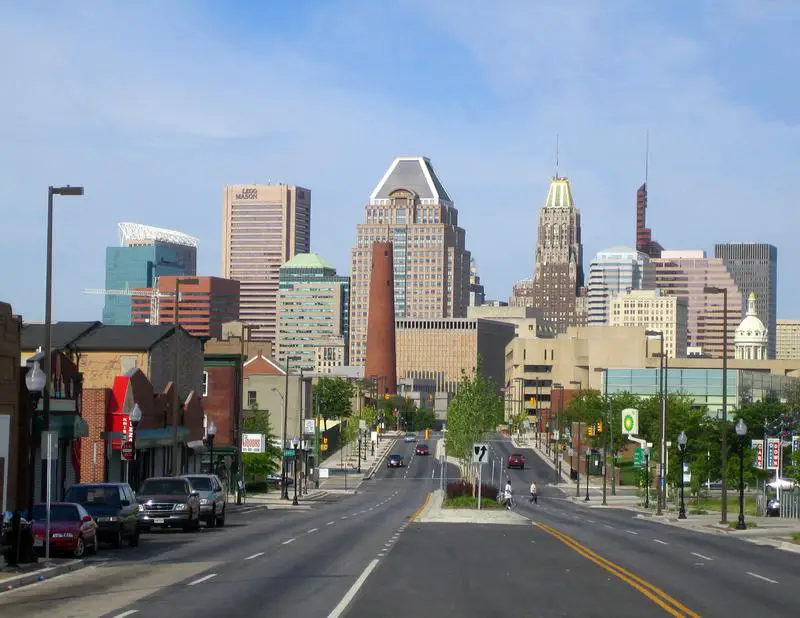
/10
Population: 577,193
Divorce Rate: 7.0%
Divorcees: 32,322
Median Income: $59,623
More on Baltimore: Data
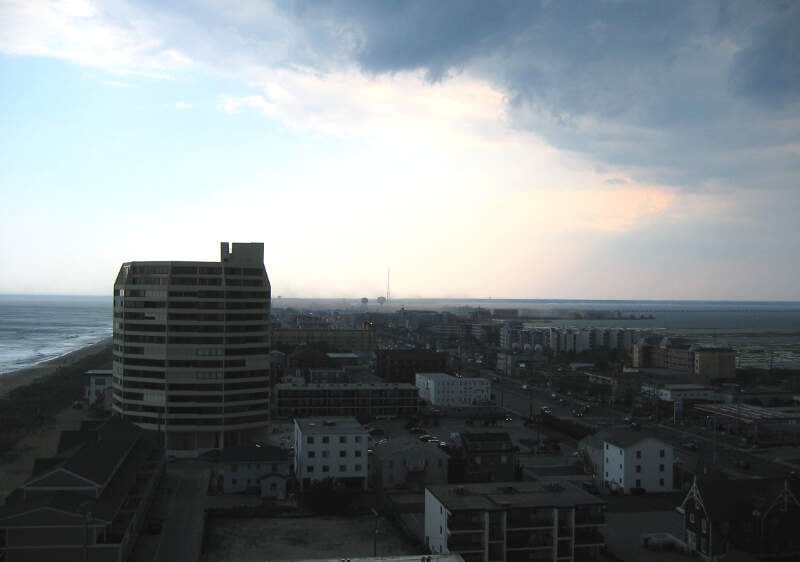
/10
Population: 6,887
Divorce Rate: 7.0%
Divorcees: 385
Median Income: $69,675
More on Ocean City: Data

/10
Population: 7,295
Divorce Rate: 6.0%
Divorcees: 350
Median Income: $78,726
More on Taneytown: Data

/10
Population: 14,857
Divorce Rate: 6.0%
Divorcees: 713
Median Income: $106,798
More on Havre De Grace: Data
How We Determined The Places In Maryland That Get Un-Hitched The Most
Since this is the 58th category of rankings we are compiling for the site, we had a pretty good idea of where to find data on marriage and divorce in America. We used Saturday Night Science to look at the U.S. Census Bureau on divorce rates. Because who likes tracking misery more than the U.S. government?
Specifically, we looked at the 2019-2023 American Community Survey table S1201 — Marital Status.
Pretty straightforward on that front — we just had to extract the following column of data:
- Population 15 Years and Over -> Divorced
There are some interesting/fun/sad data like .1% of female Americans aged 15-19 are divorced, but 0% of males (That’s probably a rounding issue, but still).
But the national data is for another day. Today, the analysis focuses on the 44 places in Maryland with a population of over 5,000.
We ranked each place by the percentage of divorcees over 15 years of age from highest to lowest. We crowned the divorce capital of Maryland the place with the highest incidence of divorcees, Cambridge.
And if you’re trying to avoid divorce, check out Takoma Park, the city with the lowest divorce rate in Maryland.
We updated this article for 2025 and this list is our fifth time ranking the cities in Maryland with the highest divorce rates.
Getting Some Closure In Maryland After Untying The Know
Besides just coming up with what we thought would be a great new blog/book title, “Untying the Knot In Maryland: Life After Divorce,” we now have a sense of what places in the Old Line State don’t pay much attention to the whole “’til death do we part” phrase.
The cities with the highest divorce rate in Maryland are Cambridge, Cumberland, Hampstead, Frostburg, Hagerstown, Easton, Baltimore, Ocean City, Taneytown, and Havre de Grace.
Try to keep in mind that the reason cities rank where they do in Maryland could be because of the age, education, and income distribution, as all of those things impact the rate of divorce.
And that’s probably for the best. Getting out of a toxic relationship is much better than staying in it.
Just make sure you have your running shoes ready to go.
For more Maryland reading, check out:
- Cheapest Places To Live In Maryland
- Best Places To Raise A Family In Maryland
- Most Dangerous Cities In Maryland
Cities With The Highest Divorce Rates In Maryland
| Rank | City | Population | Divorcees | Divorce Rate |
|---|---|---|---|---|
| 1 | Cambridge, MD | 13,094 | 1,257 | 12.0% |
| 2 | Cumberland, MD | 18,938 | 1,666 | 11.0% |
| 3 | Hampstead, MD | 6,311 | 504 | 10.0% |
| 4 | Frostburg, MD | 7,025 | 505 | 9.0% |
| 5 | Hagerstown, MD | 43,490 | 2,783 | 8.0% |
| 6 | Easton, MD | 17,202 | 1,100 | 8.0% |
| 7 | Baltimore, MD | 577,193 | 32,322 | 7.0% |
| 8 | Ocean City, MD | 6,887 | 385 | 7.0% |
| 9 | Taneytown, MD | 7,295 | 350 | 6.0% |
| 10 | Havre De Grace, MD | 14,857 | 713 | 6.0% |
| 11 | Aberdeen, MD | 16,831 | 673 | 5.0% |
| 12 | Thurmont, MD | 6,439 | 257 | 5.0% |
| 13 | Salisbury, MD | 33,080 | 1,323 | 5.0% |
| 14 | Elkton, MD | 15,867 | 634 | 5.0% |
| 15 | Westminster, MD | 20,257 | 810 | 5.0% |
| 16 | Cheste, MD | 5,548 | 221 | 5.0% |
| 17 | Bel Air, MD | 10,616 | 424 | 5.0% |
| 18 | Annapolis, MD | 40,744 | 1,629 | 5.0% |
| 19 | Manchester, MD | 5,446 | 174 | 4.0% |
| 20 | Berlin, MD | 5,161 | 165 | 4.0% |
| 21 | La Plata, MD | 10,470 | 335 | 4.0% |
| 22 | Brunswick, MD | 7,994 | 255 | 4.0% |
| 23 | Walkersville, MD | 6,352 | 203 | 4.0% |
| 24 | Frederick, MD | 80,617 | 1,934 | 3.0% |
| 25 | Middl, MD | 5,108 | 122 | 3.0% |
| 26 | Mount Airy, MD | 9,746 | 233 | 3.0% |
| 27 | Riverdale Park, MD | 7,249 | 173 | 3.0% |
| 28 | Greenbelt, MD | 24,572 | 393 | 2.0% |
| 29 | Chesapeake Beach, MD | 6,428 | 102 | 2.0% |
| 30 | New Carrollton, MD | 13,544 | 216 | 2.0% |
| 31 | Bowie, MD | 57,771 | 924 | 2.0% |
| 32 | Fruitland, MD | 5,698 | 91 | 2.0% |
| 33 | Cheverly, MD | 6,107 | 97 | 2.0% |
| 34 | Bladensburg, MD | 9,552 | 152 | 2.0% |
| 35 | Rockville, MD | 67,218 | 537 | 1.0% |
| 36 | College Park, MD | 34,397 | 275 | 1.0% |
| 37 | Mount Rainier, MD | 8,235 | 65 | 1.0% |
| 38 | Laurel, MD | 29,594 | 236 | 1.0% |
| 39 | Hyattsville, MD | 20,861 | 166 | 1.0% |
| 40 | Gaithersburg, MD | 69,225 | 553 | 1.0% |
| 41 | Poolesville, MD | 5,704 | 45 | 1.0% |
| 42 | Glenarden, MD | 6,320 | 50 | 1.0% |
| 43 | District Heights, MD | 5,888 | 0 | 0.0% |
| 44 | Takoma Park, MD | 17,522 | 0 | 0.0% |