
Cities with highest divorce rate in Michigan research summary. We used Saturday Night Science to analyze Michigan’s most recent Census data to determine the divorce rate for each city in Michigan based on the percentage of currently divorced residents. Here are the results of our analysis:
-
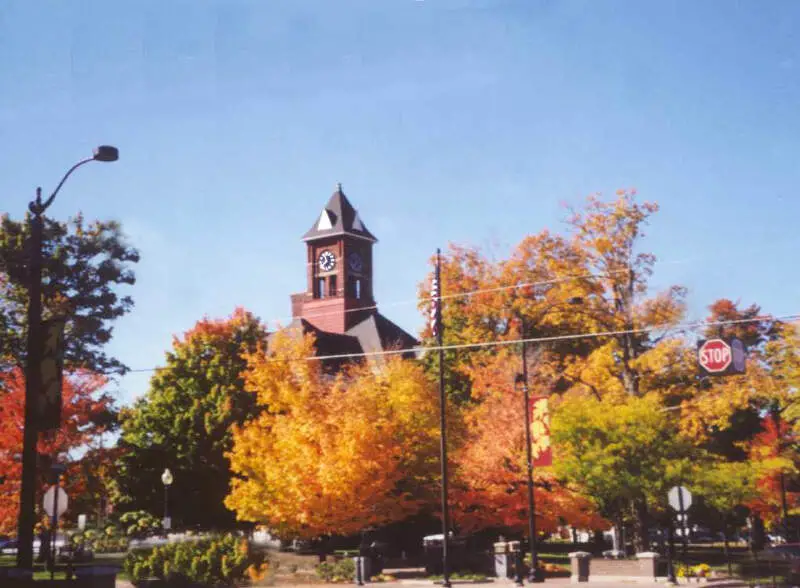
The city with the highest divorce rate in Michigan is Hastings based on the most recent Census data.
-
Hastings is 18.0% Divorced.
-
The city with the lowest divorce rate in Michigan is East Lansing.
-
East Lansing is 1.0% Divorced.
-
Michigan is 9.0% Divorced.
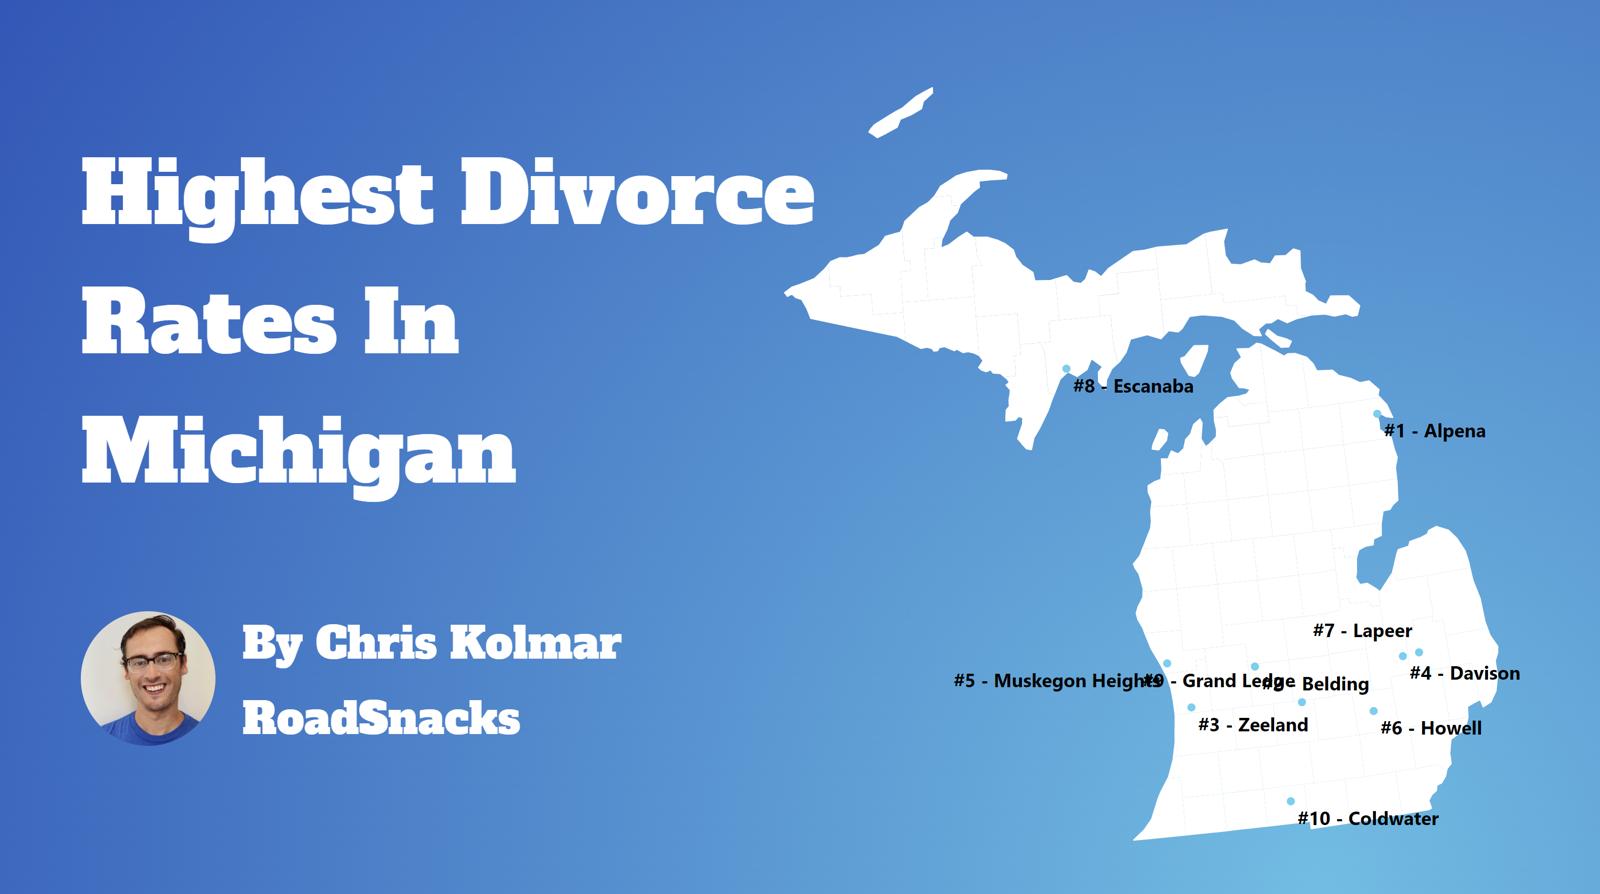
Table Of Contents: Top Ten | Methodology | Summary | Table
There are some 723,714 people living in Michigan over fifteen years of age who are divorced. You can compare that to the 28,339,199 Americans who are currently divorced in 2025.
Many people decide to run away – or split up – across the Wolverine State.
Isn’t the divorce rate in America close to 50%? Yes indeed. But we’re measuring something else; we are looking at counts and percentages of people over 15 years old who are currently divorced. That 50% statistic is for the percentage of people who have ever been divorced.
For today’s analysis, the focus will be on the number of currently divorced people.
So now that we have you biting your nails, rethinking your worldview, and pulling out your hair, let’s look at the places in Michigan with the highest rates of divorcees.
The 10 Cities In Michigan With The Highest Divorce Rates
Let’s quickly recap before we dive into the Saturday Night Science behind the data.
What is the city in Michigan with the highest divorce rate? That would be Hastings, with 18.0% of people over 15 years of age being divorced, per the most recent census data.
What is the overall Michigan divorce rate? According to the 2019-2023 Community Survey, the overall divorce rate in Michigan is 9.0%, which compares to the US divorce rate of 10.9%.
Alrighty, on to how we calculated the places with the highest divorce rates in Michigan.
For more Michigan reading, check out:
The 10 Places With The Highest Divorce Rate In Michigan For 2025

/10
Population: 7,515
Divorce Rate: 18.0%
Divorcees: 1,082
Median Income: $56,309
More on Hastings: Data

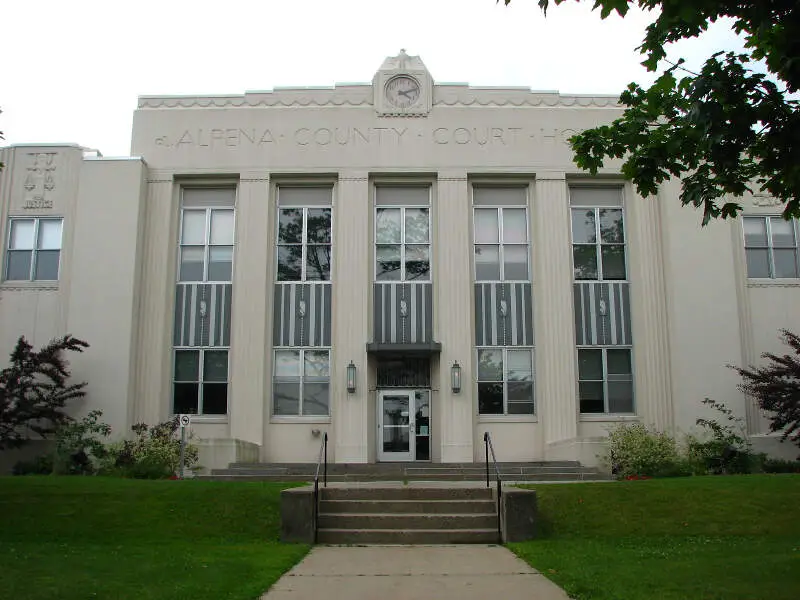
/10
Population: 10,178
Divorce Rate: 18.0%
Divorcees: 1,465
Median Income: $47,604
More on Alpena: Data
/10
Population: 5,082
Divorce Rate: 18.0%
Divorcees: 731
Median Income: $50,450
More on Davison: Data

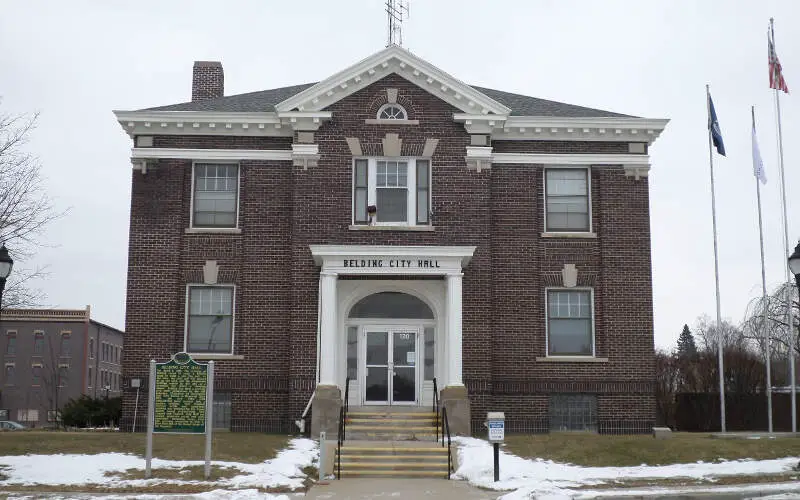
/10
Population: 5,949
Divorce Rate: 17.0%
Divorcees: 809
Median Income: $55,895
More on Belding: Data

/10
Population: 13,847
Divorce Rate: 16.0%
Divorcees: 1,772
Median Income: $50,084
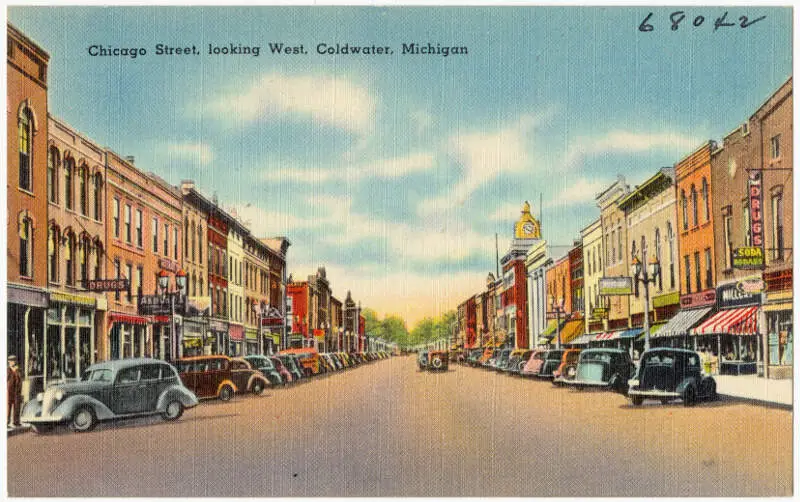
More on Coldwater: Data

/10
Population: 5,295
Divorce Rate: 16.0%
Divorcees: 677
Median Income: $43,681
More on Springfield: Data

/10
Population: 5,856
Divorce Rate: 15.0%
Divorcees: 702
Median Income: $73,862
More on Swartz Creek: Data

/10
Population: 9,902
Divorce Rate: 15.0%
Divorcees: 1,188
Median Income: $33,780
More on Muskegon Heights: Data

/10
Population: 5,691
Divorce Rate: 15.0%
Divorcees: 682
Median Income: $49,367
More on Zeeland: Data

/10
Population: 10,074
Divorce Rate: 15.0%
Divorcees: 1,208
Median Income: $57,122
More on Howell: Data
How We Determined The Places In Michigan That Get Un-Hitched The Most
Since this is the 58th category of rankings we are compiling for the site, we had a pretty good idea of where to find data on marriage and divorce in America. We used Saturday Night Science to look at the U.S. Census Bureau on divorce rates. Because who likes tracking misery more than the U.S. government?
Specifically, we looked at the 2019-2023 American Community Survey table S1201 — Marital Status.
Pretty straightforward on that front — we just had to extract the following column of data:
- Population 15 Years and Over -> Divorced
There are some interesting/fun/sad data like .1% of female Americans aged 15-19 are divorced, but 0% of males (That’s probably a rounding issue, but still).
But the national data is for another day. Today, the analysis focuses on the 154 places in Michigan with a population of over 5,000.
We ranked each place by the percentage of divorcees over 15 years of age from highest to lowest. We crowned the divorce capital of Michigan the place with the highest incidence of divorcees, Hastings.
And if you’re trying to avoid divorce, check out East Lansing, the city with the lowest divorce rate in Michigan.
We updated this article for 2025 and this list is our fifth time ranking the cities in Michigan with the highest divorce rates.
Getting Some Closure In Michigan After Untying The Know
Besides just coming up with what we thought would be a great new blog/book title, “Untying the Knot In Michigan: Life After Divorce,” we now have a sense of what places in the Wolverine State don’t pay much attention to the whole “’til death do we part” phrase.
The cities with the highest divorce rate in Michigan are Hastings, Alpena, Davison, Belding, Coldwater, Springfield, Swartz Creek, Muskegon Heights, Zeeland, and Howell.
Try to keep in mind that the reason cities rank where they do in Michigan could be because of the age, education, and income distribution, as all of those things impact the rate of divorce.
And that’s probably for the best. Getting out of a toxic relationship is much better than staying in it.
Just make sure you have your running shoes ready to go.
For more Michigan reading, check out:
Cities With The Highest Divorce Rates In Michigan
| Rank | City | Population | Divorcees | Divorce Rate |
|---|---|---|---|---|
| 1 | Hastings, MI | 7,515 | 1,082 | 18.0% |
| 2 | Alpena, MI | 10,178 | 1,465 | 18.0% |
| 3 | Davison, MI | 5,082 | 731 | 18.0% |
| 4 | Belding, MI | 5,949 | 809 | 17.0% |
| 5 | Coldwater, MI | 13,847 | 1,772 | 16.0% |
| 6 | Springfield, MI | 5,295 | 677 | 16.0% |
| 7 | Swartz Creek, MI | 5,856 | 702 | 15.0% |
| 8 | Muskegon Heights, MI | 9,902 | 1,188 | 15.0% |
| 9 | Zeeland, MI | 5,691 | 682 | 15.0% |
| 10 | Howell, MI | 10,074 | 1,208 | 15.0% |
| 11 | Jackson, MI | 31,206 | 3,744 | 15.0% |
| 12 | Milan, MI | 6,070 | 728 | 15.0% |
| 13 | Mason, MI | 8,239 | 922 | 14.0% |
| 14 | Manistee, MI | 6,275 | 702 | 14.0% |
| 15 | Port Huron, MI | 28,724 | 3,217 | 14.0% |
| 16 | Richmond, MI | 5,839 | 653 | 14.0% |
| 17 | Grand Ledge, MI | 7,797 | 873 | 14.0% |
| 18 | Escanaba, MI | 12,374 | 1,385 | 14.0% |
| 19 | Ludington, MI | 7,664 | 858 | 14.0% |
| 20 | Muskegon, MI | 37,203 | 4,166 | 14.0% |
| 21 | Lapeer, MI | 9,053 | 1,013 | 14.0% |
| 22 | Walled Lake, MI | 7,275 | 814 | 14.0% |
| 23 | Burton, MI | 29,529 | 3,307 | 14.0% |
| 24 | Allegan, MI | 5,182 | 580 | 14.0% |
| 25 | Trenton, MI | 18,242 | 1,897 | 13.0% |
| 26 | Greenville, MI | 8,897 | 925 | 13.0% |
| 27 | Owosso, MI | 14,658 | 1,524 | 13.0% |
| 28 | Harper Woods, MI | 15,205 | 1,581 | 13.0% |
| 29 | Bay City, MI | 32,445 | 3,374 | 13.0% |
| 30 | Ecorse, MI | 9,170 | 953 | 13.0% |
| 31 | Mount Clemens, MI | 15,567 | 1,618 | 13.0% |
| 32 | Traverse City, MI | 15,491 | 1,611 | 13.0% |
| 33 | Marshall, MI | 6,797 | 706 | 13.0% |
| 34 | St. Louis, MI | 6,926 | 720 | 13.0% |
| 35 | Cadillac, MI | 10,404 | 1,082 | 13.0% |
| 36 | Wyandotte, MI | 24,593 | 2,557 | 13.0% |
| 37 | Clawson, MI | 11,314 | 1,176 | 13.0% |
| 38 | Grand Haven, MI | 10,966 | 1,140 | 13.0% |
| 39 | Flushing, MI | 8,323 | 865 | 13.0% |
| 40 | Wayne, MI | 17,413 | 1,671 | 12.0% |
| 41 | Battle Creek, MI | 52,392 | 5,029 | 12.0% |
| 42 | Iron Mountain, MI | 7,508 | 720 | 12.0% |
| 43 | Charlotte, MI | 9,269 | 889 | 12.0% |
| 44 | Taylor, MI | 62,405 | 5,990 | 12.0% |
| 45 | Brighton, MI | 7,576 | 727 | 12.0% |
| 46 | Three Rivers, MI | 7,936 | 761 | 12.0% |
| 47 | Fenton, MI | 11,950 | 1,147 | 12.0% |
| 48 | Riverview, MI | 12,269 | 1,079 | 11.0% |
| 49 | St. Joseph, MI | 7,805 | 686 | 11.0% |
| 50 | Ishpeming, MI | 6,173 | 543 | 11.0% |
| 51 | Allen Park, MI | 28,128 | 2,475 | 11.0% |
| 52 | Dowagiac, MI | 5,677 | 499 | 11.0% |
| 53 | Ionia, MI | 12,950 | 1,139 | 11.0% |
| 54 | Dundee, MI | 5,584 | 491 | 11.0% |
| 55 | Westland, MI | 84,155 | 7,405 | 11.0% |
| 56 | St. Johns, MI | 7,712 | 678 | 11.0% |
| 57 | St. Clair, MI | 5,581 | 491 | 11.0% |
| 58 | Milford, MI | 6,467 | 569 | 11.0% |
| 59 | Rockford, MI | 6,162 | 542 | 11.0% |
| 60 | Eaton Rapids, MI | 5,197 | 457 | 11.0% |
| 61 | St. Clair Shores, MI | 58,287 | 5,129 | 11.0% |
| 62 | Utica, MI | 5,184 | 456 | 11.0% |
| 63 | Roseville, MI | 47,240 | 4,157 | 11.0% |
| 64 | Flint, MI | 80,835 | 7,113 | 11.0% |
| 65 | South Lyon, MI | 11,825 | 1,040 | 11.0% |
| 66 | River Rouge, MI | 7,092 | 624 | 11.0% |
| 67 | Petoskey, MI | 5,851 | 514 | 11.0% |
| 68 | Sault Ste. Marie, MI | 13,373 | 1,176 | 11.0% |
| 69 | Lincoln Park, MI | 39,511 | 3,476 | 11.0% |
| 70 | Tecumseh, MI | 8,655 | 692 | 10.0% |
| 71 | Southfield, MI | 76,025 | 6,082 | 10.0% |
| 72 | Walker, MI | 25,201 | 2,016 | 10.0% |
| 73 | Southgate, MI | 29,551 | 2,364 | 10.0% |
| 74 | Norton Shores, MI | 25,000 | 2,000 | 10.0% |
| 75 | Northville, MI | 6,080 | 486 | 10.0% |
| 76 | Monroe, MI | 20,330 | 1,626 | 10.0% |
| 77 | Marysville, MI | 9,942 | 795 | 10.0% |
| 78 | Saginaw, MI | 43,879 | 3,510 | 10.0% |
| 79 | Adrian, MI | 20,493 | 1,639 | 10.0% |
| 80 | Garden City, MI | 26,910 | 2,152 | 10.0% |
| 81 | Lansing, MI | 112,546 | 9,003 | 10.0% |
| 82 | Fraser, MI | 14,604 | 1,168 | 10.0% |
| 83 | Grand Blanc, MI | 7,995 | 639 | 10.0% |
| 84 | Hazel Park, MI | 14,945 | 1,195 | 10.0% |
| 85 | Highland Park, MI | 8,798 | 703 | 10.0% |
| 86 | Big Rapids, MI | 7,847 | 627 | 10.0% |
| 87 | Benton Harbor, MI | 9,023 | 721 | 10.0% |
| 88 | Niles, MI | 11,838 | 852 | 9.0% |
| 89 | Romulus, MI | 24,951 | 1,796 | 9.0% |
| 90 | Hillsdale, MI | 8,013 | 576 | 9.0% |
| 91 | Beverly Hills, MI | 10,507 | 756 | 9.0% |
| 92 | Holly, MI | 5,971 | 429 | 9.0% |
| 93 | Midland, MI | 42,461 | 3,057 | 9.0% |
| 94 | Oak Park, MI | 29,370 | 2,114 | 9.0% |
| 95 | Warren, MI | 138,128 | 9,945 | 9.0% |
| 96 | Pontiac, MI | 61,914 | 4,457 | 9.0% |
| 97 | Eastpointe, MI | 34,003 | 2,448 | 9.0% |
| 98 | Inkster, MI | 25,602 | 1,843 | 9.0% |
| 99 | Albion, MI | 7,608 | 547 | 9.0% |
| 100 | Royal Oak, MI | 57,880 | 4,167 | 9.0% |