
Cities with highest divorce rate in Missouri research summary. We used Saturday Night Science to analyze Missouri’s most recent Census data to determine the divorce rate for each city in Missouri based on the percentage of currently divorced residents. Here are the results of our analysis:
-
The city with the highest divorce rate in Missouri is De Soto based on the most recent Census data.
-
De Soto is 18.0% Divorced.
-
The city with the lowest divorce rate in Missouri is Clayton.
-
Clayton is 2.0% Divorced.
-
Missouri is 7.0% Divorced.
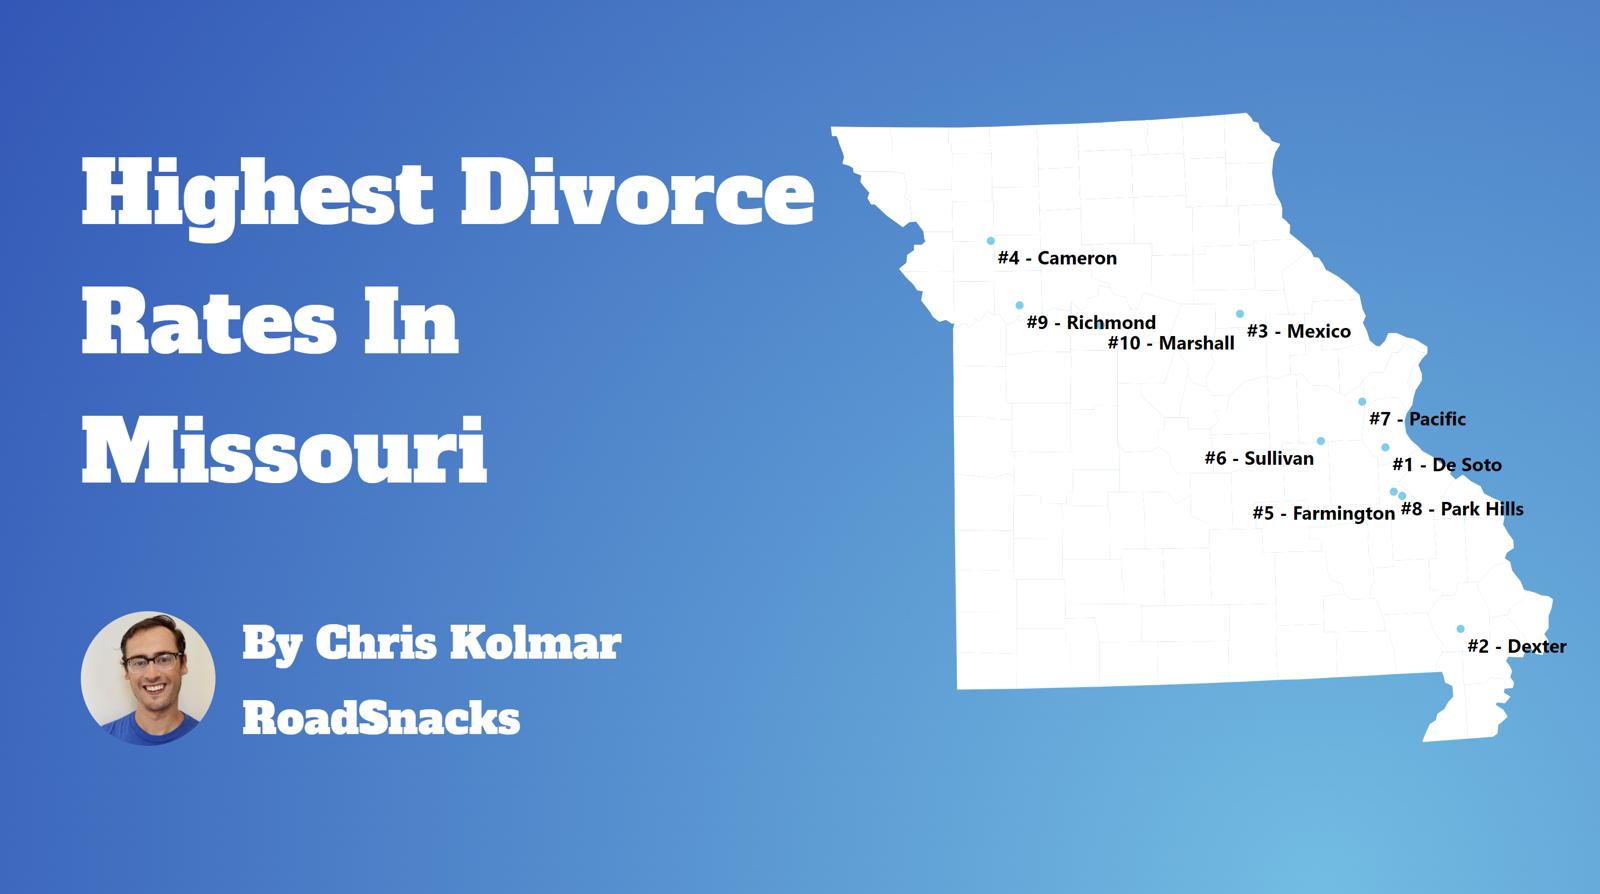
Table Of Contents: Top Ten | Methodology | Summary | Table
There are some 345,418 people living in Missouri over fifteen years of age who are divorced. You can compare that to the 28,339,199 Americans who are currently divorced in 2025.
Many people decide to run away – or split up – across the Show Me State.
Isn’t the divorce rate in America close to 50%? Yes indeed. But we’re measuring something else; we are looking at counts and percentages of people over 15 years old who are currently divorced. That 50% statistic is for the percentage of people who have ever been divorced.
For today’s analysis, the focus will be on the number of currently divorced people.
So now that we have you biting your nails, rethinking your worldview, and pulling out your hair, let’s look at the places in Missouri with the highest rates of divorcees.
The 10 Cities In Missouri With The Highest Divorce Rates
Let’s quickly recap before we dive into the Saturday Night Science behind the data.
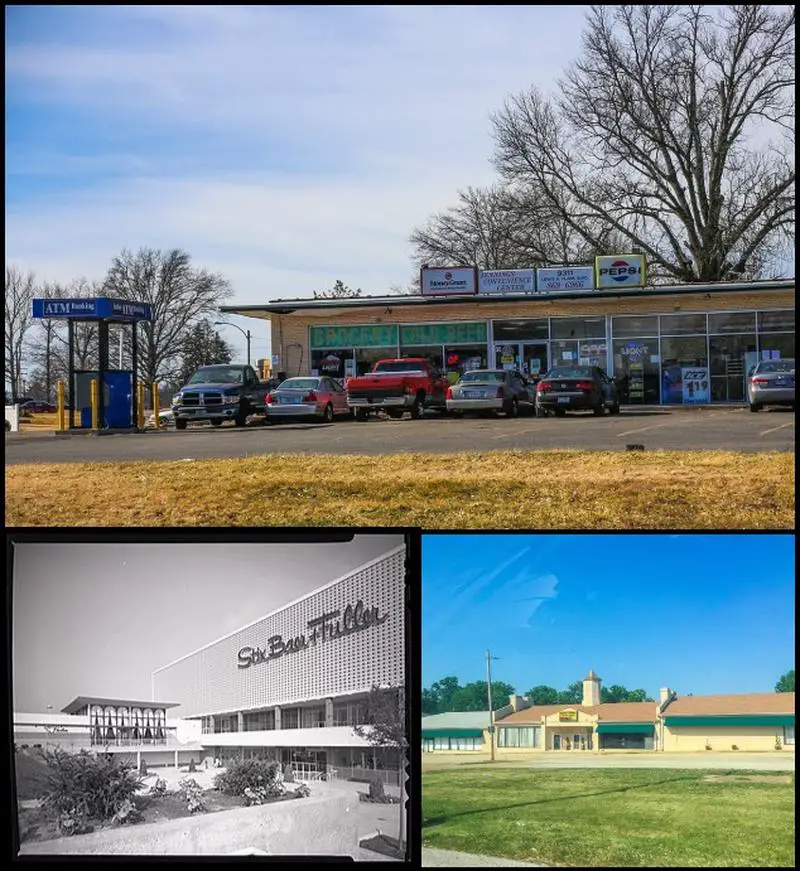
What is the city in Missouri with the highest divorce rate? That would be De Soto, with 18.0% of people over 15 years of age being divorced, per the most recent census data.
What is the overall Missouri divorce rate? According to the 2019-2023 Community Survey, the overall divorce rate in Missouri is 7.0%, which compares to the US divorce rate of 10.9%.
Alrighty, on to how we calculated the places with the highest divorce rates in Missouri.
For more Missouri reading, check out:
The 10 Places With The Highest Divorce Rate In Missouri For 2025

/10
Population: 6,452
Divorce Rate: 18.0%
Divorcees: 929
Median Income: $46,181
More on De Soto: Data

/10
Population: 7,331
Divorce Rate: 14.0%
Divorcees: 821
Median Income: $46,855
More on Aurora: Data

/10
Population: 17,999
Divorce Rate: 14.0%
Divorcees: 2,015
Median Income: $49,882
More on Farmington: Data

/10
Population: 8,721
Divorce Rate: 14.0%
Divorcees: 976
Median Income: $56,090
More on Cameron: Data

/10
Population: 6,773
Divorce Rate: 14.0%
Divorcees: 758
Median Income: $39,767
More on Bonne Terre: Data

/10
Population: 12,900
Divorce Rate: 13.0%
Divorcees: 1,341
Median Income: $37,356
More on Jennings: Data

/10
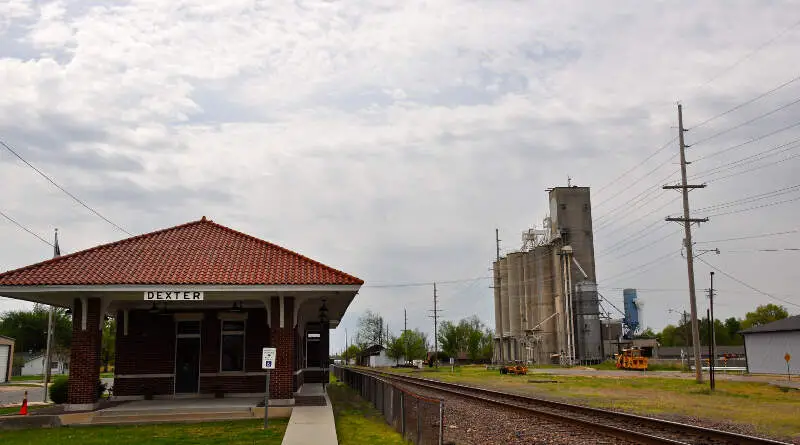
Population: 7,906
Divorce Rate: 13.0%
Divorcees: 822
Median Income: $47,647
More on Dexter: Data


/10
Population: 6,355
Divorce Rate: 13.0%
Divorcees: 660
Median Income: $60,137
More on Sullivan: Data

/10
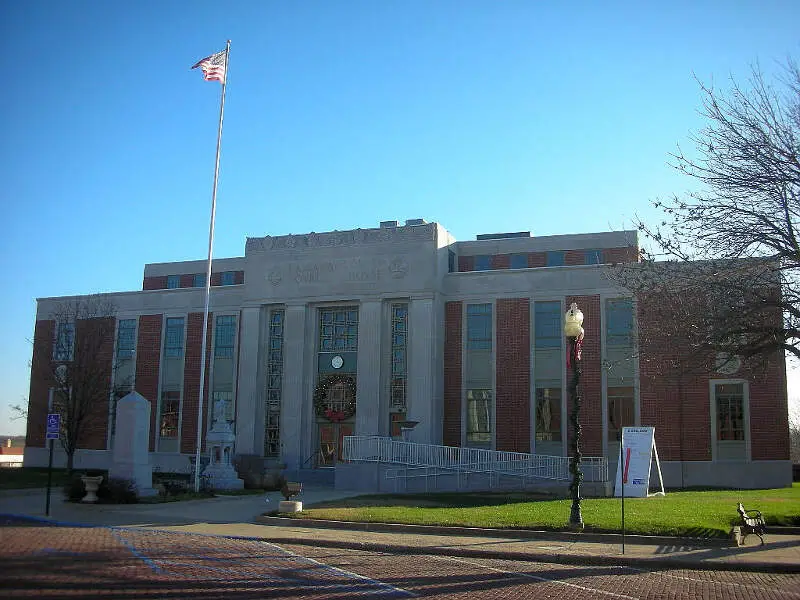
Population: 12,611
Divorce Rate: 12.0%
Divorcees: 1,210
Median Income: $55,015
More on Fulton: Data

/10
Population: 11,487
Divorce Rate: 12.0%
Divorcees: 1,102
Median Income: $48,873
More on Mexico: Data
How We Determined The Places In Missouri That Get Un-Hitched The Most
Since this is the 58th category of rankings we are compiling for the site, we had a pretty good idea of where to find data on marriage and divorce in America. We used Saturday Night Science to look at the U.S. Census Bureau on divorce rates. Because who likes tracking misery more than the U.S. government?
Specifically, we looked at the 2019-2023 American Community Survey table S1201 — Marital Status.
Pretty straightforward on that front — we just had to extract the following column of data:
- Population 15 Years and Over -> Divorced
There are some interesting/fun/sad data like .1% of female Americans aged 15-19 are divorced, but 0% of males (That’s probably a rounding issue, but still).
But the national data is for another day. Today, the analysis focuses on the 129 places in Missouri with a population of over 5,000.
We ranked each place by the percentage of divorcees over 15 years of age from highest to lowest. We crowned the divorce capital of Missouri the place with the highest incidence of divorcees, De Soto.
And if you’re trying to avoid divorce, check out Clayton, the city with the lowest divorce rate in Missouri.
We updated this article for 2025 and this list is our fifth time ranking the cities in Missouri with the highest divorce rates.
Getting Some Closure In Missouri After Untying The Know
Besides just coming up with what we thought would be a great new blog/book title, “Untying the Knot In Missouri: Life After Divorce,” we now have a sense of what places in the Show Me State don’t pay much attention to the whole “’til death do we part” phrase.
The cities with the highest divorce rate in Missouri are De Soto, Aurora, Farmington, Cameron, Bonne Terre, Jennings, Dexter, Sullivan, Fulton, and Mexico.
Try to keep in mind that the reason cities rank where they do in Missouri could be because of the age, education, and income distribution, as all of those things impact the rate of divorce.
And that’s probably for the best. Getting out of a toxic relationship is much better than staying in it.
Just make sure you have your running shoes ready to go.
For more Missouri reading, check out:
Cities With The Highest Divorce Rates In Missouri
| Rank | City | Population | Divorcees | Divorce Rate |
|---|---|---|---|---|
| 1 | De Soto, MO | 6,452 | 929 | 18.0% |
| 2 | Aurora, MO | 7,331 | 821 | 14.0% |
| 3 | Farmington, MO | 17,999 | 2,015 | 14.0% |
| 4 | Cameron, MO | 8,721 | 976 | 14.0% |
| 5 | Bonne Terre, MO | 6,773 | 758 | 14.0% |
| 6 | Jennings, MO | 12,900 | 1,341 | 13.0% |
| 7 | Dexter, MO | 7,906 | 822 | 13.0% |
| 8 | Sullivan, MO | 6,355 | 660 | 13.0% |
| 9 | Fulton, MO | 12,611 | 1,210 | 12.0% |
| 10 | Mexico, MO | 11,487 | 1,102 | 12.0% |
| 11 | Richmond, MO | 5,979 | 573 | 12.0% |
| 12 | St. Joseph, MO | 71,542 | 6,868 | 12.0% |
| 13 | Clinton, MO | 9,047 | 868 | 12.0% |
| 14 | St. John, MO | 6,562 | 577 | 11.0% |
| 15 | Moberly, MO | 13,634 | 1,199 | 11.0% |
| 16 | Bellefontaine Neighbors, MO | 10,562 | 929 | 11.0% |
| 17 | Pacific, MO | 7,299 | 642 | 11.0% |
| 18 | Ferguson, MO | 18,350 | 1,614 | 11.0% |
| 19 | Harrisonville, MO | 10,002 | 880 | 11.0% |
| 20 | Festus, MO | 12,965 | 1,140 | 11.0% |
| 21 | Berkeley, MO | 8,149 | 717 | 11.0% |
| 22 | Chillicothe, MO | 9,129 | 803 | 11.0% |
| 23 | Sedalia, MO | 21,869 | 1,924 | 11.0% |
| 24 | Marshall, MO | 13,699 | 1,095 | 10.0% |
| 25 | Macon, MO | 5,457 | 436 | 10.0% |
| 26 | Warrenton, MO | 8,870 | 709 | 10.0% |
| 27 | Lebanon, MO | 15,157 | 1,212 | 10.0% |
| 28 | Kennett, MO | 10,236 | 818 | 10.0% |
| 29 | Hannibal, MO | 16,825 | 1,346 | 10.0% |
| 30 | Florissant, MO | 51,915 | 4,153 | 10.0% |
| 31 | Nevada, MO | 7,998 | 639 | 10.0% |
| 32 | Oak Grove, MO | 8,477 | 678 | 10.0% |
| 33 | Boonville, MO | 7,682 | 614 | 10.0% |
| 34 | Park Hills, MO | 8,667 | 693 | 10.0% |
| 35 | Poplar Bluff, MO | 16,243 | 1,299 | 10.0% |
| 36 | Caruthersville, MO | 5,426 | 434 | 10.0% |
| 37 | Union, MO | 12,560 | 1,004 | 10.0% |
| 38 | St. Ann, MO | 12,865 | 1,029 | 10.0% |
| 39 | Wright City, MO | 5,025 | 402 | 10.0% |
| 40 | Odessa, MO | 5,589 | 402 | 9.0% |
| 41 | Overland, MO | 15,762 | 1,134 | 9.0% |
| 42 | Pevely, MO | 6,037 | 434 | 9.0% |
| 43 | Raytown, MO | 29,593 | 2,130 | 9.0% |
| 44 | West Plains, MO | 12,341 | 888 | 9.0% |
| 45 | Marshfield, MO | 7,599 | 547 | 9.0% |
| 46 | Shrewsbury, MO | 6,328 | 455 | 9.0% |
| 47 | Troy, MO | 13,467 | 969 | 9.0% |
| 48 | Valley Park, MO | 6,817 | 490 | 9.0% |
| 49 | Arnold, MO | 20,884 | 1,503 | 9.0% |
| 50 | Gladstone, MO | 27,069 | 1,948 | 9.0% |
| 51 | Hazelwood, MO | 25,214 | 1,815 | 9.0% |
| 52 | Independence, MO | 121,944 | 8,779 | 9.0% |
| 53 | Belton, MO | 24,618 | 1,772 | 9.0% |
| 54 | Republic, MO | 19,233 | 1,230 | 8.0% |
| 55 | Savannah, MO | 5,062 | 323 | 8.0% |
| 56 | Olivette, MO | 8,539 | 546 | 8.0% |
| 57 | Sikeston, MO | 16,231 | 1,038 | 8.0% |
| 58 | St. Louis, MO | 293,109 | 18,758 | 8.0% |
| 59 | Eureka, MO | 12,371 | 791 | 8.0% |
| 60 | Excelsior Springs, MO | 10,502 | 672 | 8.0% |
| 61 | St. Peters, MO | 58,200 | 3,724 | 8.0% |
| 62 | Bolivar, MO | 10,996 | 703 | 8.0% |
| 63 | Blue Springs, MO | 59,416 | 3,802 | 8.0% |
| 64 | Jackson, MO | 15,532 | 994 | 8.0% |
| 65 | Jefferson City, MO | 42,565 | 2,724 | 8.0% |
| 66 | Webb City, MO | 13,139 | 840 | 8.0% |
| 67 | Kearney, MO | 10,696 | 684 | 8.0% |
| 68 | Grain Valley, MO | 15,967 | 1,021 | 8.0% |
| 69 | Springfield, MO | 169,432 | 9,488 | 7.0% |
| 70 | Crestwood, MO | 12,298 | 688 | 7.0% |
| 71 | Joplin, MO | 52,218 | 2,924 | 7.0% |
| 72 | Kansas City, MO | 508,233 | 28,461 | 7.0% |
| 73 | Smithville, MO | 10,552 | 590 | 7.0% |
| 74 | St. Charles, MO | 71,048 | 3,978 | 7.0% |
| 75 | Perryville, MO | 8,530 | 477 | 7.0% |
| 76 | Greenwood, MO | 6,000 | 336 | 7.0% |
| 77 | Wentzville, MO | 45,734 | 2,561 | 7.0% |
| 78 | Kirkwood, MO | 29,302 | 1,640 | 7.0% |
| 79 | Washington, MO | 14,948 | 837 | 7.0% |
| 80 | Trenton, MO | 5,542 | 310 | 7.0% |
| 81 | Cape Girardeau, MO | 40,047 | 1,922 | 6.0% |
| 82 | Warrensburg, MO | 19,437 | 932 | 6.0% |
| 83 | Carthage, MO | 15,513 | 744 | 6.0% |
| 84 | Sunset Hills, MO | 9,113 | 437 | 6.0% |
| 85 | Richmond Heights, MO | 9,179 | 440 | 6.0% |
| 86 | Brentwood, MO | 8,151 | 391 | 6.0% |
| 87 | University City, MO | 34,655 | 1,663 | 6.0% |
| 88 | Pleasant Hill, MO | 8,853 | 424 | 6.0% |
| 89 | Lee’s Summit, MO | 102,583 | 4,923 | 6.0% |
| 90 | Liberty, MO | 30,446 | 1,461 | 6.0% |
| 91 | Nixa, MO | 24,131 | 1,158 | 6.0% |
| 92 | O’fallon, MO | 92,697 | 4,449 | 6.0% |
| 93 | Dardenne Prairie, MO | 13,137 | 630 | 6.0% |
| 94 | Maryland Heights, MO | 27,981 | 1,343 | 6.0% |
| 95 | Lake St. Louis, MO | 17,538 | 841 | 6.0% |
| 96 | Cottleville, MO | 5,750 | 276 | 6.0% |
| 97 | Kirksville, MO | 17,493 | 839 | 6.0% |
| 98 | Neosho, MO | 12,857 | 617 | 6.0% |
| 99 | Branson, MO | 12,760 | 510 | 5.0% |
| 100 | Maryville, MO | 10,556 | 422 | 5.0% |