
Now that we’re headed towards the next big election, we wanted to get a better sense of what parts of New Jersey would be the most likely to back Donald Trump again.
Specifically, which cities have the highest number of conservative voters in the Garden State?
To do so, we used Saturday Night Science to measure how each city in New Jersey with populations greater than 5,000 voted in past elections. The cities with the highest percentage of voters who voted Republican were named the most conservative cities in the state.
Table Of Contents: Top Ten | Methodology | Summary | Table
The 10 most conservative places in New Jersey for 2025
If you’re wondering, Short Hills is the most liberal city in New Jersey of all those we measured.
And to be clear, we didn’t form this list based on our own biases — we relied on the cold hard data. For more on how we ran the numbers, keep on reading. Then we’ll take a closer look at each of our top 10 most conservative cities in New Jersey.
Additional reading about New Jersey and the most conservative places in the country:
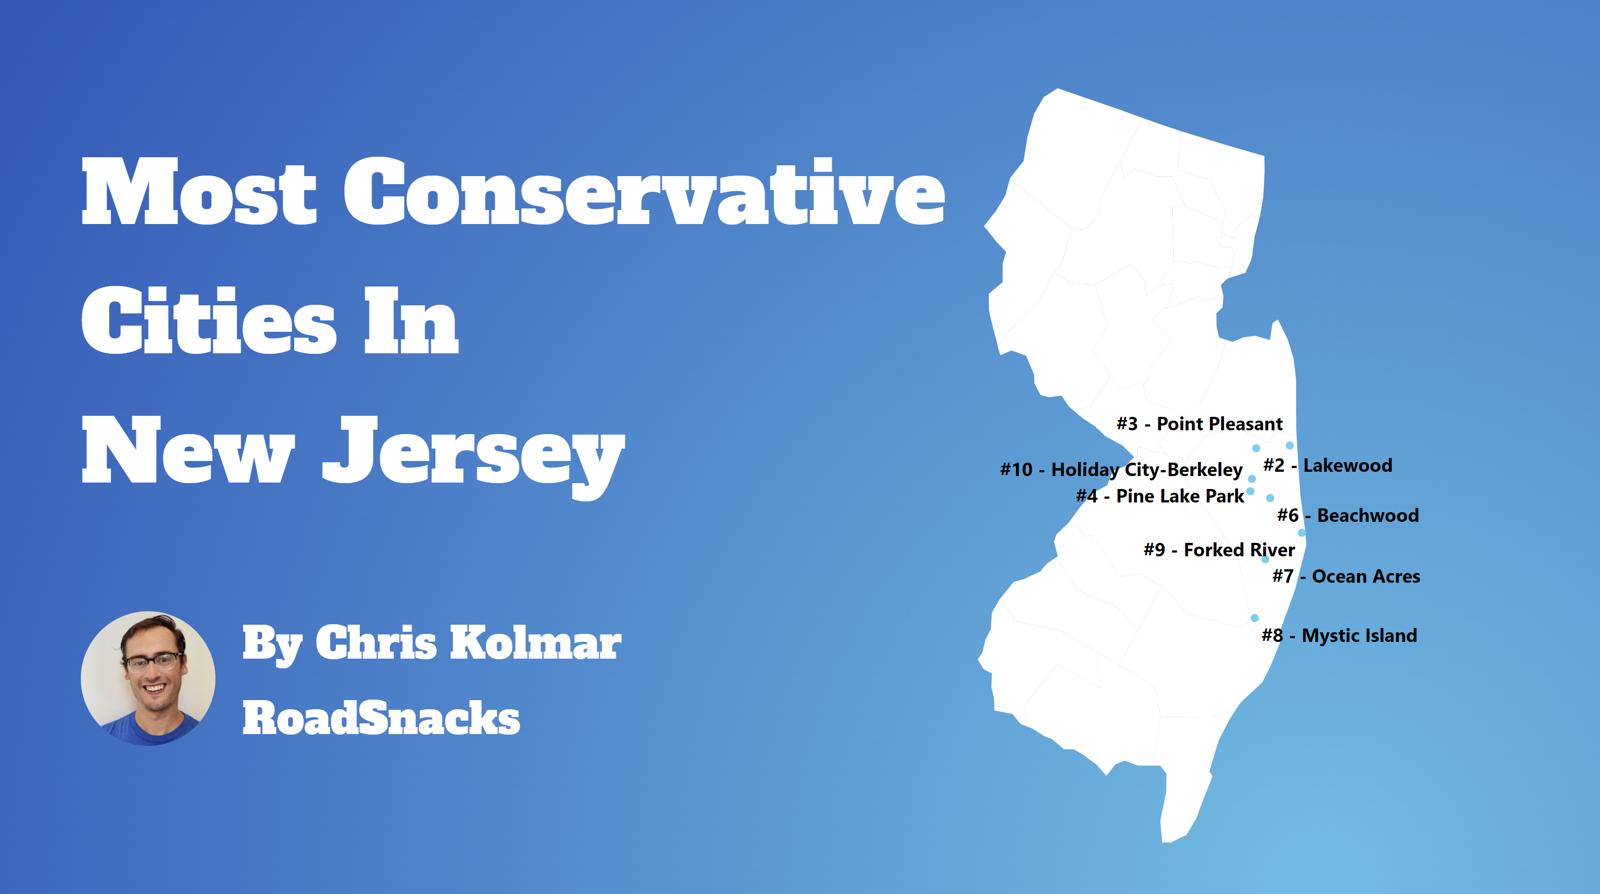
The 10 Most Conservative Places In New Jersey For 2025

/10
Percent Republican: 63.8%
More on Pine Lake Park: Data

/10
Percent Republican: 63.8%
More on Point Pleasant: Data

/10
Percent Republican: 63.8%
More on Crestwood Village: Data

/10
Percent Republican: 63.8%
More on Ocean Acres: Data

/10
Percent Republican: 63.8%
More on Beachwood: Data

/10
Percent Republican: 63.8%
More on Mystic Island: Data
/10
Percent Republican: 63.8%
More on Beach Haven West: Data

/10
Percent Republican: 63.8%
More on Lakewood: Data

/10
Percent Republican: 63.8%
More on Holiday City-Berkeley: Data
/10
Percent Republican: 63.8%
More on Leisure Village: Data
How we determined the most conservative cities in New Jersey for 2025
To find the most conservative places in New Jersey, we used Saturday Night Science – the argument you’d make at a bar – to find the cities with the most conservatives.
We started by making a list of every city in New Jersey over 5,000 people based on the 2019-2023 American Community Survey. That left us with 265 cities and towns.
We then measured the voting record and MIT election data to determine which places rock the most rightward in their allegiances by:
- Percentage Of Votes For The Republican President In 2020
Because no voting data exists at the city level, we used county-level election results from the 2020 election. We assigned every city in a county the percentage of votes that went to the Republicans, effectively extending the county’s results to the city level. In cases where larger cities encompassed an entire county, the election outcomes accurately reflected the city’s political landscape.
Next, we ranked each city from 1 to 265 for each criterion, where number one was the most conservative.
The winner, Pine Lake Park, is “The Most Conservative City in New Jersey For 2025”. The most liberal place in New Jersey was Short Hills.
We updated this article for 2025. This report is our tenth time ranking the most conservative places to live in New Jersey.
Summing Up The Conservative Strongholds in New Jersey
Well, there you have it, the places in New Jersey that have the highest number of conservatives per capita, with Pine Lake Park ranking as the most conservative in the entire state.
The most conservative cities in New Jersey are Pine Lake Park, Point Pleasant, Crestwood Village, Ocean Acres, Beachwood, Mystic Island, Beach Haven West, Lakewood, Holiday City-Berkeley, and Leisure Village.
If you’re curious, here are the least conservative cities in New Jersey:
- Short Hills
- Upper Montclair
- Glen Ridge
For more New Jersey reading, check out:
- Best Places To Live In New Jersey
- Cheapest Places To Live In New Jersey
- Most Dangerous Cities In New Jersey
- Richest Cities In New Jersey
- Safest Places In New Jersey
- Worst Places To Live In New Jersey
- Most Expensive Places To Live In New Jersey
Most Conservative Places In New Jersey
| Rank | City | Population | % Conservative |
|---|---|---|---|
| 1 | Pine Lake Park, NJ | 9,251 | 63.8% |
| 2 | Point Pleasant, NJ | 19,158 | 63.8% |
| 3 | Crestwood Village, NJ | 7,951 | 63.8% |
| 4 | Ocean Acres, NJ | 18,689 | 63.8% |
| 5 | Beachwood, NJ | 11,002 | 63.8% |
| 6 | Mystic Island, NJ | 7,616 | 63.8% |
| 7 | Beach Haven West, NJ | 5,164 | 63.8% |
| 8 | Lakewood, NJ | 69,884 | 63.8% |
| 9 | Holiday City-Berkeley, NJ | 12,896 | 63.8% |
| 10 | Leisure Village, NJ | 6,307 | 63.8% |
| 11 | Toms River, NJ | 93,915 | 63.8% |
| 12 | Newton, NJ | 8,336 | 58.8% |
| 13 | Lake Mohawk, NJ | 9,116 | 58.8% |
| 14 | Hopatcong, NJ | 14,470 | 58.8% |
| 15 | Ocean City, NJ | 11,260 | 57.5% |
| 16 | Villas, NJ | 9,897 | 57.5% |
| 17 | Cape May Court House, NJ | 5,375 | 57.5% |
| 18 | Wildwood, NJ | 5,140 | 57.5% |
| 19 | Phillipsburg, NJ | 15,251 | 57.2% |
| 20 | Hackett, NJ | 10,143 | 57.2% |
| 21 | Washington, NJ | 7,287 | 57.2% |
| 22 | Carneys Point, NJ | 7,945 | 55.5% |
| 23 | Salem, NJ | 5,315 | 55.5% |
| 24 | Pennsville, NJ | 12,238 | 55.5% |
| 25 | Asbury Park, NJ | 15,239 | 50.7% |
| 26 | Matawan, NJ | 9,636 | 50.7% |
| 27 | Belmar, NJ | 5,861 | 50.7% |
| 28 | Yorketown, NJ | 7,265 | 50.7% |
| 29 | Robertsville, NJ | 11,859 | 50.7% |
| 30 | Red Bank, NJ | 12,864 | 50.7% |
| 31 | Rumson, NJ | 7,265 | 50.7% |
| 32 | Ramtown, NJ | 6,410 | 50.7% |
| 33 | Union Beach, NJ | 5,722 | 50.7% |
| 34 | Keansburg, NJ | 9,729 | 50.7% |
| 35 | Strathmore, NJ | 6,593 | 50.7% |
| 36 | Freehold, NJ | 12,504 | 50.7% |
| 37 | Manasquan, NJ | 5,915 | 50.7% |
| 38 | Lincroft, NJ | 6,901 | 50.7% |
| 39 | Little Silver, NJ | 6,096 | 50.7% |
| 40 | Long Branch, NJ | 32,184 | 50.7% |
| 41 | Fair Haven, NJ | 6,182 | 50.7% |
| 42 | Morganville, NJ | 5,544 | 50.7% |
| 43 | Eato, NJ | 13,537 | 50.7% |
| 44 | West Long Branch, NJ | 8,576 | 50.7% |
| 45 | East Freehold, NJ | 5,381 | 50.7% |
| 46 | Tinton Falls, NJ | 19,252 | 50.7% |
| 47 | Oceanport, NJ | 6,130 | 50.7% |
| 48 | West Freehold, NJ | 14,233 | 50.7% |
| 49 | Keyport, NJ | 7,159 | 50.7% |
| 50 | Williamstown, NJ | 14,855 | 48.3% |
| 51 | Beckett, NJ | 5,072 | 48.3% |
| 52 | Glassboro, NJ | 23,375 | 48.3% |
| 53 | Woodbury, NJ | 9,992 | 48.3% |
| 54 | Paulsboro, NJ | 6,213 | 48.3% |
| 55 | Pitman, NJ | 8,834 | 48.3% |
| 56 | Clayton, NJ | 8,867 | 48.3% |
| 57 | Succasunna, NJ | 9,866 | 47.2% |
| 58 | Butler, NJ | 8,072 | 47.2% |
| 59 | Dover, NJ | 18,420 | 47.2% |
| 60 | Mount Arlington, NJ | 5,901 | 47.2% |
| 61 | Morristown, NJ | 20,256 | 47.2% |
| 62 | Morris Plains, NJ | 6,214 | 47.2% |
| 63 | Chatham, NJ | 9,219 | 47.2% |
| 64 | Rockaway, NJ | 6,589 | 47.2% |
| 65 | Budd Lake, NJ | 10,106 | 47.2% |
| 66 | Boonton, NJ | 8,803 | 47.2% |
| 67 | Kinnelon, NJ | 9,971 | 47.2% |
| 68 | Madison, NJ | 16,464 | 47.2% |
| 69 | Wharton, NJ | 7,254 | 47.2% |
| 70 | White Meadow Lake, NJ | 8,706 | 47.2% |
| 71 | Florham Park, NJ | 13,134 | 47.2% |
| 72 | Lincoln Park, NJ | 10,901 | 47.2% |
| 73 | Millville, NJ | 27,432 | 46.4% |
| 74 | Vineland, NJ | 60,692 | 46.4% |
| 75 | Bridgeton, NJ | 26,836 | 46.4% |
| 76 | Atlantic City, NJ | 38,486 | 46.0% |
| 77 | Brigantine, NJ | 7,702 | 46.0% |
| 78 | Absecon, NJ | 9,099 | 46.0% |
| 79 | Margate City, NJ | 5,260 | 46.0% |
| 80 | Northfield, NJ | 8,427 | 46.0% |
| 81 | Mays Landing, NJ | 6,178 | 46.0% |
| 82 | Linwood, NJ | 6,954 | 46.0% |
| 83 | Smithville, NJ | 9,260 | 46.0% |
| 84 | Pomona, NJ | 8,141 | 46.0% |
| 85 | Hammonton, NJ | 14,746 | 46.0% |
| 86 | Somers Point, NJ | 10,461 | 46.0% |
| 87 | Ventnor City, NJ | 9,220 | 46.0% |
| 88 | Pleasantville, NJ | 20,604 | 46.0% |
| 89 | Allendale, NJ | 6,820 | 41.2% |
| 90 | Woodcliff Lake, NJ | 6,097 | 41.2% |
| 91 | Hackensack, NJ | 45,768 | 41.2% |
| 92 | Hillsdale, NJ | 10,086 | 41.2% |
| 93 | Rutherford, NJ | 18,748 | 41.2% |
| 94 | Carlstadt, NJ | 6,343 | 41.2% |
| 95 | Wood-Ridge, NJ | 10,094 | 41.2% |
| 96 | Oradell, NJ | 8,197 | 41.2% |
| 97 | Dumont, NJ | 18,072 | 41.2% |
| 98 | Lodi, NJ | 25,946 | 41.2% |
| 99 | Westwood, NJ | 11,221 | 41.2% |
| 100 | Fort Lee, NJ | 39,818 | 41.2% |