
Historical KKK locations in Oklahoma research summary. We analyzed research using Saturday Night Science from the Virginia Commonwealth University that mapped Klaverns by city from 1915-1940. This report analyzes the locations of historic KKK organizations to see where they were the most prevalent in Oklahoma.
- The city in Oklahoma with the most number of Klaverns was El Reno with 2 Klaverns.
- The city in Oklahoma with the most number of Klaverns per capita was Shamrock with 0.0196 Klaverns.
- There were historically 97 Klaverns in Oklahoma.
- There were a total of 96 places in Oklahoma with at least 1 Klavern during the period of reference.
Hate groups can be hard to measure because, typically, there’s no record of where they exist. But there is data on where there were distinct Klaverns of the Ku Klux Klan in each state. These cities have historically been the most racist in Oklahoma based on the number of KKK Klaverns.
This report does not speak to the current people who live there or the current state of the KKK in the same towns or areas.
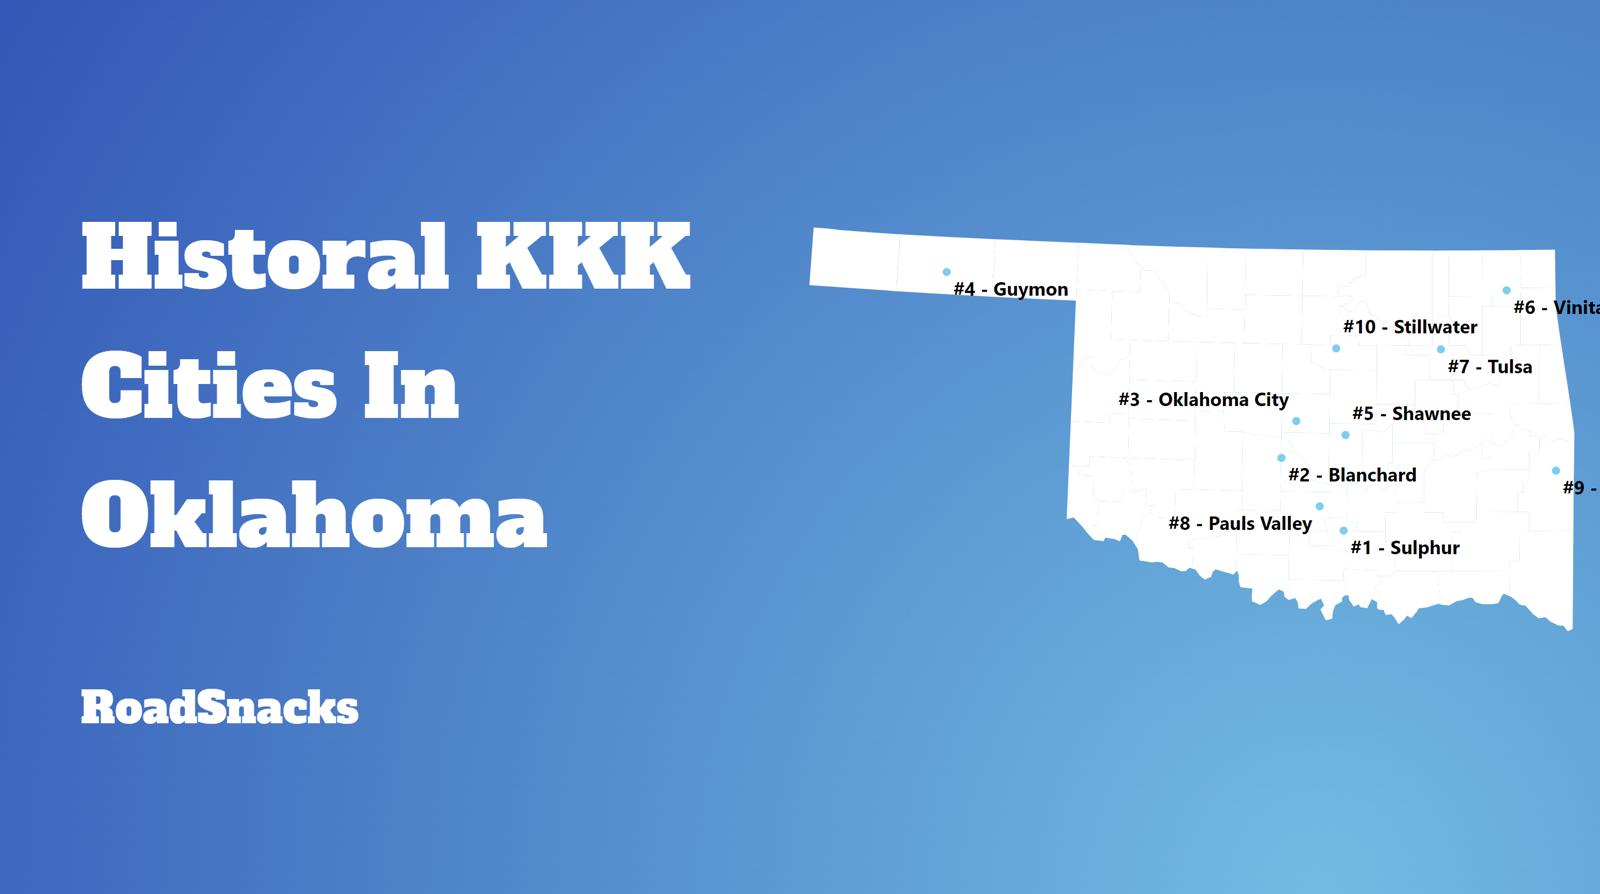
Table Of Contents: Top Ten | Methodology | Summary | Table
A quick history lesson on the KKK
What is the KKK? In a nutshell, the KKK was formed back in 1865, and there have been three separate movements, all three of which were supposedly ‘purification movements’ in America. The 1865-1870s movement sought to overthrow Republican state governments.
The second movement (1915 – 1944) saw millions of members of the KKK form, which was opposed to immigration into America, especially against Catholics and Jews.
The most memorable movement of the KKK started in the 1950s, which was involved in the Civil Rights movement and targeted the black population in America.
The number of active members of the KKK is much smaller these days.
The cities below are the places where there were Klans back in the day and where the number of Klans per the current population is high. This means the number of racist members of the community has historically been the highest, according to the math.
The 10 Most Historically Racist Places In Oklahoma
- Shamrock
- Elmer
- Tuskahoma
- Devol
- Camargo
- Ames
- Caney
- Kaw City
- Bennington
- Wakita
This report is an analysis of the locations of historic KKK organizations divided by the number of people who currently live there.
For more Oklahoma reading, check out:
Methodology: How We Measured The Most Historically Racist Places In The Sooner State
While there are surveys and public polls on what places might be the most racist, we didn’t want to rely on speculation and opinion. Instead, we looked at the hard numbers from where KKK organizations have existed.
Specifically, we analyzed research out of Virginia Commonwealth University that mapped the Klans in each area and gave a history of their recruitment from 1915-1940.
Using Saturday Night Science, we analyzed the locations of historic KKK organizations per capita using current population data.
There You Have It – The Most Historically Racist Cities In Oklahoma
When you’re looking at the places in Oklahoma with the highest number of historical KKK Klaverns per capita, this is an accurate list.
Below is a chart that lists all cities in Oklahoma with at least one KKK organization from 1915-1940.
The cities with the largest number of KKK klaverns per capita were Shamrock, Elmer, Tuskahoma, Devol, Camargo, Ames, Caney, Kaw City, Bennington, and Wakita.
For more Oklahoma reading, check out:
- Best Places To Live In Oklahoma
- Cheapest Places To Live In Oklahoma
- Most Dangerous Cities In Oklahoma
- Richest Cities In Oklahoma
- Safest Places In Oklahoma
- Worst Places To Live In Oklahoma
- Most Expensive Places To Live In Oklahoma
Cities With Hisoritcally High KKK Membership In Oklahoma
| Rank | City | Population | Klans | Klans Per Capita |
|---|---|---|---|---|
| 1 | Shamrock, OK | 51 | 1 | 0.01960784 |
| 2 | Elmer, OK | 111 | 1 | 0.00900901 |
| 3 | Tuskahoma, OK | 138 | 1 | 0.00724638 |
| 4 | Devol, OK | 154 | 1 | 0.00649351 |
| 5 | Camargo, OK | 204 | 1 | 0.00490196 |
| 6 | Ames, OK | 254 | 1 | 0.00393701 |
| 7 | Caney, OK | 258 | 1 | 0.00387597 |
| 8 | Kaw City, OK | 277 | 1 | 0.00361011 |
| 9 | Bennington, OK | 285 | 1 | 0.00350877 |
| 10 | Wakita, OK | 335 | 1 | 0.00298507 |
| 11 | Avant, OK | 369 | 1 | 0.00271003 |
| 12 | Wapanucka, OK | 389 | 1 | 0.00257069 |
| 13 | Shidler, OK | 402 | 1 | 0.00248756 |
| 14 | Chattanooga, OK | 422 | 1 | 0.00236967 |
| 15 | Wynona, OK | 431 | 1 | 0.00232019 |
| 16 | Mccurtain, OK | 450 | 1 | 0.00222222 |
| 17 | Billings, OK | 487 | 1 | 0.00205339 |
| 18 | Ramona, OK | 503 | 1 | 0.00198807 |
| 19 | Kiowa, OK | 536 | 1 | 0.00186567 |
| 20 | Binger, OK | 606 | 1 | 0.00165017 |
| 21 | Haileyville, OK | 698 | 1 | 0.00143266 |
| 22 | Garber, OK | 720 | 1 | 0.00138889 |
| 23 | Boswell, OK | 729 | 1 | 0.00137174 |
| 24 | Roff, OK | 809 | 1 | 0.00123609 |
| 25 | Ringling, OK | 960 | 1 | 0.00104167 |
| 26 | Allen, OK | 990 | 1 | 0.0010101 |
| 27 | Weleetka, OK | 997 | 1 | 0.00100301 |
| 28 | Quinton, OK | 1,027 | 1 | 0.00097371 |
| 29 | Beggs, OK | 1,127 | 1 | 0.00088731 |
| 30 | Yale, OK | 1,169 | 1 | 0.00085543 |
| 31 | Oilton, OK | 1,188 | 1 | 0.00084175 |
| 32 | Caddo, OK | 1,203 | 1 | 0.00083126 |
| 33 | Temple, OK | 1,208 | 1 | 0.00082781 |
| 34 | Locust Grove, OK | 1,307 | 1 | 0.00076511 |
| 35 | Minco, OK | 1,423 | 1 | 0.00070274 |
| 36 | Cherokee, OK | 1,557 | 1 | 0.00064226 |
| 37 | Morris, OK | 1,606 | 1 | 0.00062267 |
| 38 | Wilson, OK | 1,611 | 1 | 0.00062073 |
| 39 | Comanche, OK | 1,655 | 1 | 0.00060423 |
| 40 | Chelsea, OK | 1,892 | 1 | 0.00052854 |
| 41 | Kiefer, OK | 2,005 | 1 | 0.00049875 |
| 42 | Carnegie, OK | 2,021 | 1 | 0.0004948 |
| 43 | Hollis, OK | 2,110 | 1 | 0.00047393 |
| 44 | Pawnee, OK | 2,247 | 1 | 0.00044504 |
| 45 | Newkirk, OK | 2,297 | 1 | 0.00043535 |
| 46 | Antlers, OK | 2,437 | 1 | 0.00041034 |
| 47 | Spiro, OK | 2,502 | 1 | 0.00039968 |
| 48 | Hennessey, OK | 2,508 | 1 | 0.00039872 |
| 49 | Healdton, OK | 2,779 | 1 | 0.00035984 |
| 50 | Drumright, OK | 2,926 | 1 | 0.00034176 |
| 51 | Mangum, OK | 2,947 | 1 | 0.00033933 |
| 52 | Watonga, OK | 2,993 | 1 | 0.00033411 |
| 53 | Atoka, OK | 3,093 | 1 | 0.00032331 |
| 54 | Tonkawa, OK | 3,144 | 1 | 0.00031807 |
| 55 | Cleveland, OK | 3,238 | 1 | 0.00030883 |
| 56 | Checotah, OK | 3,343 | 1 | 0.00029913 |
| 57 | Muldrow, OK | 3,375 | 1 | 0.0002963 |
| 58 | Heavener, OK | 3,397 | 1 | 0.00029438 |
| 59 | Dewey, OK | 3,476 | 1 | 0.00028769 |
| 60 | Pawhuska, OK | 3,679 | 1 | 0.00027181 |
| 61 | Hobart, OK | 3,729 | 1 | 0.00026817 |
| 62 | Nowata, OK | 3,734 | 1 | 0.00026781 |
| 63 | Sulphur, OK | 4,996 | 1 | 0.00020016 |
| 64 | Perry, OK | 5,087 | 1 | 0.00019658 |
| 65 | Hugo, OK | 5,294 | 1 | 0.00018889 |
| 66 | Vinita, OK | 5,637 | 1 | 0.0001774 |
| 67 | Henryetta, OK | 5,848 | 1 | 0.000171 |
| 68 | Grove, OK | 6,658 | 1 | 0.0001502 |
| 69 | Anadarko, OK | 6,786 | 1 | 0.00014736 |
| 70 | Blackwell, OK | 6,957 | 1 | 0.00014374 |
| 71 | Idabel, OK | 7,015 | 1 | 0.00014255 |
| 72 | Seminole, OK | 7,493 | 1 | 0.00013346 |
| 73 | Skiatook, OK | 7,571 | 1 | 0.00013208 |
| 74 | Cushing, OK | 7,870 | 1 | 0.00012706 |
| 75 | Wagoner, OK | 8,499 | 1 | 0.00011766 |
| 76 | Poteau, OK | 8,563 | 1 | 0.00011678 |
| 77 | El Reno, OK | 17,515 | 2 | 0.00011419 |
| 78 | Coweta, OK | 9,483 | 1 | 0.00010545 |
| 79 | Guthrie, OK | 10,668 | 1 | 9.374e-05 |
| 80 | Elk City, OK | 12,198 | 1 | 8.198e-05 |
| 81 | Okmulgee, OK | 12,398 | 1 | 8.066e-05 |
| 82 | Chickasha, OK | 16,195 | 1 | 6.175e-05 |
| 83 | Durant, OK | 16,507 | 1 | 6.058e-05 |
| 84 | Ada, OK | 17,061 | 1 | 5.861e-05 |
| 85 | Jenks, OK | 18,312 | 1 | 5.461e-05 |
| 86 | Mcalester, OK | 18,354 | 1 | 5.448e-05 |
| 87 | Claremore, OK | 18,849 | 1 | 5.305e-05 |
| 88 | Ponca City, OK | 24,951 | 1 | 4.008e-05 |
| 89 | Bartlesville, OK | 36,193 | 1 | 2.763e-05 |
| 90 | Muskogee, OK | 38,937 | 1 | 2.568e-05 |
| 91 | Stillwater, OK | 46,851 | 1 | 2.134e-05 |
| 92 | Enid, OK | 50,232 | 1 | 1.991e-05 |
| 93 | Lawton, OK | 97,788 | 1 | 1.023e-05 |
| 94 | Broken Arrow, OK | 101,917 | 1 | 9.81e-06 |
| 95 | Tulsa, OK | 395,599 | 1 | 2.53e-06 |
| 96 | Oklahoma City, OK | 600,729 | 1 | 1.66e-06 |