
Cities with highest divorce rate in New Hampshire research summary. We used Saturday Night Science to analyze New Hampshire’s most recent Census data to determine the divorce rate for each city in New Hampshire based on the percentage of currently divorced residents. Here are the results of our analysis:
-
The city with the highest divorce rate in New Hampshire is Newport based on the most recent Census data.
-
Newport is 13.0% Divorced.
-
The city with the lowest divorce rate in New Hampshire is Durham.
-
Durham is 0.0% Divorced.
-
New Hampshire is 4.0% Divorced.
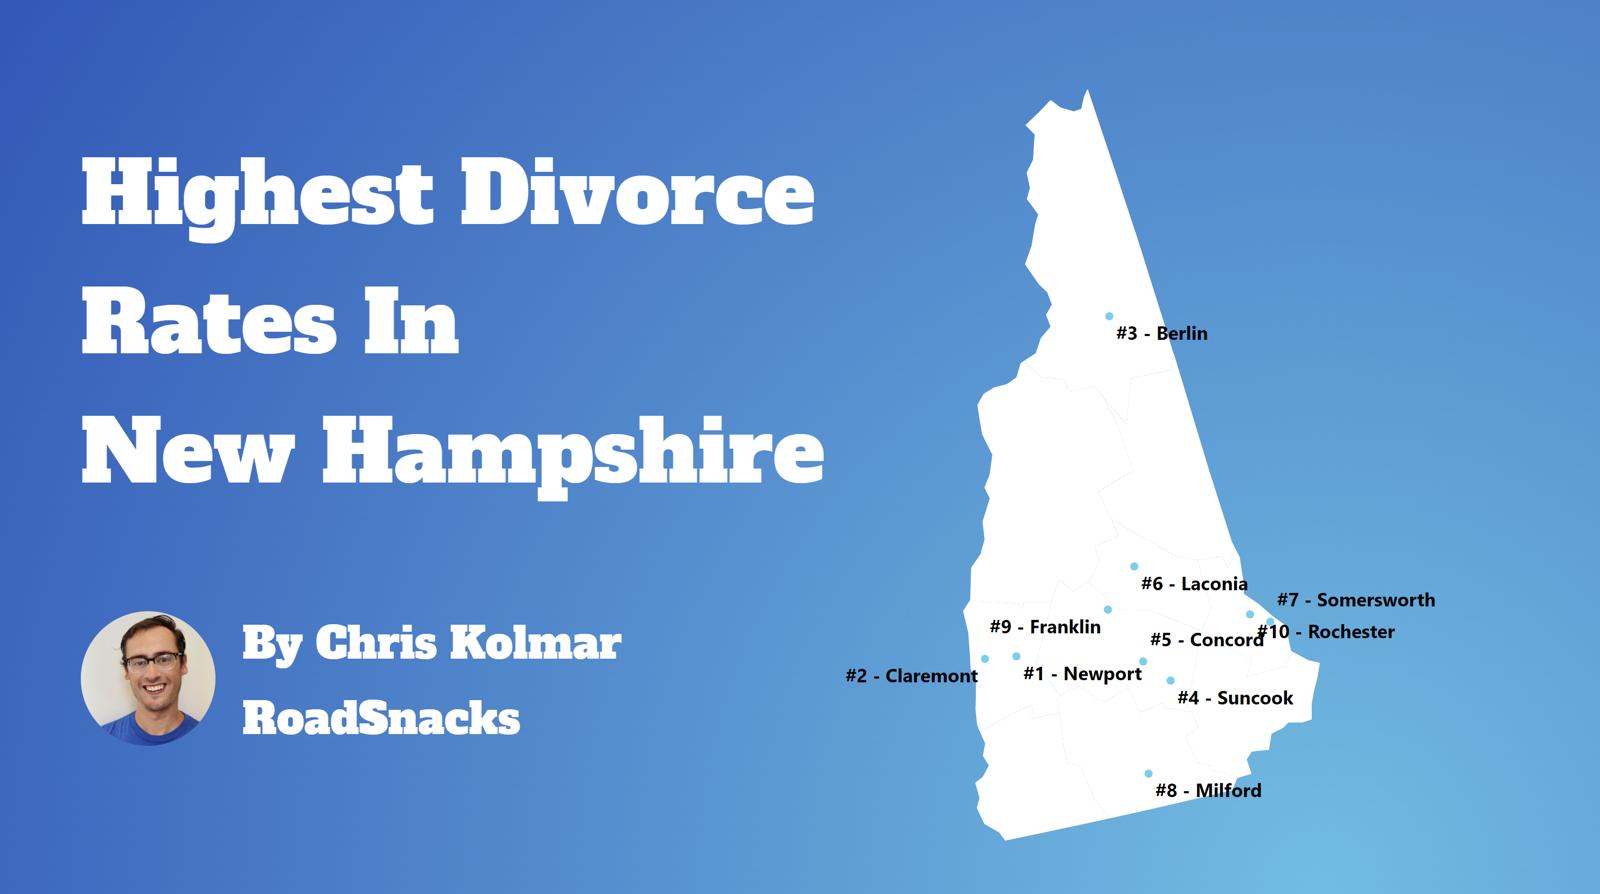
Table Of Contents: Top Ten | Methodology | Summary | Table
There are some 44,410 people living in New Hampshire over fifteen years of age who are divorced. You can compare that to the 28,339,199 Americans who are currently divorced in 2025.
Many people decide to run away – or split up – across the Granite State.
Isn’t the divorce rate in America close to 50%? Yes indeed. But we’re measuring something else; we are looking at counts and percentages of people over 15 years old who are currently divorced. That 50% statistic is for the percentage of people who have ever been divorced.
For today’s analysis, the focus will be on the number of currently divorced people.
So now that we have you biting your nails, rethinking your worldview, and pulling out your hair, let’s look at the places in New Hampshire with the highest rates of divorcees.
Let’s quickly recap before we dive into the Saturday Night Science behind the data.
What is the city in New Hampshire with the highest divorce rate? That would be Newport, with 13.0% of people over 15 years of age being divorced, per the most recent census data.
What is the overall New Hampshire divorce rate? According to the 2019-2023 Community Survey, the overall divorce rate in New Hampshire is 4.0%, which compares to the US divorce rate of 10.9%.
Alrighty, on to how we calculated the places with the highest divorce rates in New Hampshire.
For more New Hampshire reading, check out:
- Best Places To Raise A Family In New Hampshire
- Richest Cities In New Hampshire
- Worst Places To Live In New Hampshire
The 10 Places With The Highest Divorce Rate In New Hampshire For 2025
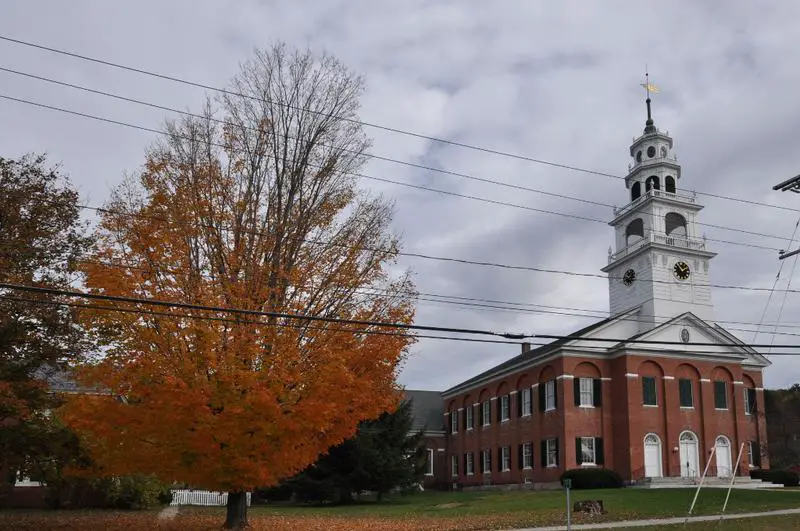
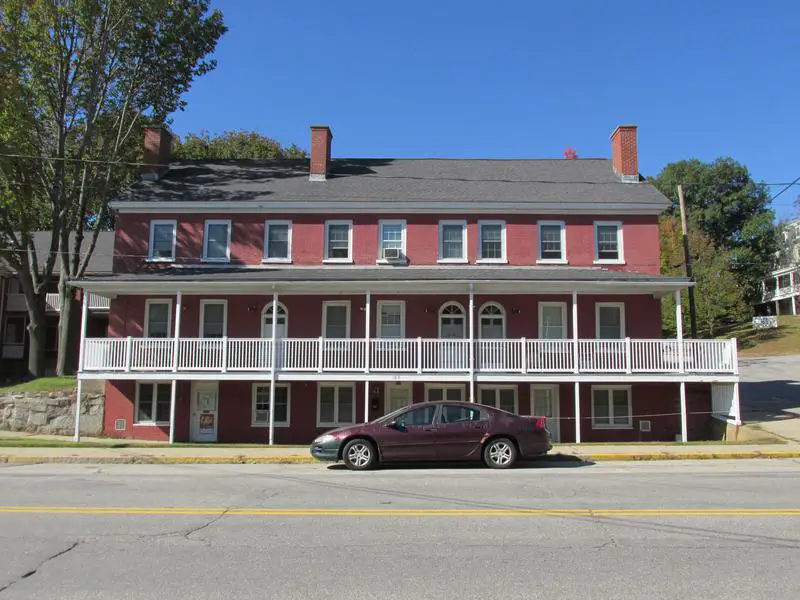
1. Newport
/10
Population: 5,185
Divorce Rate: 13.0%
Divorcees: 539
Median Income: $75,849
More on Newport:
/10
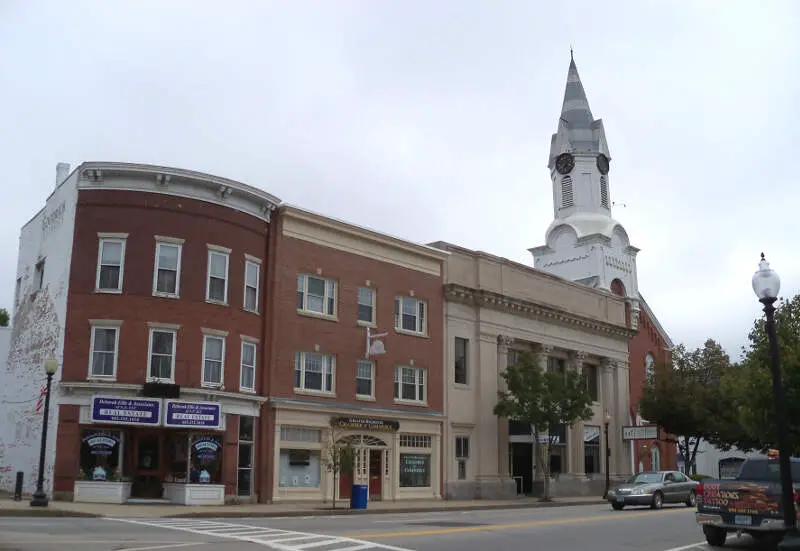
Population: 5,075
Divorce Rate: 10.0%
Divorcees: 406
Median Income: $73,109
More on Suncook: Data


/10
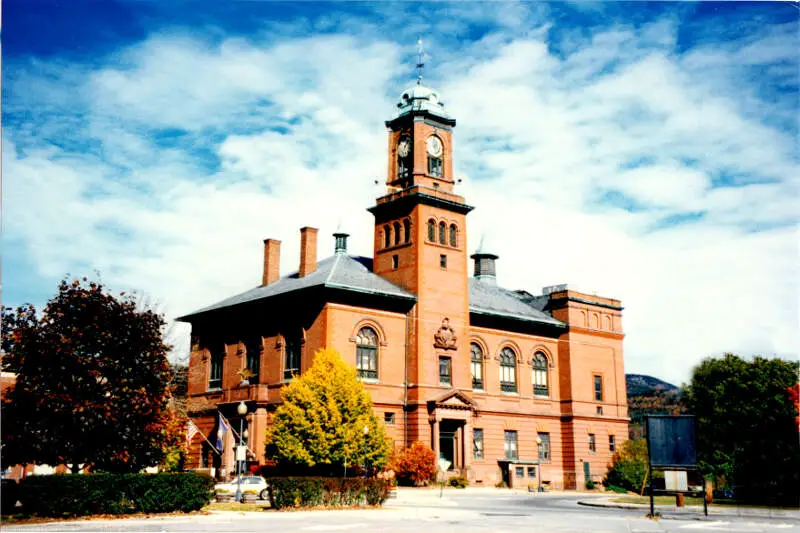
Population: 9,473
Divorce Rate: 9.0%
Divorcees: 682
Median Income: $43,972
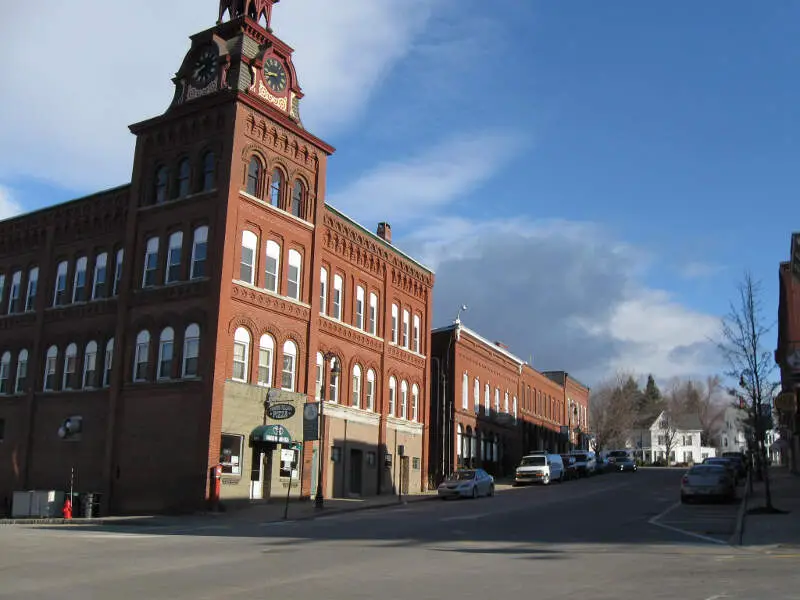
More on Berlin: Data

/10
Population: 44,219
Divorce Rate: 7.0%
Divorcees: 2,476
Median Income: $83,701
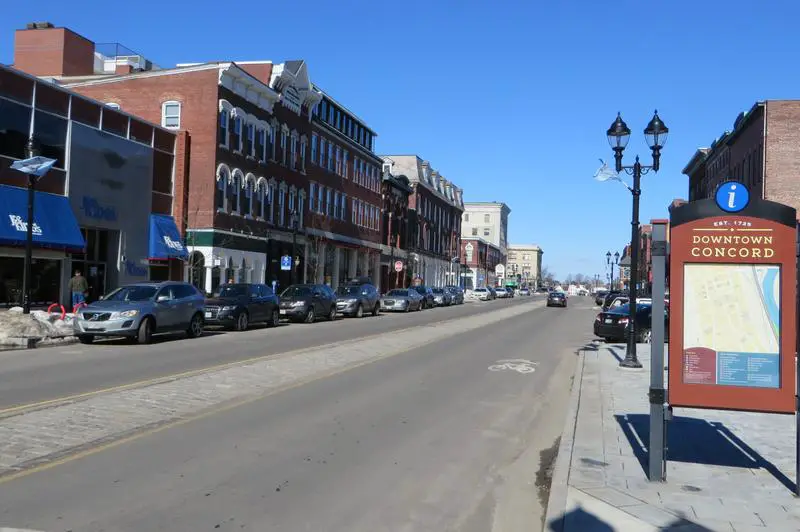
More on Concord: Data
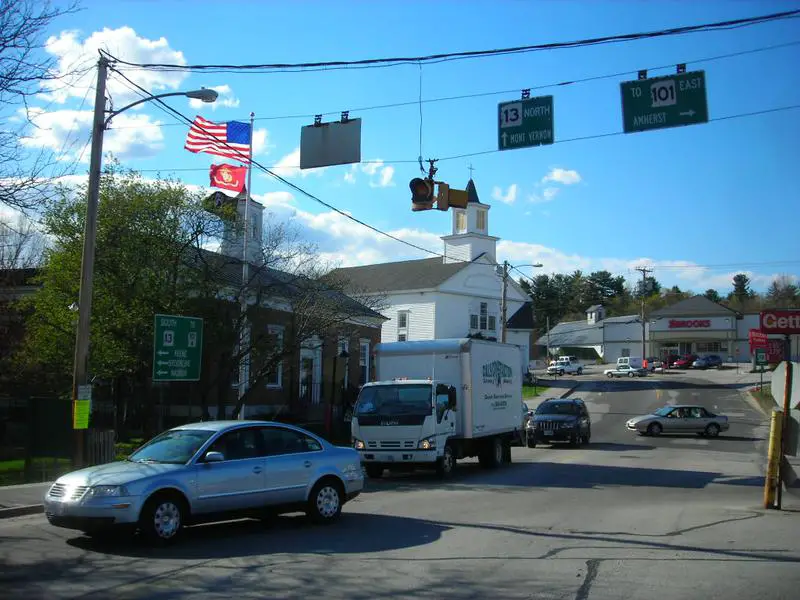
5. Somersworth

/10
Population: 12,060
Divorce Rate: 6.0%
Divorcees: 578
Median Income: $79,677
More on Somersworth:
6. Rochester

/10
Population: 32,866
Divorce Rate: 6.0%
Divorcees: 1,577
Median Income: $79,388
More on Rochester:

/10
Population: 13,054
Divorce Rate: 6.0%
Divorcees: 626
Median Income: $54,520
More on Claremont: Data
8. Hooksett
/10
Population: 5,362
Divorce Rate: 6.0%
Divorcees: 257
Median Income: $91,005
More on Hooksett:


/10
Population: 14,759
Divorce Rate: 5.0%
Divorcees: 590
Median Income: $92,288
More on Lebanon: Data

/10
Population: 8,857
Divorce Rate: 5.0%
Divorcees: 354
Median Income: $81,042
More on Milford: Data
How We Determined The Places In New Hampshire That Get Un-Hitched The Most
Since this is the 58th category of rankings we are compiling for the site, we had a pretty good idea of where to find data on marriage and divorce in America. We used Saturday Night Science to look at the U.S. Census Bureau on divorce rates. Because who likes tracking misery more than the U.S. government?
Specifically, we looked at the 2019-2023 American Community Survey table S1201 — Marital Status.
Pretty straightforward on that front — we just had to extract the following column of data:
- Population 15 Years and Over -> Divorced
There are some interesting/fun/sad data like .1% of female Americans aged 15-19 are divorced, but 0% of males (That’s probably a rounding issue, but still).
But the national data is for another day. Today, the analysis focuses on the 26 places in New Hampshire with a population of over 5,000.
We ranked each place by the percentage of divorcees over 15 years of age from highest to lowest. We crowned the divorce capital of New Hampshire the place with the highest incidence of divorcees, Newport.
And if you’re trying to avoid divorce, check out Durham, the city with the lowest divorce rate in New Hampshire.
We updated this article for 2025 and this list is our fifth time ranking the cities in New Hampshire with the highest divorce rates.
Getting Some Closure In New Hampshire After Untying The Know
Besides just coming up with what we thought would be a great new blog/book title, “Untying the Knot In New Hampshire: Life After Divorce,” we now have a sense of what places in the Granite State don’t pay much attention to the whole “’til death do we part” phrase.
The cities with the highest divorce rate in New Hampshire are Newport, Suncook, Berlin, Concord, Somersworth, Rochester, Claremont, Hooksett, Lebanon, and Milford.
Try to keep in mind that the reason cities rank where they do in New Hampshire could be because of the age, education, and income distribution, as all of those things impact the rate of divorce.
And that’s probably for the best. Getting out of a toxic relationship is much better than staying in it.
Just make sure you have your running shoes ready to go.
For more New Hampshire reading, check out:
- Best Places To Raise A Family In New Hampshire
- Richest Cities In New Hampshire
- Worst Places To Live In New Hampshire
Cities With The Highest Divorce Rates In New Hampshire
| Rank | City | Population | Divorcees | Divorce Rate |
|---|---|---|---|---|
| 1 | Newport, NH | 5,185 | 539 | 13.0% |
| 2 | Suncook, NH | 5,075 | 406 | 10.0% |
| 3 | Berlin, NH | 9,473 | 682 | 9.0% |
| 4 | Concord, NH | 44,219 | 2,476 | 7.0% |
| 5 | Somersworth, NH | 12,060 | 578 | 6.0% |
| 6 | Rochester, NH | 32,866 | 1,577 | 6.0% |
| 7 | Claremont, NH | 13,054 | 626 | 6.0% |
| 8 | Hooksett, NH | 5,362 | 257 | 6.0% |
| 9 | Lebanon, NH | 14,759 | 590 | 5.0% |
| 10 | Milford, NH | 8,857 | 354 | 5.0% |
| 11 | Manchester, NH | 115,415 | 4,616 | 5.0% |
| 12 | Laconia, NH | 16,982 | 679 | 5.0% |
| 13 | Keene, NH | 22,923 | 916 | 5.0% |
| 14 | Franklin, NH | 8,757 | 350 | 5.0% |
| 15 | Hudson, NH | 7,105 | 227 | 4.0% |
| 16 | Exeter, NH | 10,138 | 324 | 4.0% |
| 17 | Portsmouth, NH | 22,332 | 714 | 4.0% |
| 18 | Dover, NH | 33,070 | 1,058 | 4.0% |
| 19 | South Hooksett, NH | 5,806 | 185 | 4.0% |
| 20 | Hampton, NH | 9,960 | 239 | 3.0% |
| 21 | Nashua, NH | 91,131 | 2,187 | 3.0% |
| 22 | Newmarket, NH | 5,730 | 137 | 3.0% |
| 23 | Hanover, NH | 8,520 | 68 | 1.0% |
| 24 | Londonderry, NH | 12,307 | 98 | 1.0% |
| 25 | Derry, NH | 21,668 | 173 | 1.0% |
| 26 | Durham, NH | 10,577 | 0 | 0.0% |