
Like all states, South Carolina has certain places that are going on hard times. These South Carolina places have an above-average percentage of people living in poverty, out of work, or not making as much as they should be.
Even as the economy continues to improve, it’s worthwhile to look at the places in each state struggling to make ends meet. So we set our sites on locating the poorest places in South Carolina.
To do so, we used Saturday Night Science to analyze the newest Census data from the American Community Survey for the 65 cities in South Carolina with more than 5,000 people.
Table Of Contents: Top Ten | Methodology | Summary | Table
The 10 Poorest Places In South Carolina For 2025:
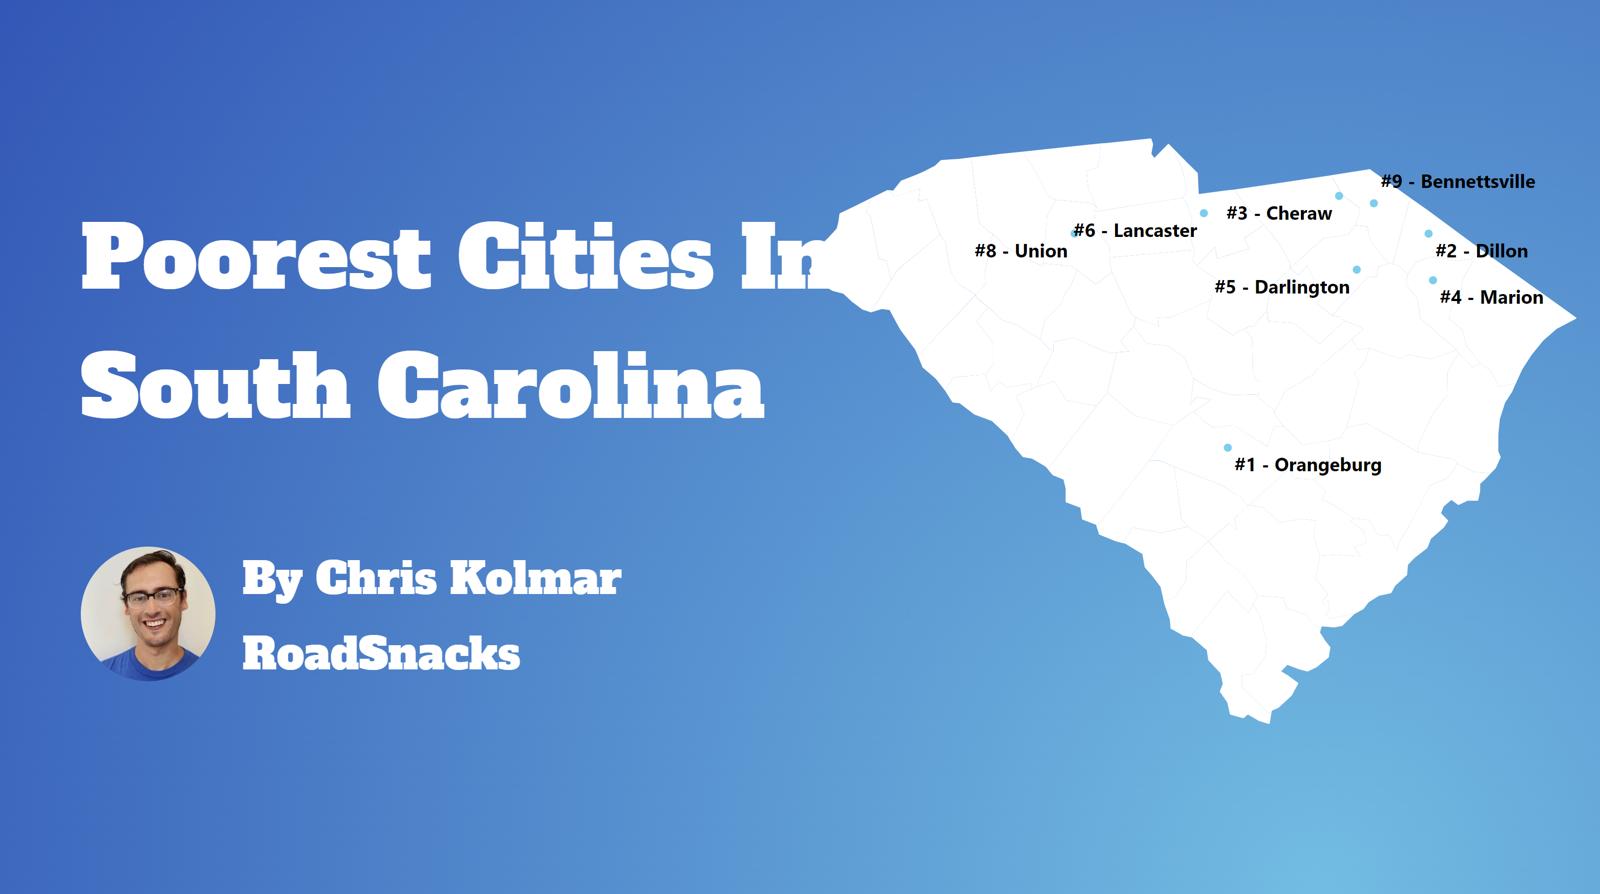
What’s the poorest city in South Carolina? According to the facts, Cheraw is the poorest place in South Carolina for 2025.
This isn’t a commentary on the people that live there or the vibrant culture and traditions of these places. Instead, it’s just a look at the facts.
For more South Carolina reading, check out:
- Best Places To Live In South Carolina
- Cheapest Places To Live In South Carolina
- Most Dangerous Cities In South Carolina
- The poorest states in the US
- The poorest cities in the US
The 10 Poorest Cities In South Carolina For 2025
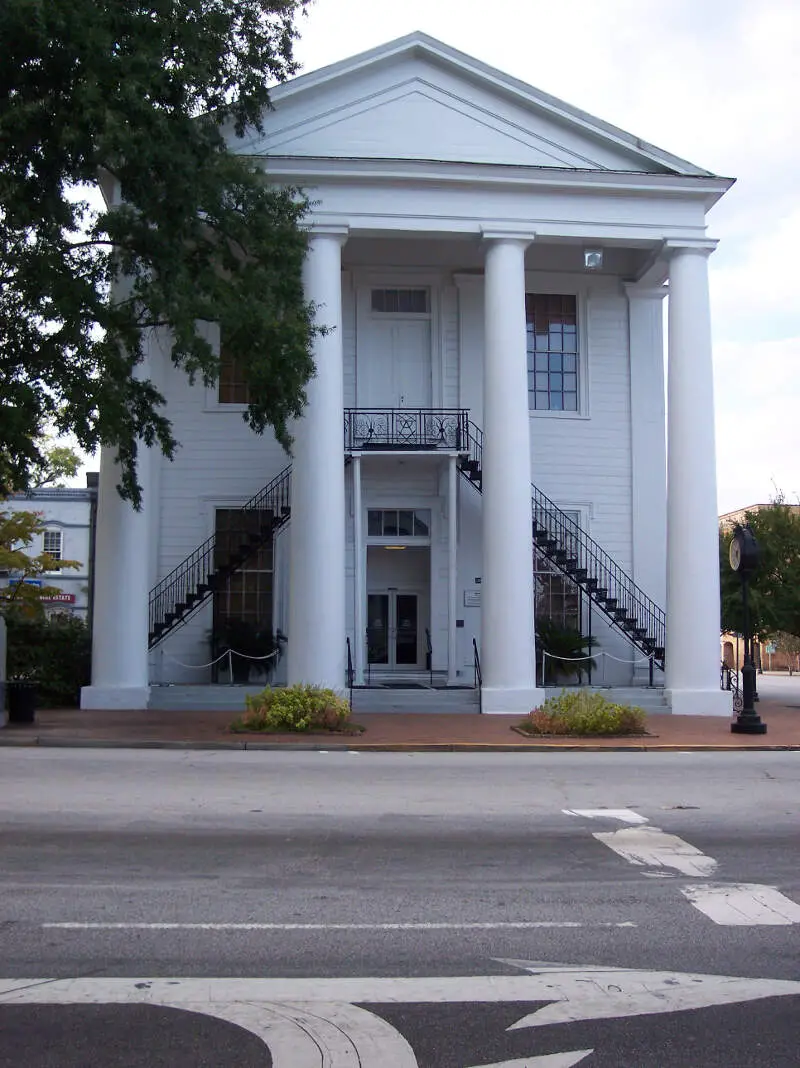
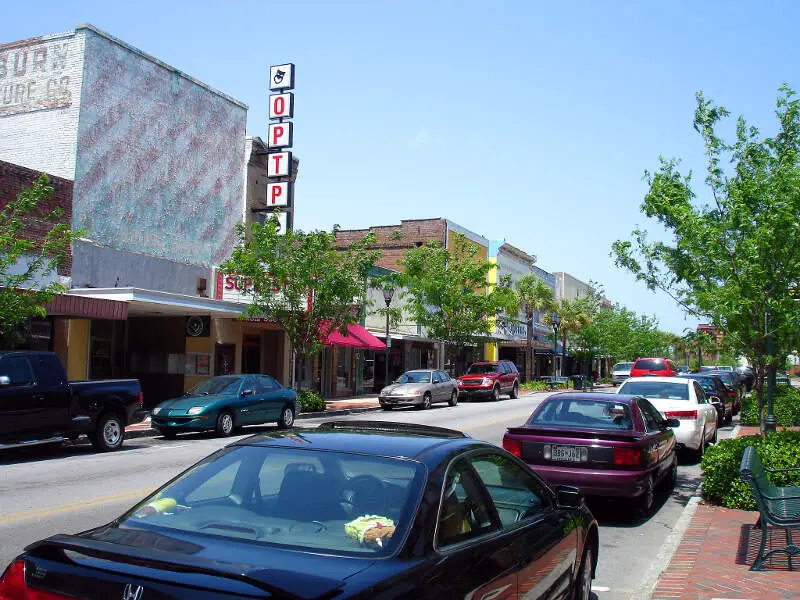
1. Cheraw
/10
Population: 5,024
Rank Last Year: 3 (Up 2)
Median Income: $27,275 (lowest)
Poverty Rate: 35.4% (3rd highest)
People In Poverty: 1,780
More on Cheraw: Data
Cheraw, unfortunately, ranks as the poorest place in South Carolina thanks to combination of low pay and and a lack of jobs.
The city of 5,024 people averages the lowest median household income in South Carolina and the 3rd highest poverty rate. At the very least, the cost of living ranks in the bottom 15% of place in the state, so things like housing are relatively affordable.
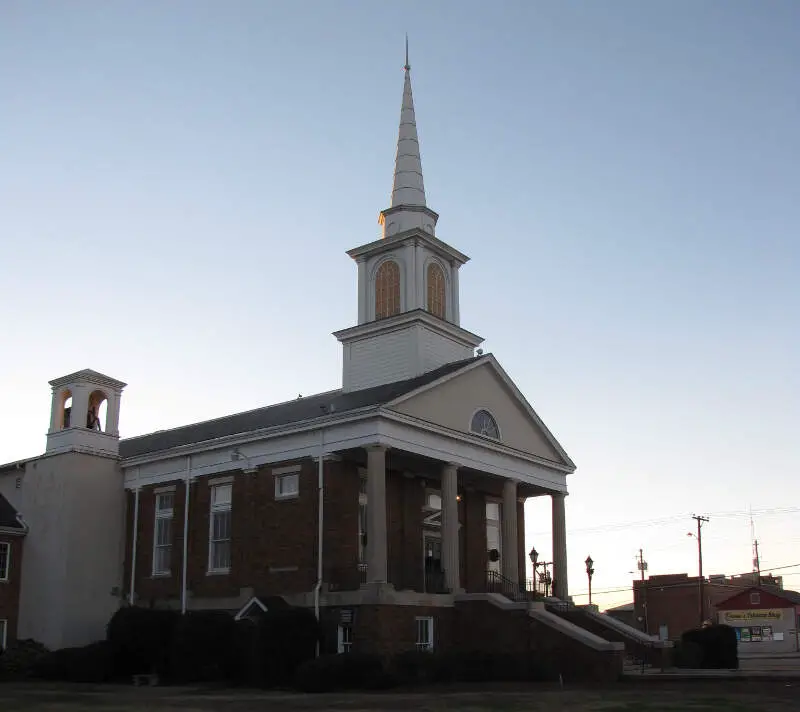
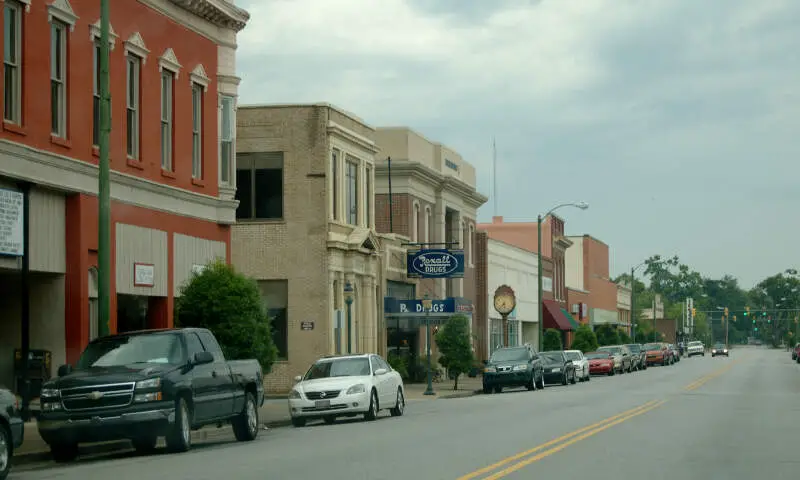
2. Dillon
/10
Population: 6,406
Rank Last Year: 2 (No Change)
Median Income: $34,964 (6th lowest)
Poverty Rate: 38.6% (highest)
People In Poverty: 2,471
More on Dillon: Data
The second poorest city in South Carolina is Dillon.
The city ranks as having the highest incidence of poverty and 6th lowest median household income. However, the unemployment rate ‘only’ ranks as the 5highest in the Palmetto State.
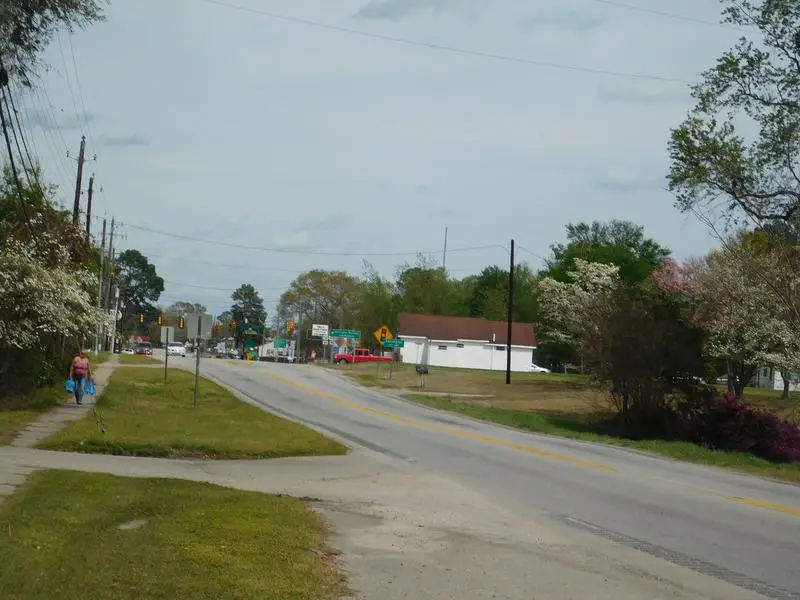
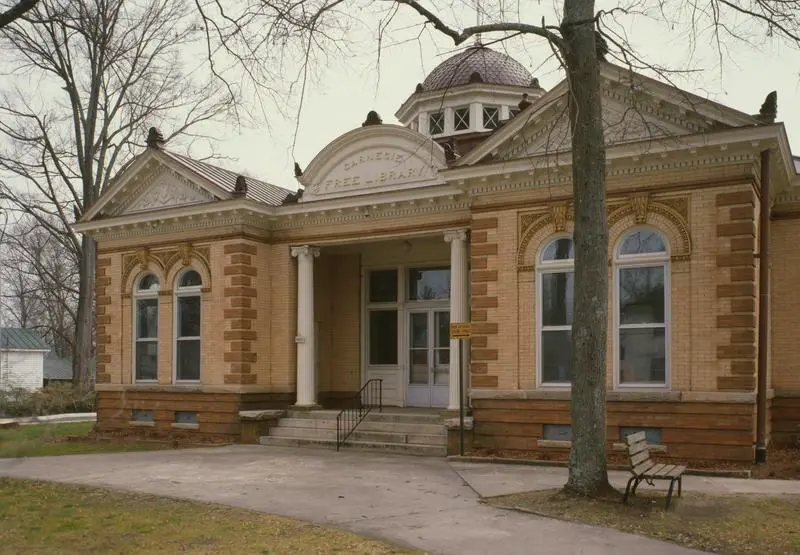
3. Darlington
/10
Population: 6,128
Rank Last Year: 5 (Up 2)
Median Income: $31,240 (3rd lowest)
Poverty Rate: 33.9% (4th highest)
People In Poverty: 2,078
More on Darlington: Data
Placing as the third poorest city, Darlington’s median income ranks as the 3rd lowest.
And that’s a sign that there’s a relatively substantial jump in the quality of the economy from second to third place on our list. The poverty rate is 33.92% and ranks near the bottom of places in the state.
But what makes up for the relatively low incomes of the city is its low cost of living. The income you do make here goes further than in most parts of the Palmetto State.
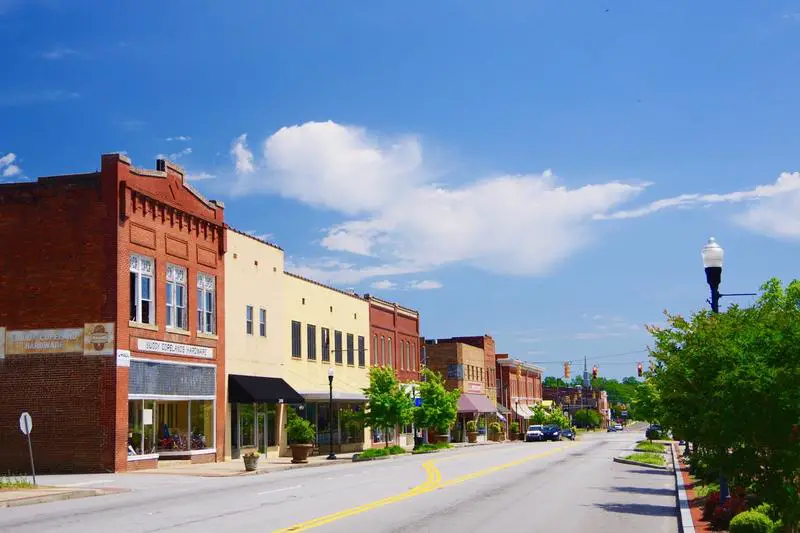
4. Orangeburg
/10
Population: 13,189
Rank Last Year: 1 (Down 3)
Median Income: $33,066 (4th lowest)
Poverty Rate: 31.5% (5th highest)
People In Poverty: 4,154
More on Orangeburg: Data
Orangeburg ranks as the fourth poorest place in South Carolina.
The town ranks as having the 4th lowest median household income and the 5th highest incidence of poverty in the state.
That being said, there’s still a ton of cultural diversity in the city as it hosts many events throughout the year.
5. Marion
/10
Population: 6,338
Rank Last Year: 4 (Down 1)
Median Income: $27,767 (2nd lowest)
Poverty Rate: 27.5% (9th highest)
People In Poverty: 1,742
More on Marion: Data
The fifth poorest city in South Carolina is Marion.
The city ranks as having the 2nd lowest median income in the state. However, an extremely low cost of living prevents a good number of folks from living in poverty as the poverty rate only ranks as the 9th highest in South Carolina.
Still not the best news for Marion.
6. Union
/10
Population: 8,047
Rank Last Year: 7 (Up 1)
Median Income: $34,112 (5th lowest)
Poverty Rate: 26.4% (12th highest)
People In Poverty: 2,122
More on Union: Data
Union ranks as the sixth poorest place in the Palmetto State.
It ranks as having the 12th highest incidence of poverty and the 6th highest unemployment rate.
7. Clinton
/10
Population: 7,624
Rank Last Year: 10 (Up 3)
Median Income: $40,372 (9th lowest)
Poverty Rate: 26.5% (11th highest)
People In Poverty: 2,021
More on Clinton: Data
Clinton places as the seventh poorest city in South Carolina.
The city of over 7,624 ranks as having the 11th highest incidence of poverty in the state. However, it has a very low cost of living which helps to pay the bills each month.
8. Lancaster
/10
Population: 8,738
Rank Last Year: 6 (Down 2)
Median Income: $43,234 (13th lowest)
Poverty Rate: 27.5% (8th highest)
People In Poverty: 2,403
More on Lancaster: Data
Lancaster ranks as the eighth poorest city in South Carolina.
The big issue for the town is the unemployment rate which ranks as one of the highest in the state.
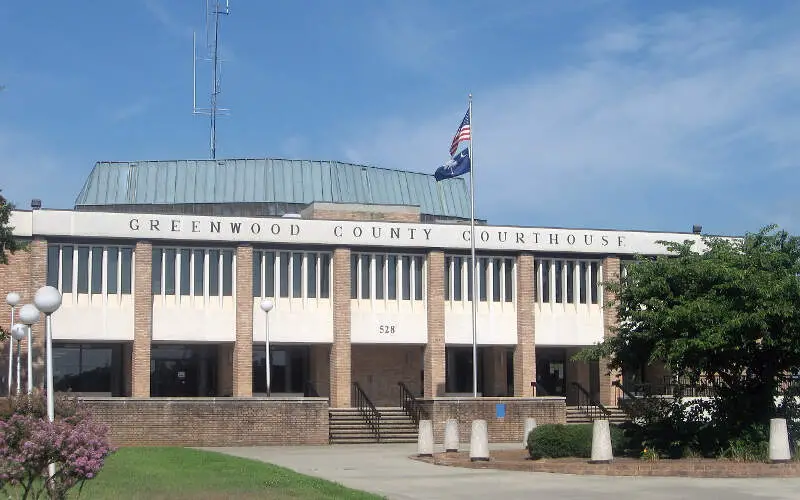
9. Greenwood
/10
Population: 22,527
Rank Last Year: 12 (Up 3)
Median Income: $40,253 (8th lowest)
Poverty Rate: 25.1% (13th highest)
People In Poverty: 5,656
More on Greenwood: Data
Greenwood couldn’t stay out of the top ten poorest places in South Carolina; it ranks number 9.
While the median income is the 8th lowest, there are a substantial number of people that live below the poverty line. Overall, Greenwood ranks as having the 13th most people living in poverty of all the places we analyzed in South Carolina.
10. Clemson
/10
Population: 17,759
Rank Last Year: 14 (Up 4)
Median Income: $49,713 (20th lowest)
Poverty Rate: 36.1% (2nd highest)
People In Poverty: 6,418
More on Clemson: Data
And rounding out the top ten poorest cities in South Carolina is Clemson.
The city of 17,759 people ranks in the bottom 20% for both median income and poverty rate in the Palmetto State.
Methodology: How We Determined The Poorest Places In South Carolina for 2025
The first thing that comes to most people’s minds when they think about determining the poorest places is to simply the poverty rate. That is, the number of people living below a federally established level of income for a household of a certain size.
However, we don’t think that one statistic wholly encompasses what it means to be one of the “poorest places”. So we used Saturday Night Science to look at this set of criteria from the newly released 2019-2023 American Community Survey:
- Poverty Level
- Median Household Income
After we collected the data for all 65 places with more than 5,000 people in South Carolina, we ranked each place from 1 to 65 for each of the criteria, with 1 being the poorest.
We then averaged all the rankings for a place into a “Poor Score” with the place having the lowest overall Poor Score, Cheraw, crowned the “Poorest Place In South Carolina For 2025”.
This report has been updated for 2025, which is our tenth time ranking the poorest places in South Carolina.
Summary: The Poorest Cities In South Carolina For 2025
Like we said earlier, when we set out to identify the poorest places in South Carolina, we weren’t sure what we’d encounter, but it ended up being some of the best places to live in South Carolina.
When you look at the data, the cities and places mentioned above meet the criteria for being at the very bottom of the income ladder for everyone that lives there.
If you’re curious enough, here are the richest cities in South Carolina, according to data:
-
Richest: Tega Cay
2nd Richest: Fort Mill
3rd Richest: Blythewood
For more South Carolina reading, check out:
- Richest Cities In South Carolina
- Safest Places In South Carolina
- Worst Places To Live In South Carolina
- Most Expensive Places To Live In South Carolina
Detailed List Of The Poorest Places To Live In South Carolina
| Rank | City | Population | Poverty Rate | Median Income | People In Poverty |
|---|---|---|---|---|---|
| 1 | Cheraw | 5,024 | 35.4% | $27,275 | 1,780 |
| 2 | Dillon | 6,406 | 38.6% | $34,964 | 2,471 |
| 3 | Darlington | 6,128 | 33.9% | $31,240 | 2,078 |
| 4 | Orangeburg | 13,189 | 31.5% | $33,066 | 4,154 |
| 5 | Marion | 6,338 | 27.5% | $27,767 | 1,742 |
| 6 | Union | 8,047 | 26.4% | $34,112 | 2,122 |
| 7 | Clinton | 7,624 | 26.5% | $40,372 | 2,021 |
| 8 | Lancaster | 8,738 | 27.5% | $43,234 | 2,403 |
| 9 | Greenwood | 22,527 | 25.1% | $40,253 | 5,656 |
| 10 | Clemson | 17,759 | 36.1% | $49,713 | 6,418 |
| 11 | Lake City | 6,032 | 24.5% | $35,000 | 1,479 |
| 12 | Walterboro | 5,490 | 30.6% | $48,366 | 1,682 |
| 13 | Gaffney | 12,612 | 24.8% | $41,214 | 3,131 |
| 14 | Chester | 5,241 | 25.0% | $41,231 | 1,311 |
| 15 | Newberry | 10,733 | 27.0% | $47,885 | 2,901 |
| 16 | Bennettsville | 6,798 | 23.5% | $40,889 | 1,595 |
| 17 | Hartsville | 7,422 | 23.6% | $47,720 | 1,747 |
| 18 | Anderson | 29,563 | 22.3% | $44,321 | 6,583 |
| 19 | Spartanburg | 38,578 | 24.1% | $51,193 | 9,289 |
| 20 | Central | 5,299 | 31.4% | $58,262 | 1,664 |
| 21 | Travelers Rest | 8,137 | 22.5% | $49,655 | 1,828 |
| 22 | Seneca | 8,910 | 18.8% | $52,207 | 1,676 |
| 23 | York | 8,697 | 16.1% | $47,315 | 1,402 |
| 24 | Columbia | 138,019 | 23.2% | $55,653 | 32,089 |
| 25 | Laurens | 9,307 | 22.0% | $55,207 | 2,045 |
| 26 | Conway | 26,082 | 20.3% | $54,841 | 5,284 |
| 27 | Camden | 8,025 | 16.7% | $53,289 | 1,336 |
| 28 | Myrtle Beach | 37,214 | 16.9% | $53,679 | 6,289 |
| 29 | Florence | 40,205 | 18.1% | $56,433 | 7,293 |
| 30 | Sumter | 43,065 | 15.8% | $53,071 | 6,791 |
| 31 | Cayce | 13,718 | 17.8% | $58,095 | 2,443 |
| 32 | Beaufort | 13,660 | 18.0% | $59,454 | 2,458 |
| 33 | West Columbia | 17,723 | 14.1% | $54,152 | 2,498 |
| 34 | Georgetown | 8,511 | 15.8% | $57,704 | 1,343 |
| 35 | North Charleston | 117,460 | 15.5% | $62,789 | 18,253 |
| 36 | Aiken | 32,334 | 16.3% | $69,837 | 5,267 |
| 37 | Easley | 23,942 | 14.2% | $65,330 | 3,411 |
| 38 | Rock Hill | 74,769 | 13.3% | $64,770 | 9,951 |
| 39 | Greenville | 71,755 | 14.1% | $68,460 | 10,081 |
| 40 | Clover | 7,013 | 13.9% | $66,992 | 976 |
| 41 | Fountain Inn | 11,307 | 12.9% | $72,021 | 1,460 |
| 42 | Port Royal | 15,047 | 10.7% | $70,330 | 1,602 |
| 43 | Lyman | 6,317 | 8.5% | $69,688 | 535 |
| 44 | Hardeeville | 9,293 | 10.8% | $78,233 | 1,006 |
| 45 | Summerville | 51,262 | 10.3% | $78,621 | 5,285 |
| 46 | Hollywood | 5,330 | 9.0% | $77,415 | 480 |
| 47 | Hanahan | 21,119 | 10.9% | $84,061 | 2,310 |
| 48 | Forest Acres | 10,491 | 8.2% | $76,417 | 855 |
| 49 | Greer | 39,191 | 9.9% | $80,030 | 3,868 |
| 50 | Charleston | 152,014 | 12.0% | $90,038 | 18,196 |
| 51 | North Myrtle Beach | 19,343 | 6.1% | $72,111 | 1,187 |
| 52 | Mauldin | 25,985 | 8.3% | $81,027 | 2,156 |
| 53 | Lexington | 24,132 | 7.4% | $83,263 | 1,776 |
| 54 | Simpsonville | 25,125 | 6.1% | $79,233 | 1,522 |
| 55 | Irmo | 11,799 | 8.1% | $85,137 | 953 |
| 56 | Hilton Head Island | 37,805 | 8.4% | $96,715 | 3,179 |
| 57 | Goose Creek | 46,964 | 6.6% | $87,437 | 3,104 |
| 58 | North Augusta | 24,928 | 6.9% | $90,132 | 1,715 |
| 59 | Moncks Corner | 14,362 | 5.6% | $91,516 | 810 |
| 60 | James Island | 11,738 | 5.4% | $100,176 | 632 |
| 61 | Mount Pleasant | 92,662 | 5.8% | $121,364 | 5,355 |
| 62 | Bluffton | 31,323 | 4.8% | $105,463 | 1,509 |
| 63 | Blythewood | 5,309 | 3.6% | $105,583 | 191 |
| 64 | Fort Mill | 28,281 | 3.7% | $127,537 | 1,035 |
| 65 | Tega Cay | 13,267 | 0.6% | $141,037 | 79 |