
There’s no denying it: there are plenty of places in Minnesota that are downright beautiful and full of excitement.
Unfortunately, not all towns and cities in North Star State are so lucky.
Just like in all U.S. States, there are definitely some boring places within Minnesota’s’ borders. You know the places where everyone has an AARP card and the most exciting thing they do all day is post a picture of their grandchild on Facebook.
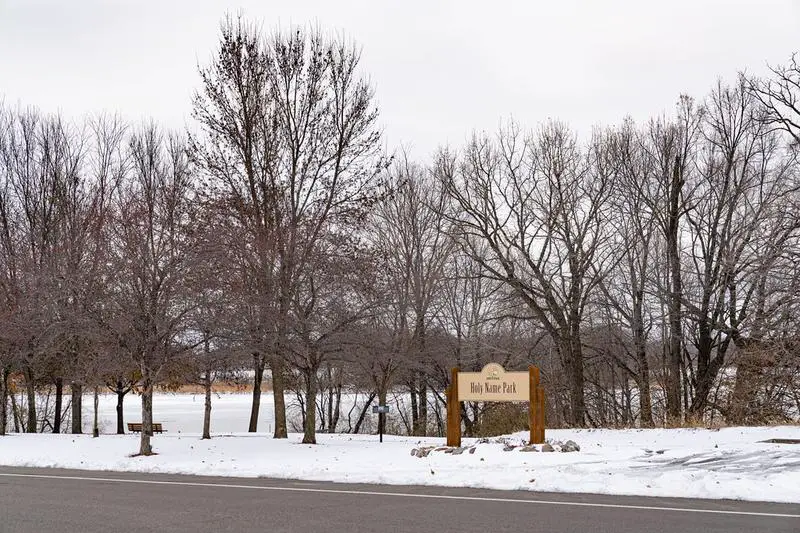
Like Corcoran, for instance. In our latest analysis, we found that this city was the most boring city in all of Oklahoma according to Saturday Night Science. But don’t feel bad if you’re a resident of Corcoran. There are plenty of other boring, lackluster places in Minnesota as well.
Here they are. Try not to jump out of your seat with excitement.
Table Of Contents: Top Ten | Methodology | Summary | Table
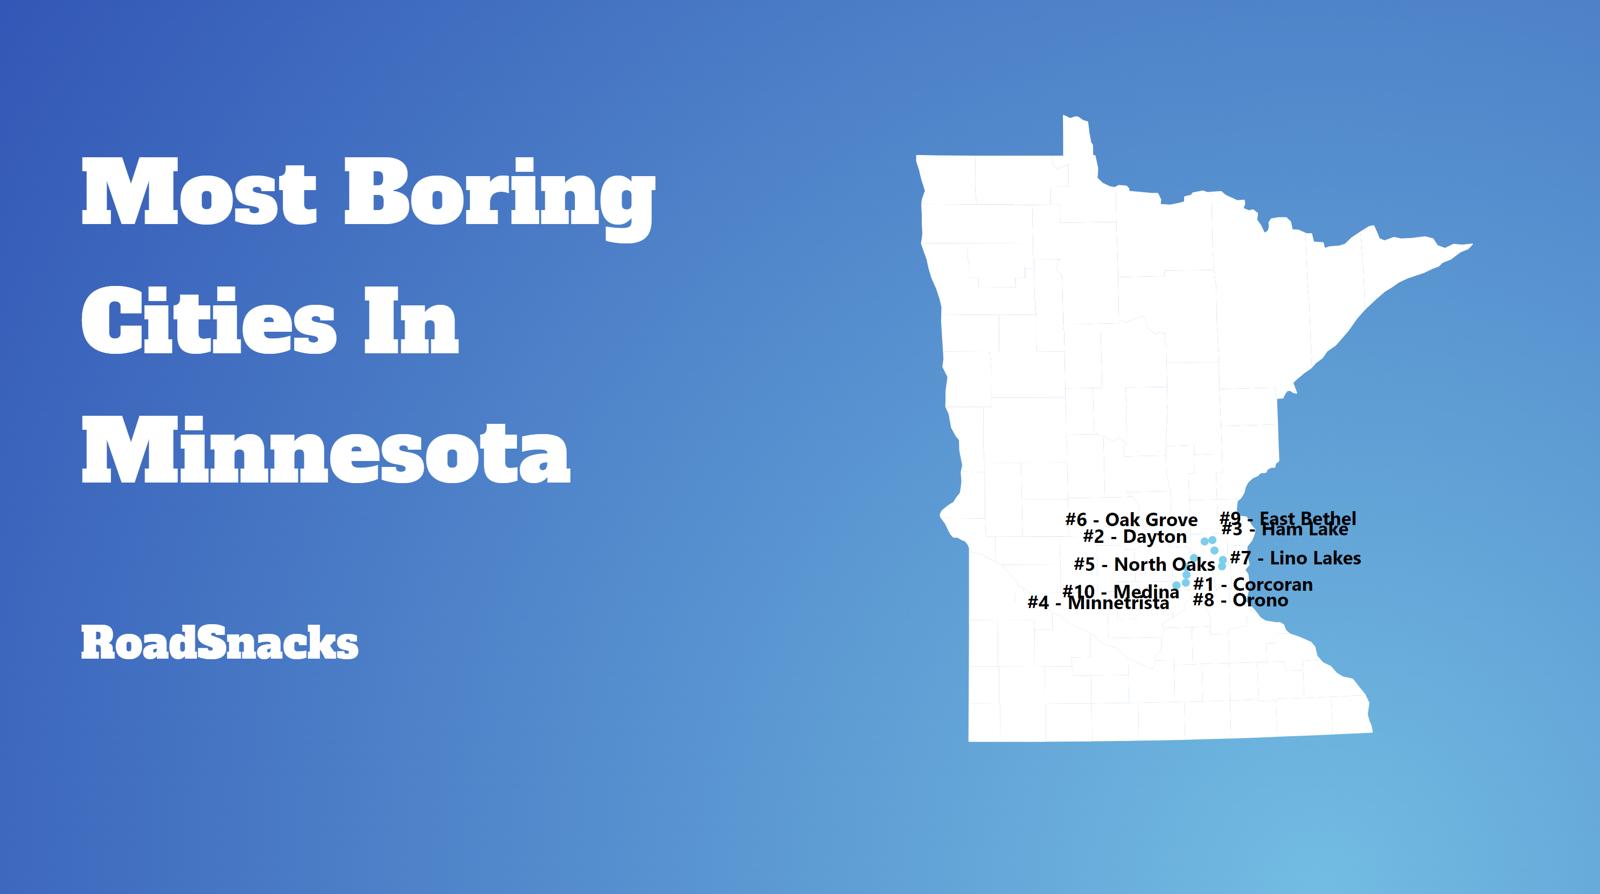
The 10 Most Boring Places In Minnesota
Don’t freak out, in fact, believe it not, a boring city is actually one a lot of people would like to call home.
Before you get all upset if your city’s name is on the list, rest assured that we didn’t use personal opinion when it comes to what classifies a city or town as “boring” or “exciting”. We crunched actual numbers to figure out which towns are statistically more boring.
Showing this data to you is the kind of thing that a real estate agent knows, but would never share.
For more Minnesota reading, check out:
The 10 Most Boring Places In Minnesota For 2025


/10
/10

/10

/10

/10
/10

/10

/10

/10

/10
Methodology: How we determined the boring cities in the North Star State
You would present the following case to your friends if you were argueing with them at a bar about the most boring place to live in Minnesota. And that’s why we call it Saturday Night Science.
Because our data speaks more truth than feelings.
To figure out how boring a place is, we factored in things we generally think make people exciting, and then we figure out which cities have the least number of those exciting people.
We used the U.S. American Community Census data to gather the information presented here. HSome of the things people tend to think of as making a city’s population boring include:
- % of Population Over 25 (higher is more boring)
- % of Married Household (higher is more boring)
- Average Age (higher is more boring)
- % of Households With Kids (higher is more boring)
- Population density (lower is more boring)
Then, our algorithm generates a ranking for each place in these categories. After crunching the numbers, all of the cities ranked from most boring to most exciting.
For this ranking, we used every Minnesota city with at least 5,000 residents. This keeps us from prejudicing our rankings by including very small pockets of retired people.
Grab your rocker and hold on.
We updated this article for 2025, and it’s our tenth time ranking the most boring cities in Minnesota.
There You Have It – Now That You’re Asleep
On a ranking like this, there are usually no winners, but since Minnesota isn’t necessarily the most boring state in the United States, the cities on this ranking can at least take solace that there are, in fact, more boring cities in the country.
The most boring cities in Minnesota are Corcoran, Dayton, Oak Grove, Minnetrista, Lino Lakes, North Oaks, East Bethel, Ham Lake, Medina, and Orono.
If you’re also curious enough, here are the most exciting places in Minnesota, according to science:
- Mankato
- Minneapolis
- Winona
For more Minnesota reading, check out:
- Best Places To Live In Minnesota
- Cheapest Places To Live In Minnesota
- Most Dangerous Cities In Minnesota
- Richest Cities In Minnesota
- Safest Places In Minnesota
- Worst Places To Live In Minnesota
- Most Expensive Places To Live In Minnesota
Detailed List Of The Most Boring Cities In Minnesota For 2025
| Rank | City | Population | Average Age | % Married | % Kids |
|---|---|---|---|---|---|
| 1 | Corcoran, MN | 6,854 | 41.5 | 44.0% | 36.6% |
| 2 | Dayton, MN | 8,381 | 41.9 | 43.0% | 34.8% |
| 3 | Oak Grove, MN | 9,031 | 44.5 | 49.0% | 29.1% |
| 4 | Minnetrista, MN | 8,509 | 41.1 | 43.0% | 43.3% |
| 5 | Lino Lakes, MN | 21,847 | 43.1 | 42.0% | 31.4% |
| 6 | North Oaks, MN | 5,175 | 43.6 | 38.0% | 41.8% |
| 7 | East Bethel, MN | 11,995 | 40.5 | 45.0% | 30.1% |
| 8 | Ham Lake, MN | 16,575 | 42.8 | 48.0% | 31.8% |
| 9 | Medina, MN | 6,858 | 40.7 | 40.0% | 47.3% |
| 10 | Orono, MN | 8,205 | 47.2 | 36.0% | 33.2% |
| 11 | Lake Elmo, MN | 12,504 | 40.2 | 39.0% | 42.1% |
| 12 | Shorewood, MN | 7,679 | 48.0 | 32.0% | 36.6% |
| 13 | Wyoming, MN | 8,063 | 40.1 | 46.0% | 36.9% |
| 14 | North Branch, MN | 11,182 | 38.6 | 41.0% | 33.8% |
| 15 | Mendota Heights, MN | 11,644 | 46.8 | 36.0% | 28.0% |
| 16 | Victoria, MN | 10,972 | 40.1 | 37.0% | 41.9% |
| 17 | Grand Rapids, MN | 11,186 | 44.5 | 33.0% | 24.5% |
| 18 | Andover, MN | 32,825 | 39.4 | 43.0% | 40.2% |
| 19 | Fairmont, MN | 10,348 | 46.5 | 34.0% | 22.2% |
| 20 | Hugo, MN | 16,076 | 39.2 | 44.0% | 31.7% |
| 21 | Little Falls, MN | 9,094 | 41.4 | 36.0% | 26.6% |
| 22 | Carver, MN | 5,935 | 39.4 | 39.0% | 48.9% |
| 23 | Redwood Falls, MN | 5,075 | 43.1 | 39.0% | 25.3% |
| 24 | Hibbing, MN | 16,100 | 43.0 | 32.0% | 21.1% |
| 25 | Hermantown, MN | 10,192 | 37.8 | 41.0% | 39.6% |
| 26 | Virginia, MN | 8,362 | 44.7 | 29.0% | 25.3% |
| 27 | Inver Grove Heights, MN | 35,772 | 41.1 | 32.0% | 29.4% |
| 28 | Baxter, MN | 8,804 | 42.9 | 30.0% | 28.8% |
| 29 | St. Michael, MN | 19,267 | 37.5 | 37.0% | 42.2% |
| 30 | Forest Lake, MN | 20,678 | 38.8 | 36.0% | 30.7% |
| 31 | Elk River, MN | 26,367 | 37.3 | 34.0% | 36.8% |
| 32 | International Falls, MN | 5,728 | 47.0 | 30.0% | 21.6% |
| 33 | Ramsey, MN | 28,070 | 36.9 | 39.0% | 37.6% |
| 34 | Red Wing, MN | 16,660 | 42.2 | 30.0% | 24.4% |
| 35 | Litchfield, MN | 6,599 | 44.5 | 31.0% | 28.4% |
| 36 | Belle Plaine, MN | 7,401 | 38.2 | 38.0% | 40.6% |
| 37 | Rosemount, MN | 26,509 | 38.7 | 34.0% | 38.8% |
| 38 | Mahtomedi, MN | 8,108 | 43.3 | 39.0% | 32.7% |
| 39 | Rogers, MN | 13,405 | 36.9 | 43.0% | 49.9% |
| 40 | Otsego, MN | 21,358 | 34.4 | 40.0% | 48.0% |
| 41 | Albertville, MN | 8,066 | 37.4 | 47.0% | 42.1% |
| 42 | St. Francis, MN | 8,279 | 35.4 | 38.0% | 40.9% |
| 43 | Champlin, MN | 23,450 | 41.1 | 35.0% | 32.7% |
| 44 | Maple Grove, MN | 70,539 | 40.9 | 31.0% | 33.6% |
| 45 | Cottage Grove, MN | 40,124 | 36.8 | 36.0% | 40.1% |
| 46 | Prior Lake, MN | 27,832 | 39.7 | 33.0% | 40.1% |
| 47 | Montevideo, MN | 5,303 | 42.0 | 32.0% | 27.8% |
| 48 | Golden Valley, MN | 21,927 | 44.3 | 30.0% | 26.1% |
| 49 | Hutchinson, MN | 14,629 | 41.8 | 37.0% | 23.7% |
| 50 | Waseca, MN | 9,209 | 39.4 | 34.0% | 36.5% |
| 51 | Shoreview, MN | 26,724 | 44.5 | 31.0% | 27.8% |
| 52 | Albert Lea, MN | 18,379 | 44.3 | 29.0% | 24.7% |
| 53 | Delano, MN | 6,712 | 35.8 | 46.0% | 40.5% |
| 54 | Owatonna, MN | 26,462 | 40.0 | 37.0% | 30.8% |
| 55 | Minnetonka, MN | 53,256 | 42.8 | 29.0% | 26.2% |
| 56 | Chanhassen, MN | 26,001 | 40.9 | 28.0% | 34.3% |
| 57 | Crookston, MN | 7,388 | 41.5 | 28.0% | 26.4% |
| 58 | Plymouth, MN | 79,526 | 40.7 | 29.0% | 33.1% |
| 59 | Anoka, MN | 17,941 | 40.0 | 31.0% | 29.4% |
| 60 | Stillwater, MN | 19,323 | 42.5 | 31.0% | 28.8% |
| 61 | Waconia, MN | 13,223 | 37.6 | 37.0% | 40.8% |
| 62 | Lakeville, MN | 72,480 | 36.9 | 34.0% | 43.1% |
| 63 | Buffalo, MN | 16,388 | 38.7 | 38.0% | 32.7% |
| 64 | Hastings, MN | 22,050 | 40.8 | 34.0% | 28.1% |
| 65 | Detroit Lakes, MN | 10,002 | 41.5 | 29.0% | 24.1% |
| 66 | Alexandria, MN | 14,579 | 39.0 | 33.0% | 23.7% |
| 67 | Chaska, MN | 28,146 | 37.6 | 32.0% | 37.3% |
| 68 | Eden Prairie, MN | 63,249 | 40.5 | 25.0% | 34.3% |
| 69 | New Ulm, MN | 14,066 | 40.3 | 36.0% | 24.8% |
| 70 | Mound, MN | 9,176 | 45.6 | 30.0% | 22.0% |
| 71 | Fergus Falls, MN | 14,138 | 42.0 | 26.0% | 20.6% |
| 72 | Vadnais Heights, MN | 12,789 | 38.7 | 30.0% | 26.4% |
| 73 | Farmington, MN | 23,675 | 35.6 | 33.0% | 46.8% |
| 74 | Cloquet, MN | 12,582 | 36.2 | 30.0% | 31.1% |
| 75 | Edina, MN | 53,125 | 44.8 | 26.0% | 27.2% |
| 76 | New Prague, MN | 8,195 | 34.4 | 46.0% | 41.5% |
| 77 | Oakdale, MN | 28,109 | 41.3 | 31.0% | 27.9% |
| 78 | Byron, MN | 6,510 | 37.4 | 34.0% | 38.8% |
| 79 | Blaine, MN | 71,261 | 37.3 | 31.0% | 37.6% |
| 80 | La Crescent, MN | 5,266 | 45.5 | 13.0% | 21.6% |
| 81 | St. Paul Park, MN | 5,464 | 40.2 | 28.0% | 30.4% |
| 82 | Savage, MN | 32,706 | 37.4 | 29.0% | 37.8% |
| 83 | Jordan, MN | 6,704 | 35.4 | 35.0% | 50.3% |
| 84 | Kasson, MN | 6,964 | 33.6 | 39.0% | 46.7% |
| 85 | Glencoe, MN | 5,702 | 37.7 | 34.0% | 26.8% |
| 86 | North Mankato, MN | 14,212 | 38.2 | 33.0% | 33.2% |
| 87 | White Bear Lake, MN | 24,026 | 42.1 | 30.0% | 25.6% |
| 88 | Stewartville, MN | 6,754 | 36.8 | 36.0% | 37.4% |
| 89 | Thief River Falls, MN | 8,841 | 38.9 | 30.0% | 25.3% |
| 90 | Zimmerman, MN | 6,410 | 32.3 | 32.0% | 45.3% |
| 91 | New Hope, MN | 21,402 | 41.0 | 22.0% | 29.8% |
| 92 | Eagan, MN | 68,158 | 39.1 | 27.0% | 29.7% |
| 93 | Woodbury, MN | 76,945 | 37.9 | 27.0% | 37.8% |
| 94 | Bloomington, MN | 88,838 | 40.8 | 27.0% | 24.4% |
| 95 | Coon Rapids, MN | 63,348 | 39.2 | 28.0% | 29.2% |
| 96 | Cambridge, MN | 9,992 | 36.8 | 29.0% | 26.1% |
| 97 | Faribault, MN | 24,458 | 38.4 | 23.0% | 30.0% |
| 98 | Isanti, MN | 7,023 | 33.8 | 31.0% | 35.6% |
| 99 | Shakopee, MN | 45,002 | 35.5 | 25.0% | 41.4% |
| 100 | Mounds View, MN | 12,992 | 37.5 | 31.0% | 33.0% |