
Do you live in one of the most miserable places in South Carolina?
Only a third of South Carolinians say they are truly happy. That’s too bad, considering that folks in South Carolina don’t really have it too bad in the grand scheme of things.
But, we were curious – which South Carolina cities might be the most miserable? We’re about to find out, using Saturday Night Science and data.
After analyzing the 65 largest cities, we sadly present the most miserable cities in the Palmetto State.
Table Of Contents: Top Ten | Methodology | Summary | Table
The 10 Most Miserable Places In South Carolina
Read on below to see how we crunched the numbers and how your town ranked. If you have a smile on your face, you probably don’t live in one of these cities.
Oh, and by the way, Clemson is the happiest place in South Carolina.
For more South Carolina reading, check out:
The 10 Most Miserable Places In South Carolina For 2023
/10
Population: 6,566
Poverty Level: 17.7%
Median Home Price $179,800
Married Households 9.0%
Households With Kids 44.43%
More on Clover: Data | Crime | Cost Of Living
/10
Population: 8,423
Poverty Level: 23.2%
Median Home Price $134,200
Married Households 20.0%
Households With Kids 40.53%
More on York: Data | Crime | Cost Of Living
/10
Population: 7,306
Poverty Level: 26.6%
Median Home Price $82,000
Married Households 16.0%
Households With Kids 28.09%
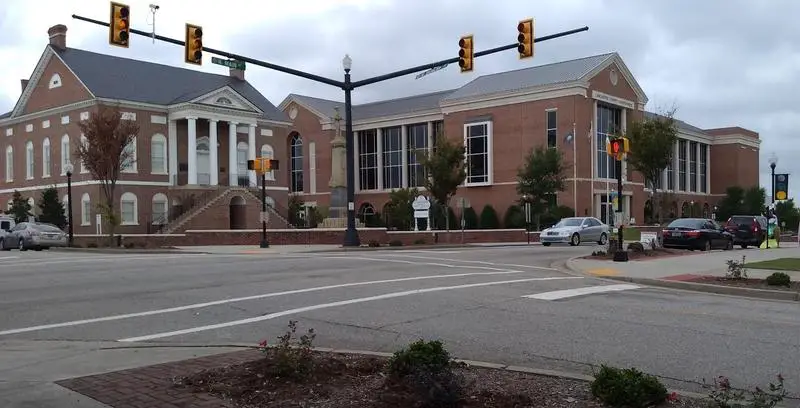
More on Bennettsville: Data | Crime | Cost Of Living
/10
Population: 5,283
Poverty Level: 27.4%
Median Home Price $79,800
Married Households 21.0%
Households With Kids 26.99%
More on Chester: Data | Crime | Cost Of Living
/10
Population: 8,489
Poverty Level: 35.5%
Median Home Price $163,400
Married Households 17.0%
Households With Kids 31.05%
More on Lancaster: Data | Cost Of Living
/10
Population: 50,318
Poverty Level: 10.4%
Median Home Price $229,800
Married Households 16.0%
Households With Kids 31.52%
More on Summerville: Data | Crime | Cost Of Living
/10
Population: 22,001
Poverty Level: 17.8%
Median Home Price $167,000
Married Households 15.0%
Households With Kids 25.81%
More on Conway: Data | Crime | Cost Of Living
/10
Population: 6,472
Poverty Level: 35.0%
Median Home Price $126,900
Married Households 19.0%
Households With Kids 26.86%
More on Marion: Data | Crime | Cost Of Living
/10
Population: 11,581
Poverty Level: 5.3%
Median Home Price $154,000
Married Households 27.0%
Households With Kids 30.7%
More on Irmo: Data | Crime | Cost Of Living
/10
Population: 8,119
Poverty Level: 26.5%
Median Home Price $82,100
Married Households 28.0%
Households With Kids 22.9%
More on Union: Data | Crime | Cost Of Living
Methodology: How We Measured The Most Miserable Cities In The Palmetto State
To rank the unhappiest places in South Carolina, we had to determine what criteria make people happy. It isn’t a stretch to assume that happy people earn great salaries, are relatively stress-free, and have a stable home life.
So we went to the Census’s American Community Survey 2017-2021 report for the happy criteria, flipped the list with Saturday Night Science, and it spit out the answer.
Like magic.
Here are the criteria we used to measure misery:
- Percentage of residents with a college degree
- Average commute times
- Unemployment rates
- Cost of living
- % of married couples
- % of families with kids
- Poverty rate
After we decided on the criteria, we gathered the data for the 65 places in South Carolina with over 5,000 people.
We then ranked each place from one to 65 for each of the seven criteria, with a score of one being the most miserable (Any ties were given to the larger place).
Next, we averaged the seven rankings into a Miserable Index for each place with the lowest overall Miserable Index “earning” the title “Most Miserable City In South Carolina.”
If you’d like to see the complete list of states, most miserable to happiest, scroll to the bottom of this post to see the unabridged chart.
We updated this article for 2023, and it’s our tenth time ranking the most miserable cities in South Carolina.
There You Have It – The Least Happy Cities In South Carolina
As we said earlier, trying to determine the most miserable cities in South Carolina is usually a subjective matter.
But if you’re analyzing cities where people are not stable, where you’re stuck in traffic, and no one spent the time to go to college, then this is an accurate list.
If you’re curious enough, here are the happiest cities in South Carolina, according to science:
- Clemson
- Greenville
- Forest Acres
For more South Carolina reading, check out:
- Best Places To Live In South Carolina
- Cheapest Places To Live In South Carolina
- Most Dangerous Cities In South Carolina
- Richest Cities In South Carolina
- Safest Places In South Carolina
- Worst Places To Live In South Carolina
- Most Expensive Places To Live In South Carolina
Miserable Cities In South Carolina For 2023
| Rank | City | Population | Poverty Level | Median Home Value | % Married | % Kids |
|---|---|---|---|---|---|---|
| 1 | Clover, SC | 6,566 | 17.7% | $179,800 | 9.0% | 44.43% |
| 2 | York, SC | 8,423 | 23.2% | $134,200 | 20.0% | 40.53% |
| 3 | Bennettsville, SC | 7,306 | 26.6% | $82,000 | 16.0% | 28.09% |
| 4 | Chester, SC | 5,283 | 27.4% | $79,800 | 21.0% | 26.99% |
| 5 | Lancaster, SC | 8,489 | 35.5% | $163,400 | 17.0% | 31.05% |
| 6 | Summerville, SC | 50,318 | 10.4% | $229,800 | 16.0% | 31.52% |
| 7 | Conway, SC | 22,001 | 17.8% | $167,000 | 15.0% | 25.81% |
| 8 | Marion, SC | 6,472 | 35.0% | $126,900 | 19.0% | 26.86% |
| 9 | Irmo, SC | 11,581 | 5.3% | $154,000 | 27.0% | 30.7% |
| 10 | Union, SC | 8,119 | 26.5% | $82,100 | 28.0% | 22.9% |
| 11 | Lake City, SC | 6,028 | 21.8% | $91,600 | 13.0% | 22.38% |
| 12 | Goose Creek, SC | 44,502 | 8.5% | $218,100 | 15.0% | 36.56% |
| 13 | Newberry, SC | 10,496 | 22.6% | $89,100 | 22.0% | 29.26% |
| 14 | Batesburg-Leesville, SC | 5,322 | 17.5% | $109,300 | 31.0% | 35.61% |
| 15 | Rock Hill, SC | 72,883 | 13.5% | $187,000 | 13.0% | 29.27% |
| 16 | Tega Cay, SC | 12,336 | 0.5% | $394,500 | 4.0% | 49.48% |
| 17 | Fort Mill, SC | 24,069 | 3.6% | $340,500 | 8.0% | 51.22% |
| 18 | Fountain Inn, SC | 10,237 | 12.7% | $176,300 | 28.0% | 47.36% |
| 19 | Greer, SC | 35,151 | 10.2% | $202,600 | 13.0% | 38.66% |
| 20 | Sumter, SC | 42,920 | 20.4% | $142,100 | 18.0% | 30.42% |
| 21 | Walterboro, SC | 5,514 | 23.2% | $113,400 | 26.0% | 39.07% |
| 22 | Gaffney, SC | 12,560 | 24.2% | $106,200 | 21.0% | 21.49% |
| 23 | Mauldin, SC | 24,735 | 6.5% | $180,100 | 17.0% | 31.62% |
| 24 | Moncks Corner, SC | 12,685 | 10.1% | $220,700 | 21.0% | 40.14% |
| 25 | Lyman, SC | 5,841 | 5.9% | $196,400 | 34.0% | 47.45% |
| 26 | Darlington, SC | 6,153 | 26.7% | $130,700 | 26.0% | 25.69% |
| 27 | Bluffton, SC | 27,596 | 5.6% | $336,100 | 4.0% | 34.13% |
| 28 | Greenwood, SC | 22,363 | 25.1% | $90,600 | 17.0% | 26.68% |
| 29 | North Augusta, SC | 24,013 | 7.7% | $179,500 | 11.0% | 27.28% |
| 30 | North Charleston, SC | 114,542 | 18.1% | $203,100 | 12.0% | 27.16% |
| 31 | Georgetown, SC | 8,435 | 23.6% | $158,100 | 24.0% | 23.25% |
| 32 | Hartsville, SC | 7,565 | 27.6% | $140,400 | 17.0% | 31.13% |
| 33 | Anderson, SC | 28,796 | 21.2% | $150,600 | 18.0% | 26.44% |
| 34 | Lexington, SC | 23,068 | 8.4% | $208,600 | 17.0% | 37.2% |
| 35 | Simpsonville, SC | 23,190 | 5.7% | $208,400 | 19.0% | 36.98% |
| 36 | Clinton, SC | 7,753 | 26.8% | $128,200 | 13.0% | 22.57% |
| 37 | North Myrtle Beach, SC | 18,502 | 7.8% | $293,500 | 6.0% | 11.9% |
| 38 | Spartanburg, SC | 37,990 | 24.0% | $143,300 | 19.0% | 30.63% |
| 39 | Orangeburg, SC | 12,779 | 32.1% | $113,700 | 20.0% | 16.79% |
| 40 | Hollywood, SC | 5,319 | 8.9% | $361,800 | 17.0% | 18.9% |
| 41 | Easley, SC | 22,643 | 11.8% | $182,100 | 27.0% | 24.81% |
| 42 | Dillon, SC | 6,354 | 33.0% | $133,800 | 34.0% | 41.55% |
| 43 | Mount Pleasant, SC | 88,900 | 5.6% | $499,600 | 13.0% | 31.06% |
| 44 | Hanahan, SC | 20,381 | 12.2% | $267,200 | 15.0% | 35.55% |
| 45 | Seneca, SC | 8,734 | 13.7% | $172,500 | 20.0% | 20.8% |
| 46 | Aiken, SC | 31,516 | 14.4% | $199,000 | 12.0% | 21.9% |
| 47 | Laurens, SC | 9,251 | 27.2% | $106,200 | 28.0% | 29.15% |
| 48 | Camden, SC | 7,666 | 16.4% | $211,100 | 22.0% | 28.01% |
| 49 | Central, SC | 5,229 | 36.9% | $140,600 | 8.0% | 26.26% |
| 50 | Cayce, SC | 13,637 | 17.2% | $135,200 | 20.0% | 21.88% |
| 51 | Cheraw, SC | 5,090 | 35.7% | $121,300 | 25.0% | 22.21% |
| 52 | Travelers Rest, SC | 7,670 | 23.1% | $218,900 | 14.0% | 39.77% |
| 53 | Hardeeville, SC | 7,228 | 9.4% | $381,300 | 8.0% | 13.0% |
| 54 | Myrtle Beach, SC | 35,116 | 19.4% | $246,300 | 8.0% | 21.72% |
| 55 | Florence, SC | 39,816 | 18.1% | $159,800 | 26.0% | 30.29% |
| 56 | Port Royal, SC | 12,734 | 5.5% | $244,000 | 5.0% | 24.11% |
| 57 | Beaufort, SC | 12,899 | 20.1% | $265,100 | 14.0% | 29.97% |
| 58 | Columbia, SC | 137,276 | 24.3% | $193,100 | 13.0% | 24.96% |
| 59 | James Island, SC | 11,618 | 4.0% | $355,400 | 23.0% | 29.5% |
| 60 | Charleston, SC | 147,928 | 12.0% | $369,500 | 13.0% | 21.25% |
| 61 | West Columbia, SC | 17,265 | 13.3% | $158,800 | 20.0% | 18.16% |
| 62 | Hilton Head Island, SC | 38,068 | 7.6% | $520,700 | 4.0% | 13.55% |
| 63 | Forest Acres, SC | 10,621 | 11.2% | $201,700 | 20.0% | 26.11% |
| 64 | Greenville, SC | 69,725 | 13.9% | $349,300 | 14.0% | 20.49% |
| 65 | Clemson, SC | 17,238 | 36.4% | $293,000 | 9.0% | 15.27% |
Wagener New Holland Beech Island or Jackson or Even Edgefield or Trenton were not on the list. So I guess that makes this list void, because all the places in were not listed.
Orangeburg South Carolina needs to be number 1 not number 13. There is nothing in Orangeburg only major place to shop is wal-mart no movie theaters, bowling alleys, no decent malls, no fun outlets, only two fancy restaurants, the hospital if u got to go in for a life threatening illness you not coming out. With Orangeburg massacre it was black and others throwing projectiles are law enforcement and refusing to comply so law enforcement had to protect their lives. Think twice before making deciding to move to Orangeburg sc.