
Do you live in one of the murder capitals of Minnesota?
We all watch the news with horror when we hear about a homicide that happens not that far away from us. While a murder just blocks or even a couple of towns away from your house would make anyone uneasy, in the long run, most likely, where you live is relatively safe.
To find the cities in Minnesota with the most murders and the highest murder rates per capita, we used Saturday Night Science to compare the FBI crime data on murders for the 39 cities in the North Star State with over 8,000 residents.
Table Of Contents: Top Ten | Methodology | Summary | Table

Cities With Highest Murder Rates In Minnesota
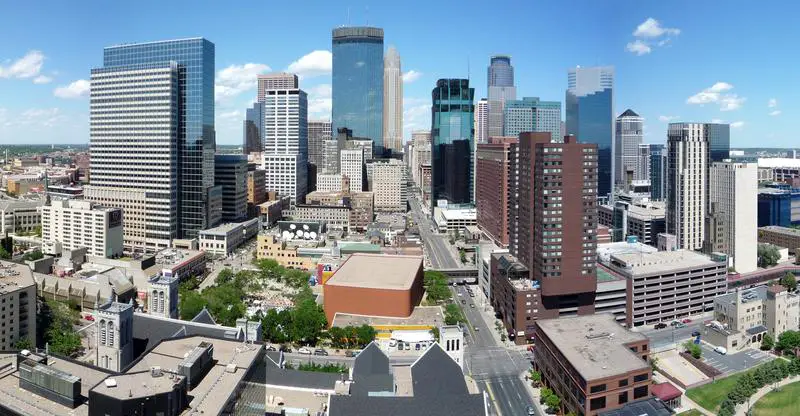
What city has the highest murder rate in Minnesota? The city with the highest murder rate in Minnesota is Minneapolis with 17.0 murders per 100,000 people.
What is the city in Minnesota with highest number of murders? The city in Minnesota with the highest number of murders is Minneapolis with 72 murders.
Read on below to see how we crunched the numbers and how your town in Minnesota ranked. There were ‘only’ 39 cities in Minnesota where a city reported a murder to the FBI, meaning 89 places had no murder.
For more reading on the North Star State check out:
- Best Places To Live In Minnesota
- Cheapest Places To Live In Minnesota
- Most Dangerous Cities In Minnesota
The 10 Murder Capitals Of Minnesota For 2026

/10
Population: 422,341
Murders: 72 (Most)
Murders Per 100k: 17.0 (Most)
More on Minneapolis: Data | Crime | Cost Of Living | Movers

/10
Population: 31,522
Murders: 5 (4th Most)
Murders Per 100k: 15.9 (2nd Most)
More on Brooklyn Center: Data | Crime | Cost Of Living | Movers

/10
Population: 8,066
Murders: 1 (26th Most)
Murders Per 100k: 12.4 (3rd Most)
More on Wyoming: Data | Crime | Cost Of Living | Movers

/10
Population: 16,221
Murders: 2 (10th Most)
Murders Per 100k: 12.3 (4th Most)
More on Bemidji: Data | Crime | Cost Of Living | Movers

/10
Population: 8,377
Murders: 1 (26th Most)
Murders Per 100k: 11.9 (5th Most)
More on Waite Park: Data | Crime | Cost Of Living | Movers

/10
Population: 8,939
Murders: 1 (26th Most)
Murders Per 100k: 11.2 (6th Most)
More on Thief River Falls: Data | Crime | Cost Of Living | Movers

/10
Population: 9,083
Murders: 1 (26th Most)
Murders Per 100k: 11.0 (7th Most)
More on Little Falls: Data | Crime | Cost Of Living | Movers

/10
Population: 9,113
Murders: 1 (26th Most)
Murders Per 100k: 11.0 (8th Most)
More on Waseca: Data | Crime | Cost Of Living | Movers


/10
Population: 300,368
Murders: 27 (2nd Most)
Murders Per 100k: 9.0 (9th Most)
More on St. Paul: Data | Crime | Cost Of Living | Movers

/10
Population: 81,920
Murders: 7 (3rd Most)
Murders Per 100k: 8.5 (10th Most)
More on Brooklyn Park: Data | Crime | Cost Of Living | Movers
Methodology: How we calculated the murder capitals of Minnesota
While there are surveys and public polls on what cities in a state are the most dangerous, we wanted to rely on something other than speculation and opinion. Instead, we used Saturday Night Science to compare the hard numbers from the FBI’s last year of reporting. Specifically, we analyzed the FBI’s Uniform Crime Report, which summarizes the number of murders in each city annually.
We only looked at every single city in Minnesota for which FBI data was available for the most recent FBI Crime In The United States. That left us with 39 cities to rank.
We took the number of murders per capita as the ranking factor. The place with the most murders per capita based on the most recent data is Minneapolis. It is our eleventh time ranking the places with the most murders per capita in Minnesota. We updated the list for 2026.
Summary: The Places With The Most Murders In Minnesota For 2026
If you’re looking at the places in Minnesota with the most murders, and where residents have the highest chances of being killed themselves, this is an accurate list. Again, these statistics are an indication of where crimes occur, not a statement about the effectiveness of the law enforcement in the areas they serve.
The cities with the highest murder per capita in Minnesota are Minneapolis, Brooklyn Center, Wyoming, Bemidji, Waite Park, Thief River Falls, Little Falls, Waseca, St. Paul, and Brooklyn Park.
For more Minnesota reading, check out:
- Best Places To Raise A Family In Minnesota
- Fastest Growing Cities In Minnesota
- Safest Places In Minnesota
- Best Cities For Singles In Minnesota
- Worst Places To Live In Minnesota
Murder Rates By City In Minnesota
| Rank | City | Population | Murders | Murders/100K |
|---|---|---|---|---|
| 1 | Minneapolis, MN | 422341 | 72 | 17.05 |
| 2 | Brooklyn Center, MN | 31522 | 5 | 15.86 |
| 3 | Wyoming, MN | 8066 | 1 | 12.4 |
| 4 | Bemidji, MN | 16221 | 2 | 12.33 |
| 5 | Waite Park, MN | 8377 | 1 | 11.94 |
| 6 | Thief River Falls, MN | 8939 | 1 | 11.19 |
| 7 | Little Falls, MN | 9083 | 1 | 11.01 |
| 8 | Waseca, MN | 9113 | 1 | 10.97 |
| 9 | St. Paul, MN | 300368 | 27 | 8.99 |
| 10 | Brooklyn Park, MN | 81920 | 7 | 8.54 |
| 11 | Roseville, MN | 35466 | 3 | 8.46 |
| 12 | North St. Paul, MN | 12866 | 1 | 7.77 |
| 13 | Marshall, MN | 13726 | 1 | 7.29 |
| 14 | Fridley, MN | 30656 | 2 | 6.52 |
| 15 | Red Wing, MN | 16725 | 1 | 5.98 |
| 16 | Hopkins, MN | 17911 | 1 | 5.58 |
| 17 | Albert Lea, MN | 18347 | 1 | 5.45 |
| 18 | Sartell, MN | 19862 | 1 | 5.03 |
| 19 | South St. Paul, MN | 20403 | 1 | 4.9 |
| 20 | New Hope, MN | 20613 | 1 | 4.85 |
| 21 | Forest Lake, MN | 20936 | 1 | 4.78 |
| 22 | Moorhead, MN | 45026 | 2 | 4.44 |
| 23 | St. Cloud, MN | 69922 | 3 | 4.29 |
| 24 | Winona, MN | 25770 | 1 | 3.88 |
| 25 | Edina, MN | 51980 | 2 | 3.85 |
| 26 | Austin, MN | 26212 | 1 | 3.82 |
| 27 | Owatonna, MN | 26501 | 1 | 3.77 |
| 28 | Prior Lake, MN | 28390 | 1 | 3.52 |
| 29 | Bloomington, MN | 86793 | 3 | 3.46 |
| 30 | Lakeville, MN | 76929 | 2 | 2.6 |
| 31 | Plymouth, MN | 77576 | 2 | 2.58 |
| 32 | St. Louis Park, MN | 48241 | 1 | 2.07 |
| 33 | Minnetonka, MN | 51791 | 1 | 1.93 |
| 34 | Eden Prairie, MN | 61645 | 1 | 1.62 |
| 35 | Burnsville, MN | 63650 | 1 | 1.57 |
| 36 | Eagan, MN | 66943 | 1 | 1.49 |
| 37 | Maple Grove, MN | 70729 | 1 | 1.41 |
| 38 | Duluth, MN | 86570 | 1 | 1.16 |
| 39 | Rochester, MN | 122035 | 1 | 0.82 |