
Do you live in one of the murder capitals of South Carolina?
We all watch the news with horror when we hear about a homicide that happens not that far away from us. While a murder just blocks or even a couple of towns away from your house would make anyone uneasy, in the long run, most likely, where you live is relatively safe.
To find the cities in South Carolina with the most murders and the highest murder rates per capita, we used Saturday Night Science to compare the FBI crime data on murders for the 42 cities in the Palmetto State with over 5,000 residents.
Table Of Contents: Top Ten | Methodology | Summary | Table
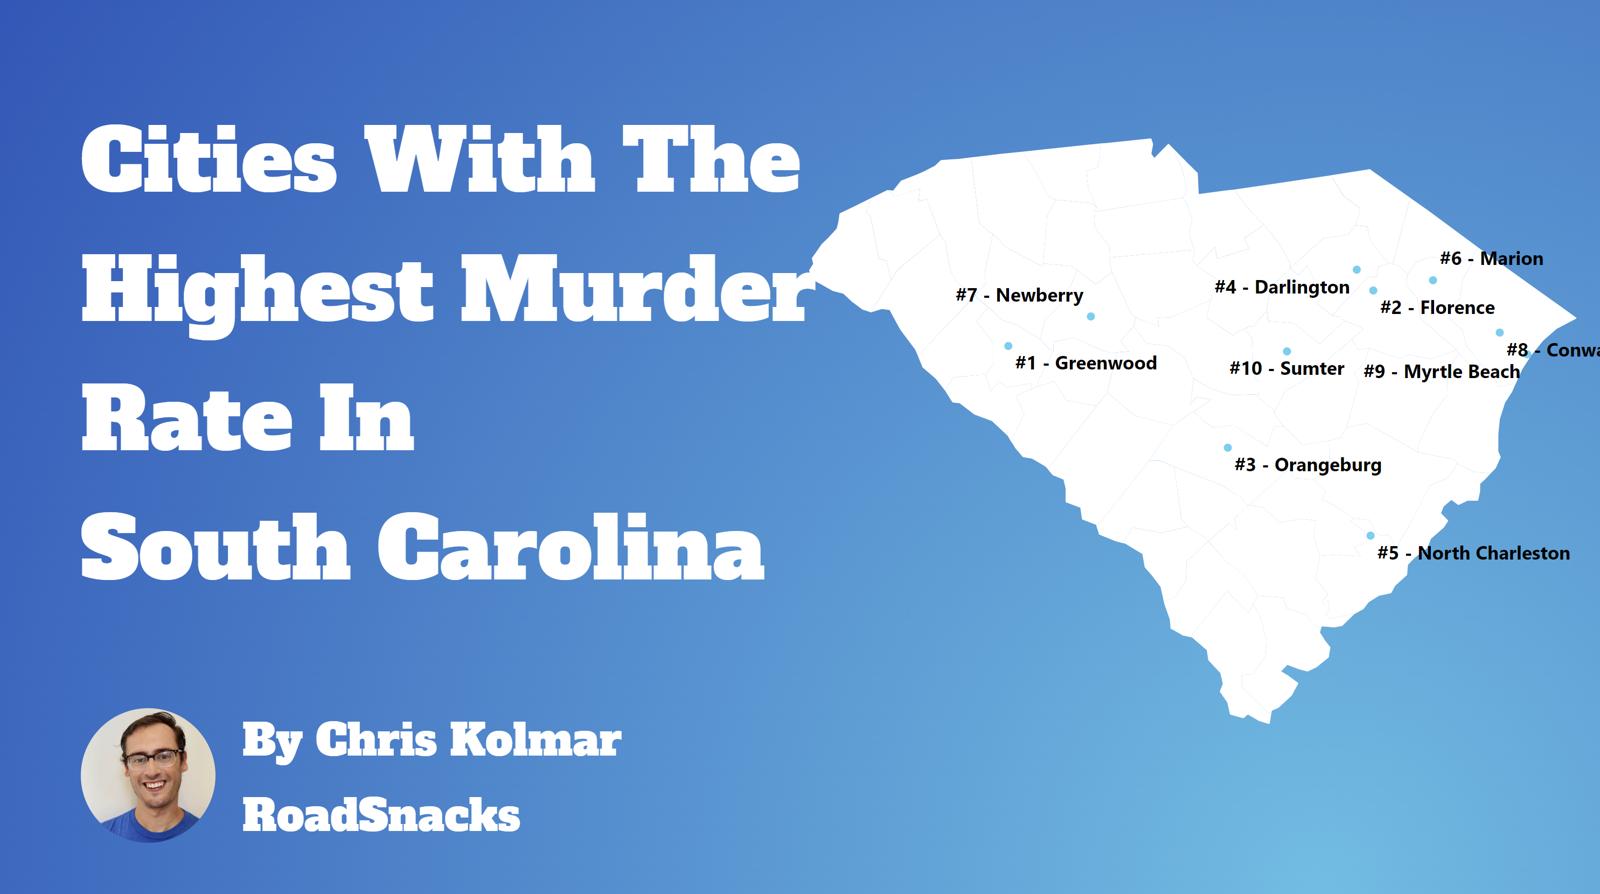
Cities With Highest Murder Rates In South Carolina
What city has the highest murder rate in South Carolina? The city with the highest murder rate in South Carolina is Chester with 76.7 murders per 100,000 people.
What is the city in South Carolina with highest number of murders? The city in South Carolina with the highest number of murders is North Charleston with 21 murders.
Read on below to see how we crunched the numbers and how your town in South Carolina ranked. There were ‘only’ 42 cities in South Carolina where a city reported a murder to the FBI, meaning 19 places had no murder.
For more reading on the Palmetto State check out:
- Best Places To Live In South Carolina
- Cheapest Places To Live In South Carolina
- Most Dangerous Cities In South Carolina
The 10 Murder Capitals Of South Carolina For 2026

/10
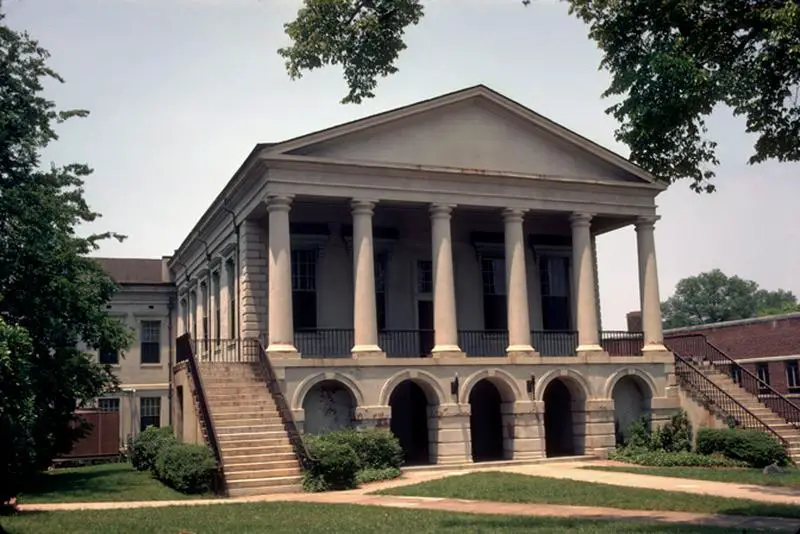
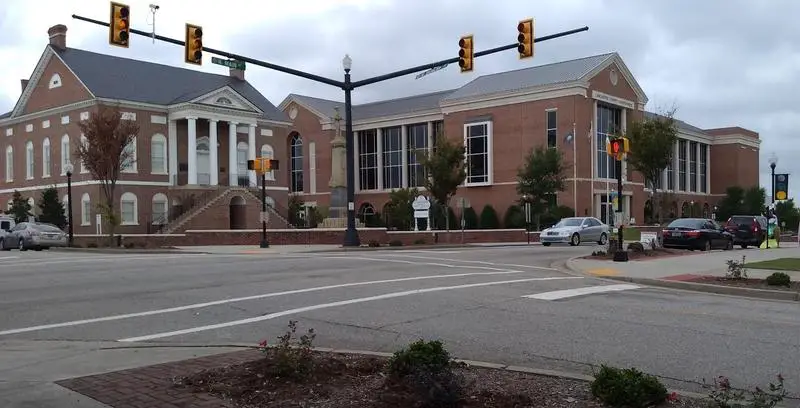
Population: 5,212
Murders: 4 (12th Most)
Murders Per 100k: 76.7 (Most)
More on Chester: Data | Crime | Cost Of Living | Movers

/10
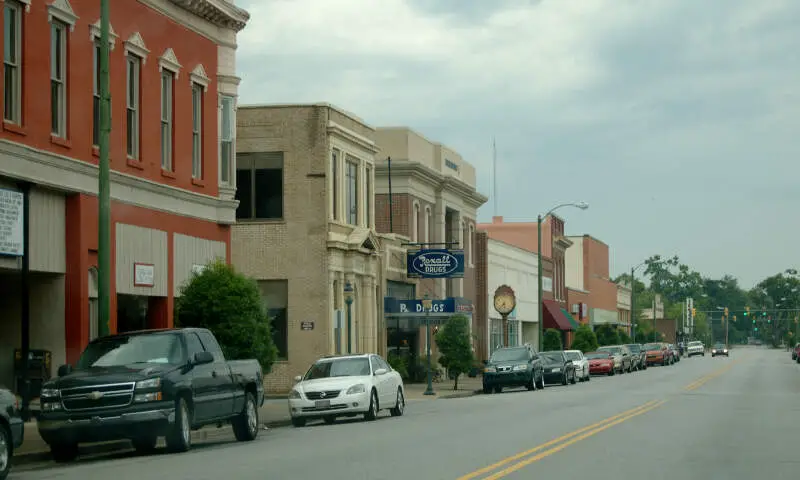
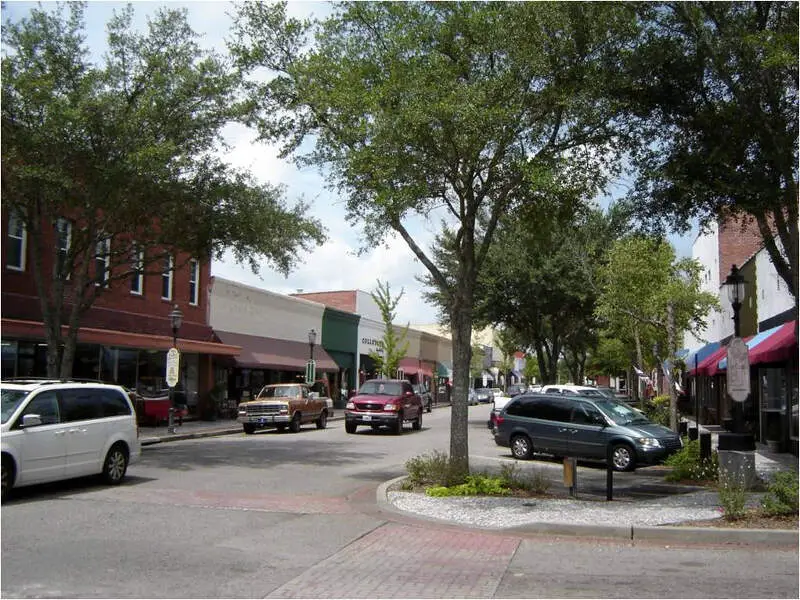
Population: 6,123
Murders: 4 (12th Most)
Murders Per 100k: 65.3 (2nd Most)
More on Marion: Data | Crime | Cost Of Living | Movers

/10
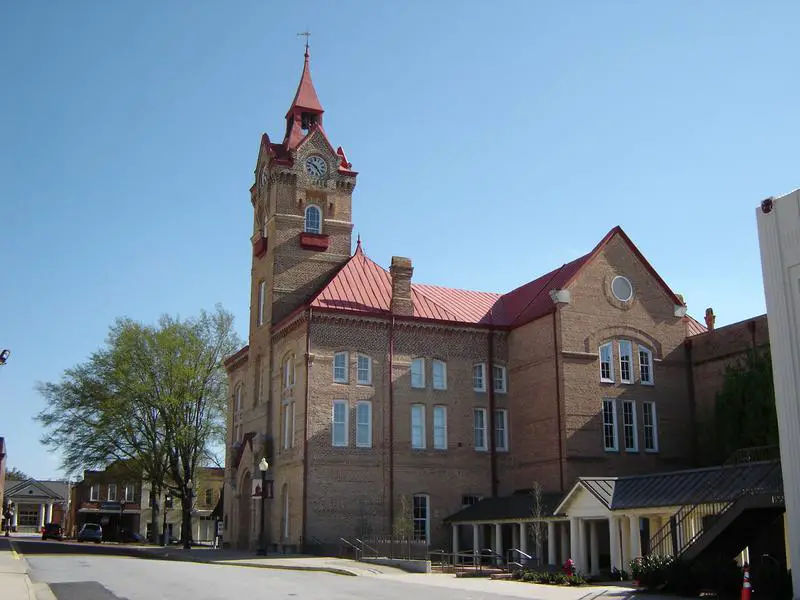
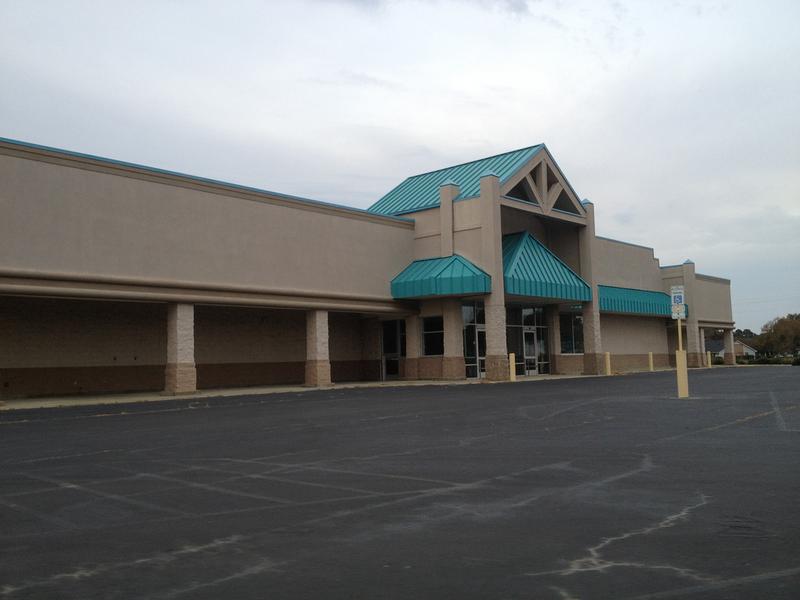
Population: 10,926
Murders: 5 (8th Most)
Murders Per 100k: 45.8 (3rd Most)
More on Newberry: Data | Crime | Cost Of Living | Movers

/10
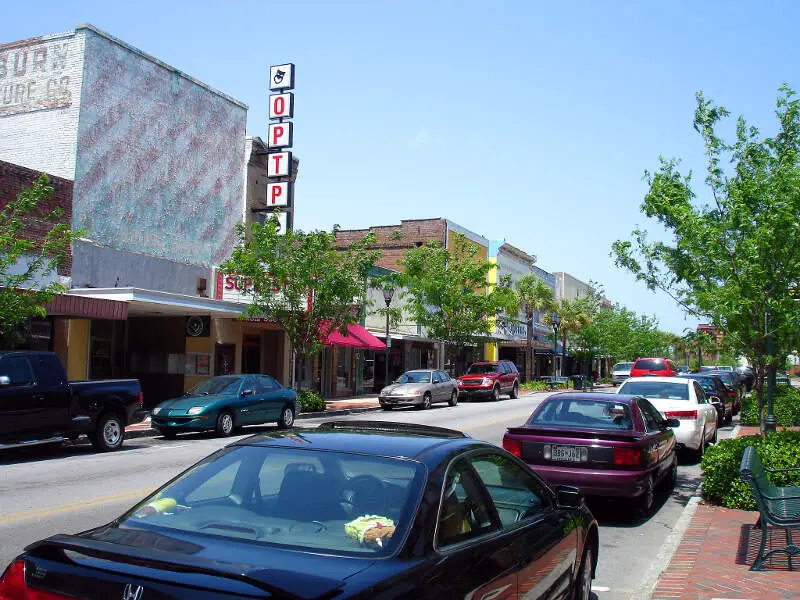
Population: 9,305
Murders: 4 (12th Most)
Murders Per 100k: 43.0 (4th Most)
More on Lancaster: Data | Cost Of Living | Movers
/10
Population: 5,465
Murders: 2 (24th Most)
Murders Per 100k: 36.6 (5th Most)
More on Walterboro: Data | Crime | Cost Of Living | Movers

/10
Population: 6,430
Murders: 2 (24th Most)
Murders Per 100k: 31.1 (6th Most)
More on Bennettsville: Data | Crime | Cost Of Living | Movers

/10
Population: 13,320
Murders: 4 (12th Most)
Murders Per 100k: 30.0 (7th Most)
More on Orangeburg: Data | Crime | Cost Of Living | Movers

/10
Population: 7,743
Murders: 2 (24th Most)
Murders Per 100k: 25.8 (8th Most)
More on Clinton: Data | Crime | Cost Of Living | Movers


/10
Population: 7,795
Murders: 2 (24th Most)
Murders Per 100k: 25.7 (9th Most)
More on Union: Data | Crime | Cost Of Living | Movers

/10
Population: 42,551
Murders: 10 (3rd Most)
Murders Per 100k: 23.5 (10th Most)
More on Sumter: Data | Crime | Cost Of Living | Movers
Methodology: How we calculated the murder capitals of South Carolina
While there are surveys and public polls on what cities in a state are the most dangerous, we wanted to rely on something other than speculation and opinion. Instead, we used Saturday Night Science to compare the hard numbers from the FBI’s last year of reporting. Specifically, we analyzed the FBI’s Uniform Crime Report, which summarizes the number of murders in each city annually.
We only looked at every single city in South Carolina for which FBI data was available for the most recent FBI Crime In The United States. That left us with 42 cities to rank.
We took the number of murders per capita as the ranking factor. The place with the most murders per capita based on the most recent data is Chester. It is our eleventh time ranking the places with the most murders per capita in South Carolina. We updated the list for 2026.
Summary: The Places With The Most Murders In South Carolina For 2026
If you’re looking at the places in South Carolina with the most murders, and where residents have the highest chances of being killed themselves, this is an accurate list. Again, these statistics are an indication of where crimes occur, not a statement about the effectiveness of the law enforcement in the areas they serve.
The cities with the highest murder per capita in South Carolina are Chester, Marion, Newberry, Lancaster, Walterboro, Bennettsville, Orangeburg, Clinton, Union, and Sumter.
For more South Carolina reading, check out:
- Best Places To Raise A Family In South Carolina
- Fastest Growing Cities In South Carolina
- Safest Places In South Carolina
- Best Cities For Singles In South Carolina
- Worst Places To Live In South Carolina
Murder Rates By City In South Carolina
| Rank | City | Population | Murders | Murders/100K |
|---|---|---|---|---|
| 1 | Chester, SC | 5212 | 4 | 76.75 |
| 2 | Marion, SC | 6123 | 4 | 65.33 |
| 3 | Newberry, SC | 10926 | 5 | 45.76 |
| 4 | Lancaster, SC | 9305 | 4 | 42.99 |
| 5 | Walterboro, SC | 5465 | 2 | 36.6 |
| 6 | Bennettsville, SC | 6430 | 2 | 31.1 |
| 7 | Orangeburg, SC | 13320 | 4 | 30.03 |
| 8 | Clinton, SC | 7743 | 2 | 25.83 |
| 9 | Union, SC | 7795 | 2 | 25.66 |
| 10 | Sumter, SC | 42551 | 10 | 23.5 |
| 11 | North Charleston, SC | 123511 | 21 | 17.0 |
| 12 | Lake City, SC | 5937 | 1 | 16.84 |
| 13 | Darlington, SC | 6013 | 1 | 16.63 |
| 14 | West Columbia, SC | 18591 | 3 | 16.14 |
| 15 | Gaffney, SC | 12399 | 2 | 16.13 |
| 16 | Florence, SC | 40781 | 6 | 14.71 |
| 17 | Hardeeville, SC | 13740 | 2 | 14.56 |
| 18 | Hartsville, SC | 7389 | 1 | 13.53 |
| 19 | Greenwood, SC | 22478 | 3 | 13.35 |
| 20 | Myrtle Beach, SC | 41022 | 5 | 12.19 |
| 21 | Aiken, SC | 33221 | 4 | 12.04 |
| 22 | Rock Hill, SC | 75975 | 9 | 11.85 |
| 23 | Camden, SC | 8651 | 1 | 11.56 |
| 24 | Moncks Corner, SC | 17854 | 2 | 11.2 |
| 25 | Travelers Rest, SC | 9088 | 1 | 11.0 |
| 26 | Seneca, SC | 9106 | 1 | 10.98 |
| 27 | York, SC | 9366 | 1 | 10.68 |
| 28 | Conway, SC | 29015 | 3 | 10.34 |
| 29 | Forest Acres, SC | 10309 | 1 | 9.7 |
| 30 | Columbia, SC | 144559 | 14 | 9.68 |
| 31 | Greenville, SC | 73405 | 7 | 9.54 |
| 32 | Goose Creek, SC | 50294 | 4 | 7.95 |
| 33 | Cayce, SC | 13628 | 1 | 7.34 |
| 34 | Beaufort, SC | 13937 | 1 | 7.18 |
| 35 | Mauldin, SC | 29180 | 2 | 6.85 |
| 36 | Bluffton, SC | 37927 | 2 | 5.27 |
| 37 | Spartanburg, SC | 39186 | 2 | 5.1 |
| 38 | Charleston, SC | 156898 | 7 | 4.46 |
| 39 | Summerville, SC | 52148 | 2 | 3.84 |
| 40 | Easley, SC | 27617 | 1 | 3.62 |
| 41 | Anderson, SC | 30150 | 1 | 3.32 |
| 42 | Greer, SC | 47690 | 1 | 2.1 |
Who doing the reporting? Bc I went to 3 funerals in the month of December alone in Huntsville SC….. I know they had at least 8 murders in 2018….and so far in 2019 it’s been 3….they really got the data wrong….. The numbers are way off for the city of Florence as well….. It’s sad around those parts…
Correction hartsville sc
Are we still going to pretend that all cultures are the same? Cross reference the murder stats with demographics & you have your answer as to why the outrageous level of violence exists in certain “communities”.
But we’ll all just keep pretending that “diversity is our strength”.
Wow, first off I agree that whoever does the reporting needs a new method because that list don’t even look right and I live in West Columbia, but I’d also like to add that the same ones compiling lists and statistics for the crime rate so they can supposedly come up with a effective method of making “communities” better actually have to attempt to do so. However the system was built the way it is to keep the ones on top on top and making money because that’s what it’s really about and the worst part is that we as a whole….as in ONE whole human race have been conditioned since birth to fall into that cycle and/or believe it to really be what it’s said it is….wake up. Then question if you were brought up in a community that didn’t figure out how to make the proper and correct support and resources to help develop the people of your community to be the strength that absolutely can be found in diversity obtainable, without any other underlying selfish greedy motive, then what do you really expect from that community that hasn’t been given any room to thrive and instead been placed in a cycle that perpetuates violence, and for most, it’s only a way to survive day to day……so don’t blame communities based on the majority of a ethnicity, race, poverty level within it as the problem, that’s the effect, the problem is people who are supposed to be backing that community are only backing it into a corner.
I agree this cannot possibly be for 2019!!! There’s comments from May 2019 in here ♂️ Not Possible!!! I also agree that the people that are supposed to be helping certain communities obviously are helping themselves…to put it bluntly…Hopefully you can vote them Out and get someone with some integrity in office… The (system) is a disgrace because these career politicians have made laws for themselves that WE THE PEOPLE Have been left Out of!!! OUR Government has become a Joke!!! And it’s past time for Us to do Something about it!!! Problem is the only way we can is to Vote these career politicians OUT and vote for someone who (at least says) they are for term limits!!! Thanks and Have a Blessed Day
1 in Beaufort!? I can count 3 in the last 3 months. Where are you getting your information from. It’s wrong.
Anderson had 2 murders within hours of it turning into 2019 so get your facts right let alone a double homicide involving a pregnant teen and her friend in January and that little 11 year old girl in a drive by halfway though the year.
For real? I know N. Charleston is dangerous but bro. Downtown Charleston got more Murders to u know. Cause I been to 5 funerals in a 4months span in 2014. So yeah this isn’t right♂️.