
Oklahoma City’s neighborhoods conjure up too many stereotypes to count. You’ve got hipster areas, preppy places, neighborhoods where college kids thrive, and of course, ghettos.
It seems as if there’s a neighborhood for everyone in Oklahoma City.
And while the city consistently ranks as one of the best places to live in Oklahoma thanks in part to tons of entertainment and jobs, it’s not all rainbows and sunshine in Oklahoma City. Some neighborhoods aren’t as safe as others.
So the question arises, which Oklahoma City neighborhoods are the most dangerous and which are the safest?
Today, we’ll use Saturday Night Science to determine which Oklahoma City hoods need a little tender loving care – the sore thumbs of the Oklahoma City area if you will. Realistically, you can’t expect all the neighborhoods to be amazing, although Nichols Hills ranks way above the rest.
We examined 24 of Oklahoma City’s neighborhoods to find out the most dangerous places to live. These places don’t quite measure up to Oklahoma City’s reputation.
The Most Dangerous Neighborhoods In Oklahoma City For 2023
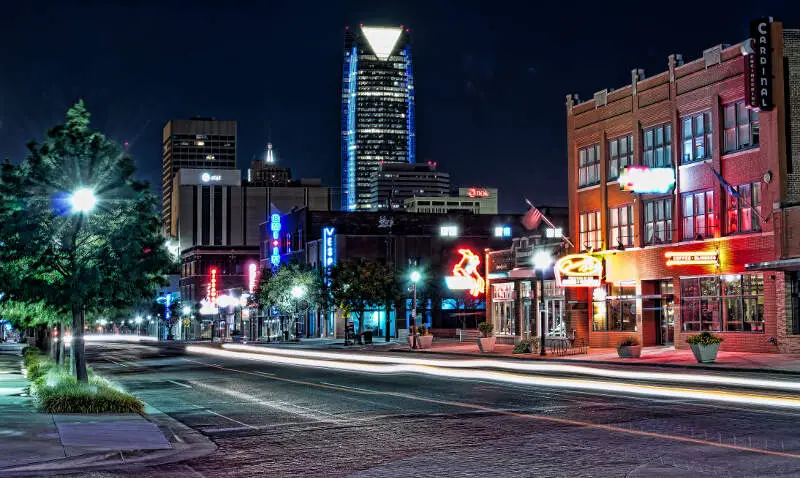
- Flatiron District
- Presbyterian Health Foundation Research Park
- Meridian Avenue Hospitality Corridor
- Stockyards City
- Inner City Southside
- Downtown
- Bricktown
- Deep Deuce
- Paseo Artists District
- Adventure District
So what’s the worst neighborhood to live in Oklahoma City for 2023? According to the most recent census data, Flatiron District looks to be the worst neighborhood in Oklahoma City.
Read on to see how we determined the places around Oklahoma City that need a pick-me-up. And remember, don’t blame the messenger.
For more Oklahoma reading, check out:
- Best Places To Live In Oklahoma
- Cheapest Places To Live In Oklahoma
- Most Dangerous Cities In Oklahoma
Table Of Contents: Top 10 | Methodology | Summary | Table
The 10 Most Dangerous Neighborhoods In Oklahoma City For 2023
1. Flatiron District
Population: 98
Median Home Value: $108,449 (9th worst)
Median Income: $15,368 (2nd worst)
2. Presbyterian Health Foundation Research Park
Population: 105
Median Home Value: $108,449 (9th worst)
Median Income: $15,368 (2nd worst)
3. Meridian Avenue Hospitality Corridor
Population: 658
Median Home Value: $66,469 (2nd worst)
Median Income: $50,031 (16th worst)
4. Stockyards City
Population: 193
Median Home Value: $98,529 (5th worst)
Median Income: $35,682 (7th worst)
5. Inner City Southside
Population: 8,956
Median Home Value: $72,102 (3rd worst)
Median Income: $25,738 (3rd worst)
6. Downtown
Population: 3,425
Median Home Value: $111,510 (12th worst)
Median Income: $44,680 (12th worst)
7. Bricktown
Population: 221
Median Home Value: $125,455 (15th worst)
Median Income: $28,155 (5th worst)
8. Deep Deuce
Population: 565
Median Home Value: $108,449 (9th worst)
Median Income: $71,696 (22nd worst)
9. Paseo Artists District
Population: 112
Median Home Value: $96,847 (4th worst)
Median Income: $37,929 (9th worst)
10. Adventure District
Population: 2,506
Median Home Value: $133,322 (17th worst)
Median Income: $40,034 (10th worst)
Methodology: How we determined the most dangerous Oklahoma City neighborhoods in 2023
To figure out how bad a place is to live in, we only needed to know what kinds of things people like and then decide what places have the least amount of those things. We plugged the following criteria into Saturday Night Science to get the worst neighborhoods in Oklahoma City:
- High crime (Estimated)
- High unemployment (Less jobs)
- Low median income (Less pay)
- Low population density (No things to do)
- Low home values (No one’s willing to pay to live here)
Then, we ranked each neighborhood in Oklahoma City, Oklahoma for each of these criteria from worst to best.
Next, we averaged the individual rankings for each criterion into a “Worst Score.”
The neighborhood with the lowest “Worst Score” ranks as the most dangerous neighborhood of Oklahoma City.
The article is an opinion based on facts and is meant as infotainment. We updated this article for 2023. This report is our time ranking the worst neighborhoods to live in Oklahoma City.
Skip to the end to see the list of all 24 neighborhoods ranked from worst to best.
Summary: The Worst Neighborhoods Around Oklahoma City
Well, there you have it — the worst of the neighborhoods in Oklahoma City with Flatiron District landing at the bottom of the pack.
As mentioned earlier, the neighborhoods in Oklahoma City aren’t all bad. Nichols Hills takes the cake as the best place to live in Oklahoma City.
We ranked the neighborhoods from worst to best in the chart below.
For more Oklahoma reading, check out:
Most Dangerous Neighborhoods To Live In Oklahoma City For 2023?
| Rank | Neighborhood | Population | Home Value | Median Income |
|---|---|---|---|---|
| 1 | Flatiron District | 98 | $108,449 | $15,368 |
| 2 | Presbyterian Health Foundation Research Park | 105 | $108,449 | $15,368 |
| 3 | Meridian Avenue Hospitality Corridor | 658 | $66,469 | $50,031 |
| 4 | Stockyards City | 193 | $98,529 | $35,682 |
| 5 | Inner City Southside | 8,956 | $72,102 | $25,738 |
| 6 | Downtown | 3,425 | $111,510 | $44,680 |
| 7 | Bricktown | 221 | $125,455 | $28,155 |
| 8 | Deep Deuce | 565 | $108,449 | $71,696 |
| 9 | Paseo Artists District | 112 | $96,847 | $37,929 |
| 10 | Adventure District | 2,506 | $133,322 | $40,034 |
| 11 | Warr Acres | 1,627 | $102,158 | $37,732 |
| 12 | Automobile Alley | 379 | $160,260 | $55,347 |
| 13 | I-40 Expansion Area | 505 | $125,455 | $26,197 |
| 14 | Inner City Northside | 49,067 | $123,882 | $45,616 |
| 15 | Capitol Hill | 298 | $65,439 | $71,310 |
| 16 | Medical Community | 1,211 | $100,702 | $28,188 |
| 17 | Oklahoma School Of Science And Mathematics | 502 | $193,547 | $55,322 |
| 18 | Eastside | 5,463 | $188,978 | $59,694 |
| 19 | Northwest 39 Street Enclave | 584 | $108,757 | $41,350 |
| 20 | Arts District | 2,091 | $125,455 | $48,746 |
| 21 | Suburban Northside | 152,038 | $204,806 | $55,096 |
| 22 | Asia District | 538 | $134,730 | $47,725 |
| 23 | Quail Springs | 2,511 | $315,957 | $82,822 |
| 24 | Nichols Hills | 3,003 | $639,319 | $111,119 |