
Most Americans have never been to small town New Jersey. However, as the New Jerseyan who live there know, small town New Jersey is an awesome place to call home.
But is it all roses? Definitely not. Just like any other state, New Jersey has its trouble spots. This article aims to determine, using Saturday Night Science, the absolute worst small towns to live in the Garden State. Don’t freak out, we will use data to show which places have high crime, poverty, and unemployment.
After analyzing more than 195 of New Jersey’s smallest cities, we came up with this list as the 10 worst small towns in New Jersey where you’d never want to live:
Table Of Contents: Top Ten | Methodology | Summary | Table
These are the worst small towns in New Jersey for 2025:
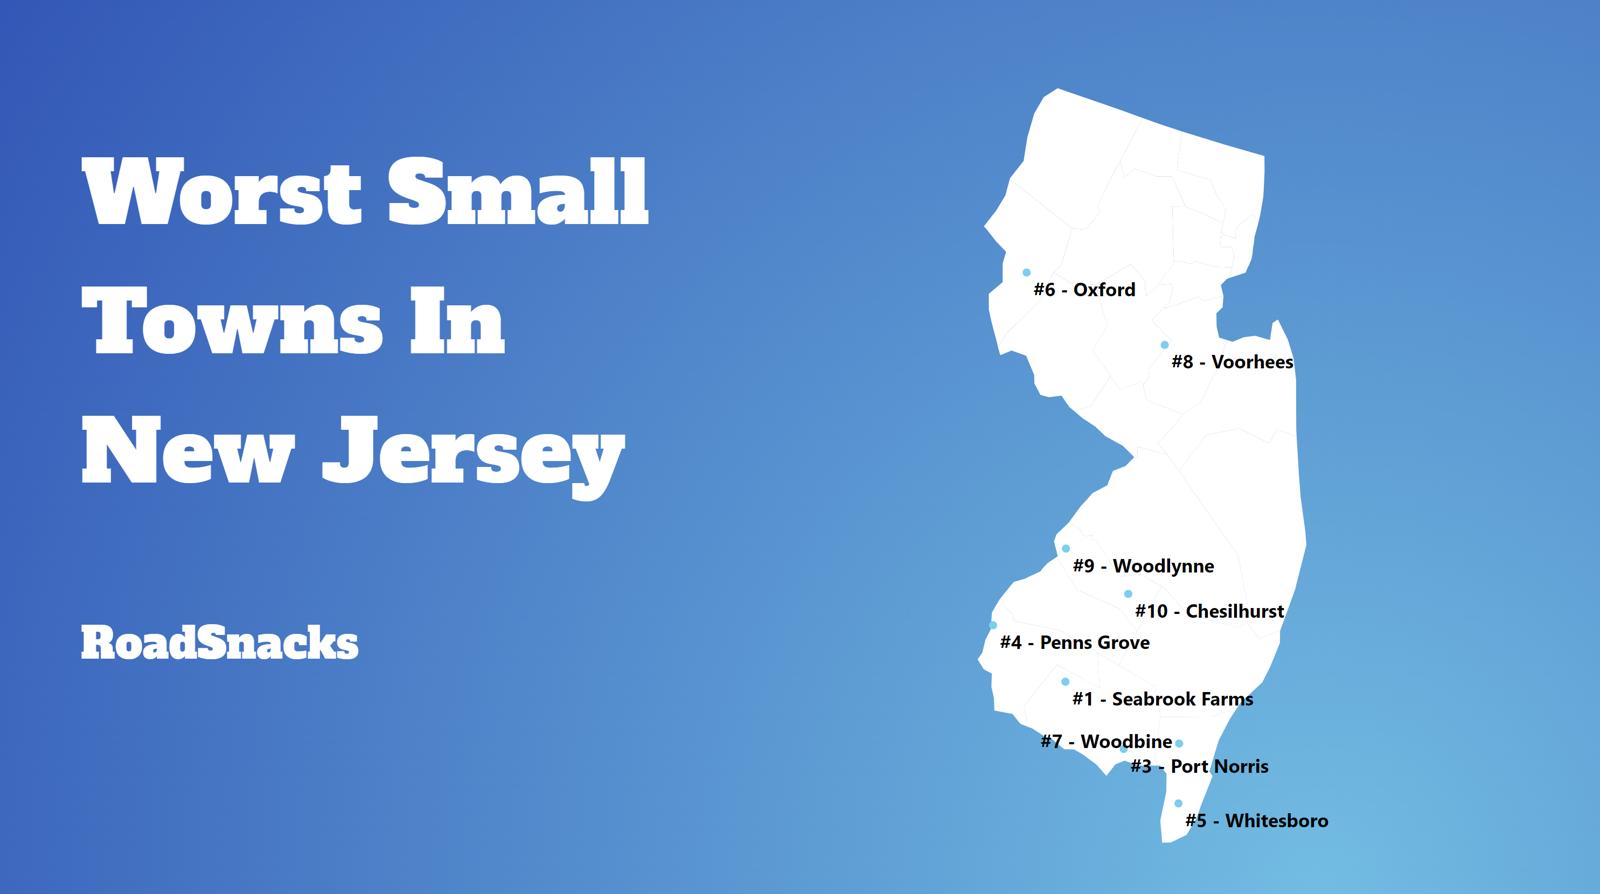
So what is the worst small town to call home in New Jersey for 2025? According to the most recent census data, Seabrook Farms is the worst small town to live in New Jersey.
While many of these small towns have seen better days, they have wonderful communities and people. This report in no way means to knock the folks that call towns like Seabrook Farms home. Everyone
Read on below to see how we crunched the numbers, or scroll to the bottom to see how your town ranked.
And if you already know about the small towns, check out the best places to live in New Jersey or the worst places to live in New Jersey.
If you’re looking for something more national, check out the worst cities in America or the worst states in America.
The 10 Worst Small Towns In New Jersey For 2025
1. Seabrook Farms
/10
Population: 1,469
Median Home Value: $255,300
Median Income: $43,815
Unemployment Rate: 11.0%
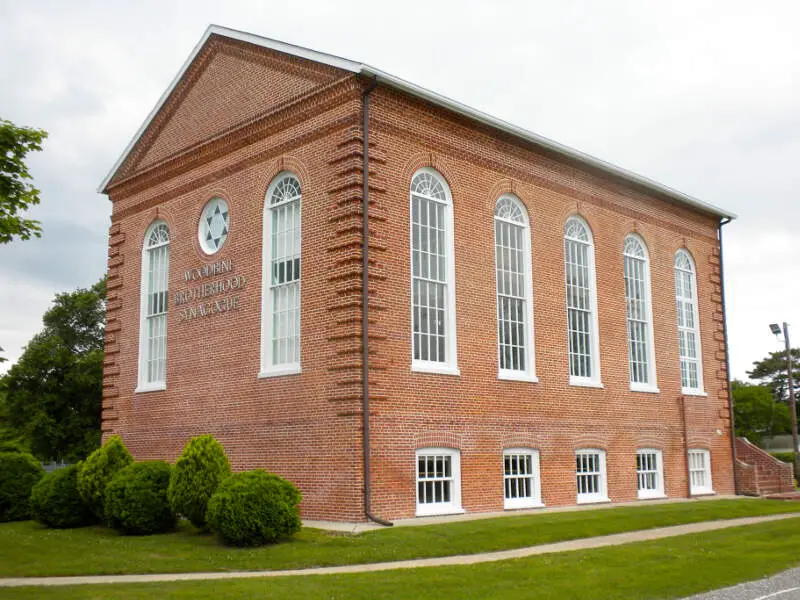
2. Woodbine
/10
Population: 2,083
Median Home Value: $199,800
Median Income: $45,179
Unemployment Rate: 7.2%
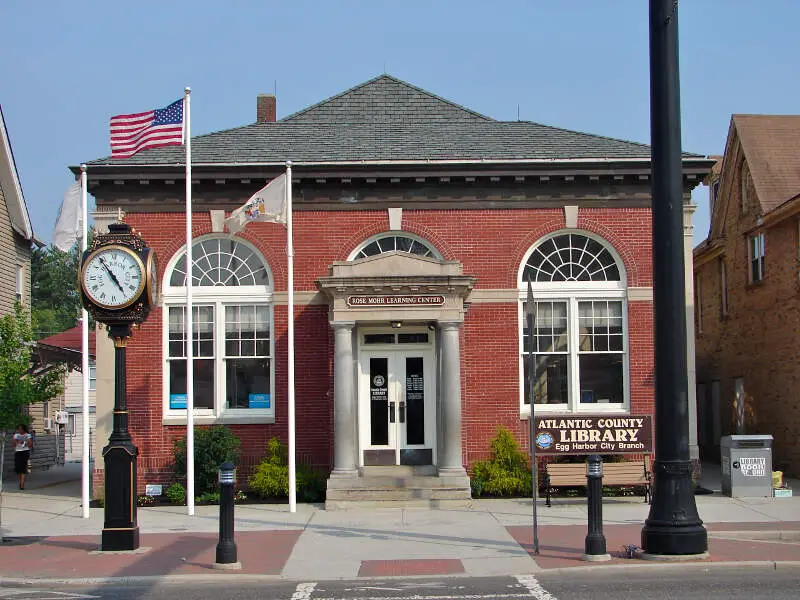
3. Egg Harbor City
/10
Population: 4,378
Median Home Value: $182,100
Median Income: $67,604
Unemployment Rate: 11.6%
4. Voorhees
/10
Population: 1,775
Median Home Value: $361,300
Median Income: $66,927
Unemployment Rate: 16.3%
5. Penns Grove
/10
Population: 4,860
Median Home Value: $170,100
Median Income: $43,889
Unemployment Rate: 16.9%
6. Buena
/10
Population: 4,500
Median Home Value: $249,100
Median Income: $78,393
Unemployment Rate: 12.2%
7. Whitesboro
/10
Population: 2,946
Median Home Value: $242,100
Median Income: $94,145
Unemployment Rate: 11.3%
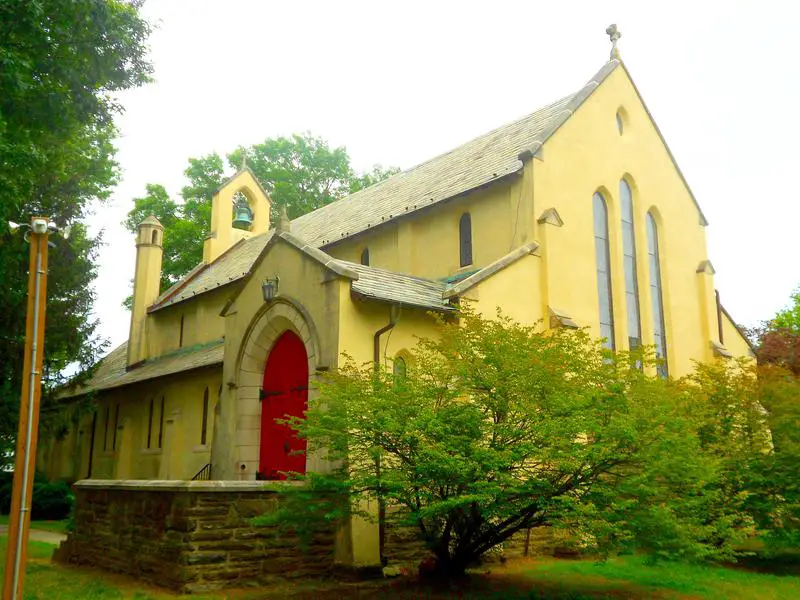
8. Oxford
/10
Population: 1,140
Median Home Value: $175,000
Median Income: $77,188
Unemployment Rate: 8.4%
9. Victory Gardens
/10
Population: 1,891
Median Home Value: $224,800
Median Income: $52,235
Unemployment Rate: 8.4%
10. Lawnside
/10
Population: 3,124
Median Home Value: $215,100
Median Income: $70,338
Unemployment Rate: 12.0%
Methodology: How do you decide if a small place in New Jersey is lousy or not?
To rank the worst small towns to live in New Jersey, we had to determine what criteria people like or dislike about a place. Assuming that people like low crime, solid education, things to do, and a stable economy isn’t a stretch.
We then analyzed the criteria using Saturday Night Science, the thinking you’d use at a bar. It seems like even your crazy Uncle would agree that a town with high crime is worse than a town with low crime; all else the same.
Using FBI crime data and the Census’s 2019-2023 American Community Survey, this is the criteria we used:
- Population Density (The lower, the worse)
- Highest Unemployment Rates
- Low housing costs (meaning there’s no demand)
- Adjusted Median Income (Median income adjusted for the cost of living)
- Education (Number of high school dropouts)
- High Crime
We looked at cities with populations between 1,000 and 5,000 people, of which there were many – 195 to be exact.
We get the crime numbers from the FBI, which gets them from the cities. Dropout numbers are based on the adult population, not just the current graduation rates of teenagers.
We base all our research on facts, which is meant as infotainment. We updated this article for 2025, which is our tenth time ranking the worst small places to live in New Jersey.
There You Have It – The Worst Small Towns In New Jersey
If you’re analyzing teeny places in the Garden State with the worst economic situations, where there’s high crime and there’s not a lot to do, this is an accurate list.
The worst small towns in New Jersey are Seabrook Farms, Woodbine, Egg Harbor City, Voorhees, Penns Grove, Buena, Whitesboro, Oxford, Victory Gardens, and Lawnside.
If you’re curious enough, here are the best small towns to live in New Jersey, according to science:
- Hopewell (Pop. 1,828)
- Mountain Lakes (Pop. 4,535)
- Ho-Ho-Kus (Pop. 4,230)
For more New Jersey reading, check out:
Worst Small Towns In New Jersey
| Rank | Town | Population | Unemployment Rate | Home Value | Median Income |
|---|---|---|---|---|---|
| 1 | Seabrook Farms | 1,469 | 11.0% | $255,300 | $43,815 |
| 2 | Woodbine | 2,083 | 7.2% | $199,800 | $45,179 |
| 3 | Egg Harbor City | 4,378 | 11.6% | $182,100 | $67,604 |
| 4 | Voorhees | 1,775 | 16.3% | $361,300 | $66,927 |
| 5 | Penns Grove | 4,860 | 16.9% | $170,100 | $43,889 |
| 6 | Buena | 4,500 | 12.2% | $249,100 | $78,393 |
| 7 | Whitesboro | 2,946 | 11.3% | $242,100 | $94,145 |
| 8 | Oxford | 1,140 | 8.4% | $175,000 | $77,188 |
| 9 | Victory Gardens | 1,891 | 8.4% | $224,800 | $52,235 |
| 10 | Lawnside | 3,124 | 12.0% | $215,100 | $70,338 |
| 11 | East Newark | 2,529 | 12.1% | $277,700 | $65,272 |
| 12 | Presidential Lakes Estates | 1,927 | 12.3% | $221,800 | $84,038 |
| 13 | Rio Grande | 3,285 | 13.2% | $311,900 | $97,590 |
| 14 | Leisure Village East | 4,309 | 17.5% | $211,600 | $47,231 |
| 15 | Woodlynne | 2,899 | 10.1% | $129,900 | $71,635 |
| 16 | Cedar Glen Lakes | 1,509 | 9.5% | $97,000 | $33,958 |
| 17 | Chesilhurst | 1,340 | 5.5% | $215,100 | $89,904 |
| 18 | Holiday Heights | 2,118 | 9.7% | $318,400 | $56,796 |
| 19 | Victory Lakes | 1,403 | 8.3% | $228,000 | $97,273 |
| 20 | Franklin | 4,938 | 7.1% | $253,100 | $90,152 |
| 21 | Lakehurst | 2,666 | 5.8% | $225,800 | $80,458 |
| 22 | Port Norris | 1,702 | 2.7% | $120,100 | $42,635 |
| 23 | Westville | 4,285 | 6.1% | $183,500 | $78,333 |
| 24 | Seaside Heights | 1,992 | 6.9% | $376,700 | $58,988 |
| 25 | New Egypt | 1,949 | 9.4% | $356,200 | $67,633 |
| 26 | Folsom | 1,732 | 9.1% | $247,900 | $112,857 |
| 27 | Hampton | 1,127 | 6.4% | $298,000 | $77,222 |
| 28 | Brooklawn | 1,788 | 5.7% | $148,700 | $55,882 |
| 29 | Silver Ridge | 1,176 | 4.6% | $213,100 | $35,056 |
| 30 | Leisuretowne | 3,244 | 9.2% | $220,800 | $51,420 |
| 31 | Pine Ridge At Crestwood | 2,756 | 4.9% | $133,800 | $61,563 |
| 32 | Pemberton | 1,373 | 5.5% | $303,200 | $88,333 |
| 33 | Groveville | 3,007 | 12.3% | $347,900 | $108,362 |
| 34 | South Bound Brook | 4,833 | 9.4% | $345,300 | $102,019 |
| 35 | Tuckerton | 3,616 | 8.3% | $297,200 | $78,934 |
| 36 | National Park | 3,043 | 6.6% | $207,400 | $81,507 |
| 37 | Laurel Lake | 2,514 | 3.8% | $138,100 | $51,633 |
| 38 | Blackwood | 4,615 | 5.8% | $231,000 | $81,154 |
| 39 | Rosenhayn | 1,066 | 1.2% | $210,400 | $1,000 |
| 40 | South Toms River | 3,701 | 8.0% | $269,200 | $101,466 |
| 41 | Beverly | 2,489 | 6.8% | $190,100 | $92,807 |
| 42 | Forked River | 4,988 | 8.9% | $404,600 | $87,455 |
| 43 | Gibbsboro | 2,337 | 8.2% | $278,200 | $99,881 |
| 44 | Flemington | 4,887 | 3.7% | $372,700 | $74,213 |
| 45 | Elmer | 1,152 | 3.6% | $206,300 | $92,757 |
| 46 | Swedesboro | 2,720 | 4.3% | $247,500 | $91,000 |
| 47 | Holiday City South | 4,294 | 3.7% | $244,300 | $55,298 |
| 48 | Concordia | 2,724 | 11.5% | $298,500 | $57,063 |
| 49 | Erma | 2,039 | 12.8% | $378,000 | $93,674 |
| 50 | Golden Triangle | 4,893 | 3.5% | $280,800 | $101,411 |
| 51 | Manahawkin | 2,359 | 3.2% | $399,500 | $79,417 |
| 52 | Leisure Village West | 4,070 | 5.7% | $203,700 | $60,309 |
| 53 | Wood | 3,690 | 5.5% | $231,700 | $101,855 |
| 54 | Leisure Knoll | 2,725 | 2.9% | $265,600 | $61,875 |
| 55 | Sussex | 2,004 | 1.3% | $258,400 | $72,601 |
| 56 | Neptune City | 4,607 | 4.8% | $383,600 | $82,872 |
| 57 | Roebling | 3,591 | 4.2% | $185,500 | $83,083 |
| 58 | Alpha | 2,249 | 2.7% | $250,400 | $83,125 |
| 59 | Milford | 1,306 | 7.1% | $304,100 | $88,295 |
| 60 | Rossmoor | 3,136 | 9.2% | $184,800 | $54,367 |
| 61 | Collings Lakes | 1,489 | 5.4% | $194,500 | $86,359 |
| 62 | Vernon Center | 1,490 | 1.4% | $160,300 | $74,853 |
| 63 | Gibbstown | 3,494 | 2.6% | $228,800 | $90,371 |
| 64 | Merchantville | 3,815 | 3.3% | $316,300 | $91,607 |
| 65 | Englis | 2,075 | 7.7% | $479,000 | $101,736 |
| 66 | Highlands | 4,575 | 9.6% | $394,800 | $90,082 |
| 67 | Ogdensburg | 2,231 | 8.7% | $311,900 | $104,946 |
| 68 | Upper Pohatcong | 1,851 | 2.6% | $238,400 | $101,338 |
| 69 | Belvidere | 2,526 | 6.1% | $269,200 | $100,334 |
| 70 | Olivet | 1,647 | 8.0% | $299,000 | $122,193 |
| 71 | Lake Telemark | 1,519 | 8.9% | $424,200 | $107,065 |
| 72 | Oak Valley | 4,374 | 3.5% | $226,000 | $90,563 |
| 73 | Barnegat | 3,367 | 7.3% | $398,900 | $105,091 |
| 74 | Mount Ephraim | 4,648 | 6.2% | $223,800 | $95,137 |
| 75 | North Cape May | 3,577 | 5.9% | $323,900 | $82,198 |
| 76 | Cedar Glen West | 1,654 | 2.1% | $67,400 | $66,313 |
| 77 | Glen Gardner | 1,702 | 5.4% | $280,000 | $98,750 |
| 78 | Moonachie | 3,106 | 4.1% | $450,800 | $108,359 |
| 79 | Beattystown | 4,479 | 3.8% | $367,800 | $105,179 |
| 80 | Kenvil | 1,719 | 1.9% | $338,800 | $81,250 |
| 81 | Magnolia | 4,360 | 6.1% | $221,100 | $89,489 |
| 82 | High Bridge | 3,584 | 5.8% | $298,600 | $116,424 |
| 83 | Princeton Junction | 1,842 | 7.8% | $669,100 | $219,375 |
| 84 | Point Pleasant Beach | 4,826 | 6.9% | $813,500 | $131,641 |
| 85 | Bordentown | 4,006 | 5.3% | $322,300 | $91,208 |
| 86 | Wildwood Crest | 3,094 | 10.6% | $526,600 | $82,143 |
| 87 | Ocean Grove | 2,916 | 5.5% | $764,200 | $74,410 |
| 88 | Helmetta | 2,317 | 6.8% | $321,400 | $104,143 |
| 89 | Farmingdale | 1,399 | 13.1% | $401,000 | $97,574 |
| 90 | Belford | 2,039 | 9.9% | $491,100 | $121,406 |
| 91 | Cliffwood Beach | 3,044 | 5.4% | $340,600 | $108,854 |
| 92 | Lake Como | 1,660 | 6.2% | $614,500 | $83,056 |
| 93 | Oaklyn | 3,934 | 2.6% | $245,000 | $81,514 |
| 94 | Silver Lake Cdp (Essex County) | 4,034 | 2.8% | $483,700 | $86,615 |
| 95 | Netcong | 3,543 | 2.0% | $344,300 | $92,596 |
| 96 | Frenc | 1,609 | 5.5% | $368,700 | $107,969 |
| 97 | Sewaren | 3,196 | 6.3% | $414,900 | $106,926 |
| 98 | Pemberton Heights | 2,643 | 0.0% | $232,800 | $70,403 |
| 99 | Mullica Hill | 4,561 | 5.3% | $427,500 | $133,750 |
| 100 | North Beach Haven | 2,282 | 11.6% | $1,070,900 | $109,353 |