100 Biggest Cities In New York For 2023
Using the latest Census data, we detail the 100 biggest cities in New York. You can all see a comprehensive list of all 798 cities and places in New York.

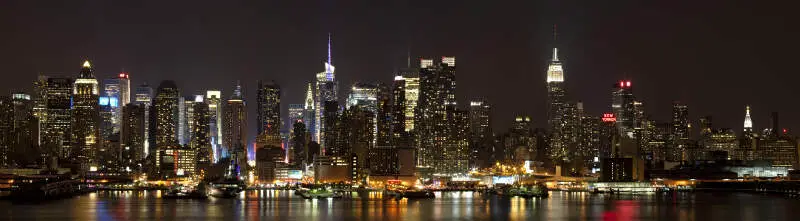
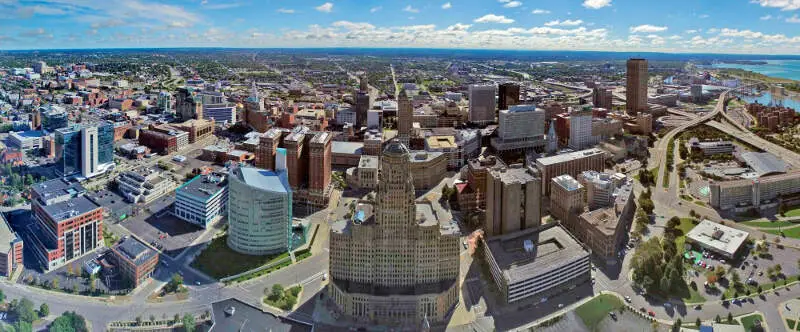
We all love the biggest cities that the Empire State has to offer. You know the places like New York and Buffalo which make all the headlines.
But there are a bunch of other great large cities in New York that don't get as much love.
We're going to change that right now.
Using the most recent Census data, we can tell you about all the places in New York with a focus on the biggest. We update the data each year and this is our fourth time doing this.
Table Of Contents: Top Ten | Methodology | Table
The Largest Cities In New York For 2023:
You can click here to see a full table of the full of the 100 biggest cities in New York, along with every other place over 1,000 people big. It is sortable by clicking on the headers.
Read on below to see more on the biggest cities. Or for more reading on places to live in New York, check out:
- Best Places To Live In New York
- Cheapest Places To Live In New York
- Most Dangerous Places In New York
The 10 Biggest Cities In New York
/10
Rank Last Year: 1 (No Change)
Population: 8,736,047
Population 2010: 8,078,471
Growth: 8.1%
More on New York: Data | Crime | Cost Of Living | Real Estate
/10
Rank Last Year: 2 (No Change)
Population: 276,011
Population 2010: 266,012
Growth: 3.8%
More on Buffalo: Data | Crime | Cost Of Living | Real Estate
/10
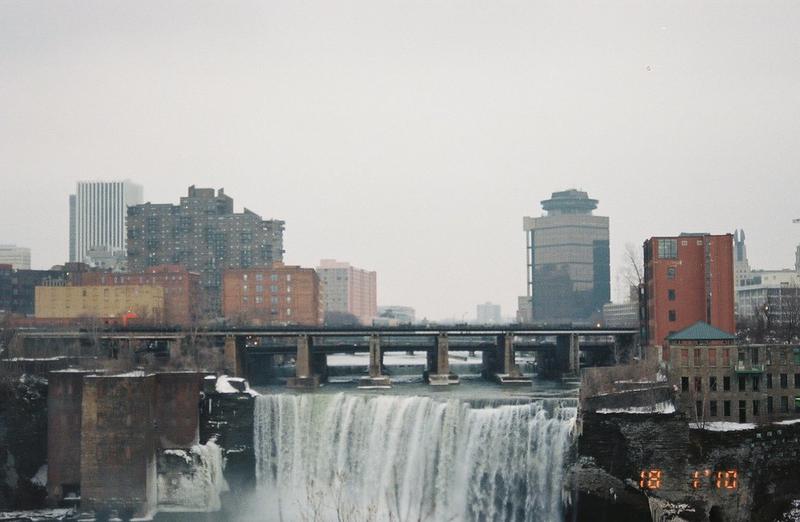
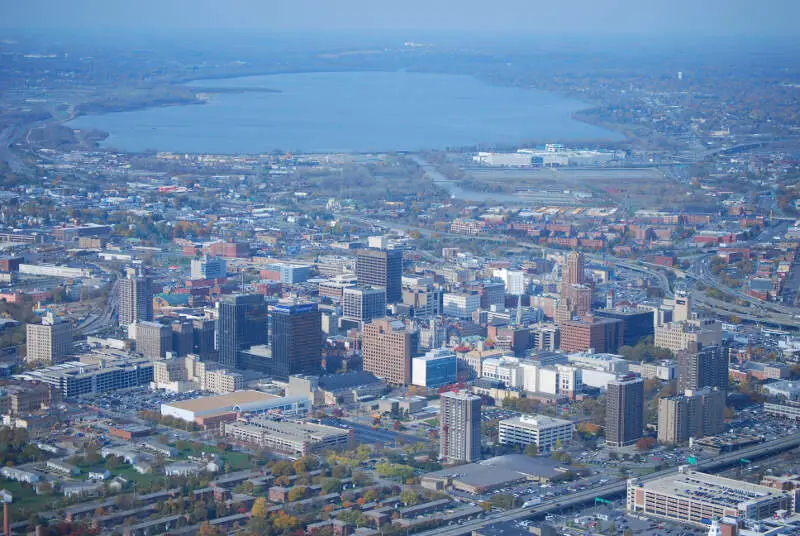
Rank Last Year: 3 (No Change)
Population: 211,100
Population 2010: 211,977
Growth: -0.4%
More on Rochester: Data | Crime | Cost Of Living | Real Estate
/10
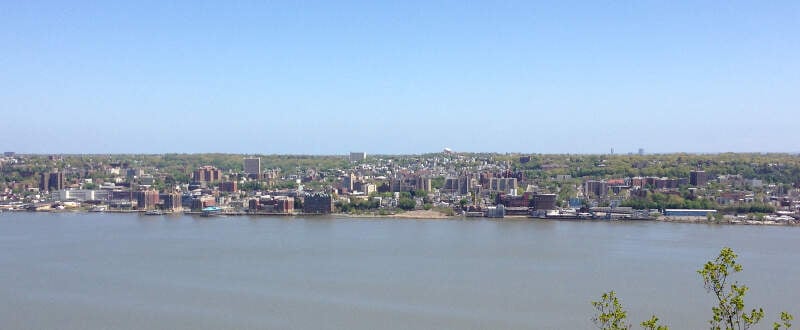
Rank Last Year: 4 (No Change)
Population: 209,730
Population 2010: 194,880
Growth: 7.6%
More on Yonkers: Data | Crime | Cost Of Living | Real Estate
/10
Rank Last Year: 5 (No Change)
Population: 146,781
Population 2010: 144,734
Growth: 1.4%
More on Syracuse: Data | Crime | Cost Of Living | Real Estate
/10
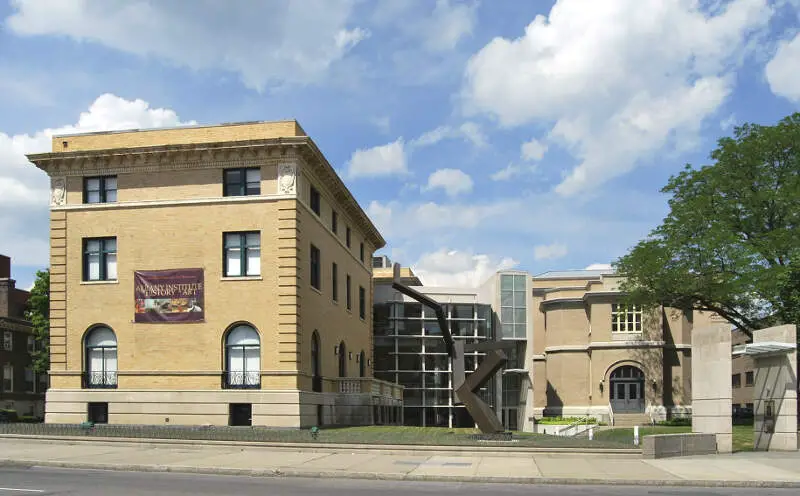
Rank Last Year: 6 (No Change)
Population: 99,402
Population 2010: 97,951
Growth: 1.5%
More on Albany: Data | Crime | Cost Of Living | Real Estate
/10
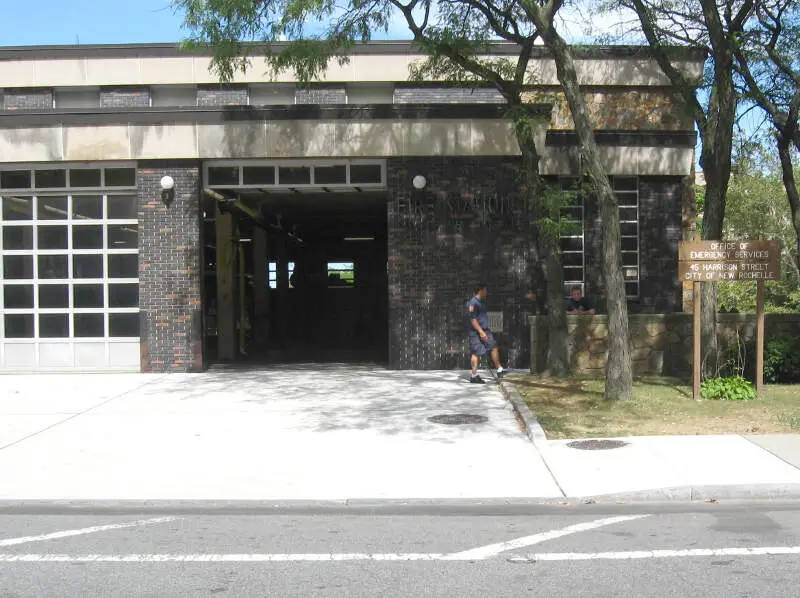
Rank Last Year: 7 (No Change)
Population: 80,685
Population 2010: 75,823
Growth: 6.4%
More on New Rochelle: Data | Crime | Cost Of Living | Real Estate
/10
Rank Last Year: 8 (No Change)
Population: 76,497
Population 2010: 75,755
Growth: 1.0%
More on Cheektowaga: Data | Crime | Cost Of Living | Real Estate
/10
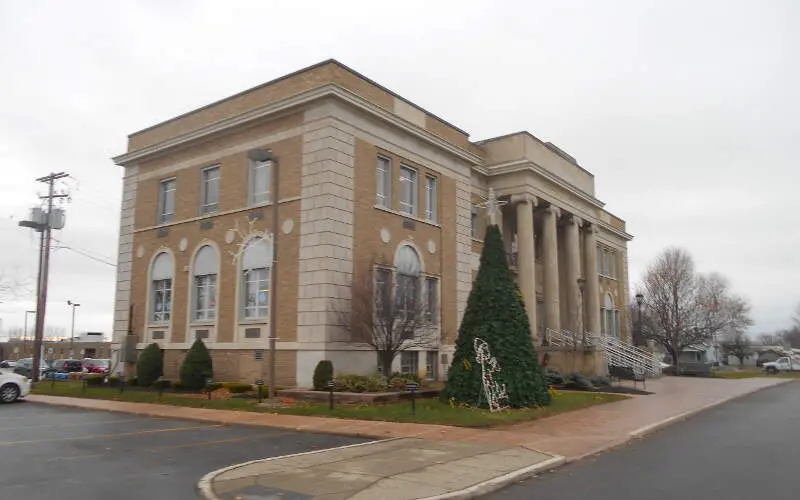
Rank Last Year: 9 (No Change)
Population: 72,855
Population 2010: 67,073
Growth: 8.6%
More on Mount Vernon: Data | Crime | Cost Of Living | Real Estate
/10
Rank Last Year: 10 (No Change)
Population: 66,809
Population 2010: 65,366
Growth: 2.2%
More on Schenectady: Data | Crime | Cost Of Living | Real Estate
How We Determined The Largest Cities In New York
We've been ranking and dissecting cities in the Empire State for over 4 years now -- making this actually the fourth time we've run the numbers. We always use the best data, the US Census. In this case, that means we are using the American Community Survey.
It what is probably the most simple analysis we run each year, we ranked every place in New York from biggest to smallest. The biggest city this year? That would be New York.
The smallest? Mayfield, although there are places smaller than 1,000 people not listed here, so keep that in mind as we take a look at the top ten.
Now on to numbers 11-100 Biggest in New York
We hope that you find the big city, or really any city, that's right for you. Below is a list of the rest of the biggest cities along with every other place in New York.
Have fun snacking around in the Empire State!
For more reading on New York, check out:
- Best Places To Raise A Family In New York
- Best Places To Retire In New York
- Richest Cities In New York
- Safest Places In New York According To Science
- Worst Places To Live In New York State
- Most Expensive Places To Live In New York
Detailed List Of The Biggest Cities In New York
| Rank | City | Current Population | 2010 | Growth | |||||
|---|---|---|---|---|---|---|---|---|---|
| 1 | New York | 8,736,047 | 8,078,471 | 8.1% | |||||
| 2 | Buffalo | 276,011 | 266,012 | 3.8% | |||||
| 3 | Rochester | 211,100 | 211,977 | -0.4% | |||||
| 4 | Yonkers | 209,730 | 194,880 | 7.6% | |||||
| 5 | Syracuse | 146,781 | 144,734 | 1.4% | |||||
| 6 | Albany | 99,402 | 97,951 | 1.5% | |||||
| 7 | New Rochelle | 80,685 | 75,823 | 6.4% | |||||
| 8 | Cheektowaga | 76,497 | 75,755 | 1.0% | |||||
| 9 | Mount Vernon | 72,855 | 67,073 | 8.6% | |||||
| 10 | Schenectady | 66,809 | 65,366 | 2.2% | |||||
| 11 | Brentwood | 66,035 | 54,818 | 20.5% | |||||
| 12 | Utica | 64,723 | 61,835 | 4.7% | |||||
| 13 | White Plains | 59,452 | 55,881 | 6.4% | |||||
| 14 | Hempstead | 58,532 | 53,365 | 9.7% | |||||
| 15 | Levittown | 52,540 | 53,479 | -1.8% | |||||
| 16 | Irondequoit | 51,054 | 51,610 | -1.1% | |||||
| 17 | Troy | 50,717 | 50,011 | 1.4% | |||||
| 18 | Niagara Falls | 48,763 | 50,891 | -4.2% | |||||
| 19 | Binghamton | 47,828 | 47,391 | 0.9% | |||||
| 20 | West Seneca | 45,390 | 44,719 | 1.5% | |||||
| 21 | Freeport | 44,328 | 42,702 | 3.8% | |||||
| 22 | West Babylon | 43,397 | 44,552 | -2.6% | |||||
| 23 | Hicksville | 43,107 | 41,787 | 3.2% | |||||
| 24 | Coram | 41,431 | 38,619 | 7.3% | |||||
| 25 | Valley Stream | 40,304 | 36,981 | 9.0% | |||||
| 26 | East Meadow | 38,078 | 37,477 | 1.6% | |||||
| 27 | Brighton | 36,986 | 36,384 | 1.7% | |||||
| 28 | Elmont | 36,741 | 34,486 | 6.5% | |||||
| 29 | Central Islip | 36,292 | 35,912 | 1.1% | |||||
| 30 | Commack | 36,252 | 36,153 | 0.3% | |||||
| 31 | Long Beach | 34,820 | 33,442 | 4.1% | |||||
| 32 | New City | 34,118 | 33,402 | 2.1% | |||||
| 33 | Huntington Station | 34,050 | 31,668 | 7.5% | |||||
| 34 | Baldwin | 33,352 | 23,711 | 40.7% | |||||
| 35 | Spring Valley | 32,953 | 30,326 | 8.7% | |||||
| 36 | Uniondale | 32,791 | 24,496 | 33.9% | |||||
| 37 | Kiryas Joel | 32,498 | 19,089 | 70.2% | |||||
| 38 | Franklin Square | 32,381 | 29,678 | 9.1% | |||||
| 39 | Rome | 32,309 | 33,900 | -4.7% | |||||
| 40 | Centereach | 31,979 | 31,684 | 0.9% | |||||
| 41 | Ithaca | 31,819 | 29,774 | 6.9% | |||||
| 42 | Bay Shore | 31,488 | 27,916 | 12.8% | |||||
| 43 | Poughkeepsie | 31,475 | 32,441 | -3.0% | |||||
| 44 | Port Chester | 31,317 | 28,610 | 9.5% | |||||
| 45 | Oceanside | 31,182 | 31,078 | 0.3% | |||||
| 46 | North Tonawanda | 30,592 | 31,716 | -3.5% | |||||
| 47 | Middletown | 30,086 | 27,806 | 8.2% | |||||
| 48 | Newburgh | 28,834 | 29,001 | -0.6% | |||||
| 49 | Jamestown | 28,818 | 31,186 | -7.6% | |||||
| 50 | Harrison | 28,635 | 26,780 | 6.9% | |||||
| 51 | Glen Cove | 28,187 | 26,728 | 5.5% | |||||
| 52 | Saratoga Springs | 28,110 | 26,683 | 5.3% | |||||
| 53 | Shirley | 28,059 | 28,070 | 0.0% | |||||
| 54 | West Islip | 27,557 | 28,692 | -4.0% | |||||
| 55 | Ossining | 27,368 | 24,812 | 10.3% | |||||
| 56 | Monsey | 27,359 | 15,050 | 81.8% | |||||
| 57 | Lindenhurst | 27,169 | 27,386 | -0.8% | |||||
| 58 | Holbrook | 26,958 | 26,981 | -0.1% | |||||
| 59 | Auburn | 26,913 | 27,863 | -3.4% | |||||
| 60 | Deer Park | 26,803 | 28,292 | -5.3% | |||||
| 61 | Elmira | 26,737 | 29,354 | -8.9% | |||||
| 62 | Plainview | 26,665 | 25,786 | 3.4% | |||||
| 63 | Smithtown | 26,257 | 26,199 | 0.2% | |||||
| 64 | Rockville Centre | 25,768 | 23,941 | 7.6% | |||||
| 65 | Peekskill | 25,304 | 23,220 | 9.0% | |||||
| 66 | Watertown | 25,172 | 26,753 | -5.9% | |||||
| 67 | Dix Hills | 24,739 | 26,548 | -6.8% | |||||
| 68 | Medford | 24,702 | 24,638 | 0.3% | |||||
| 69 | Kingston | 23,972 | 23,975 | 0.0% | |||||
| 70 | Copiague | 23,552 | 20,620 | 14.2% | |||||
| 71 | Garden City | 23,087 | 22,120 | 4.4% | |||||
| 72 | Rotterdam | 22,584 | 20,520 | 10.1% | |||||
| 73 | Massapequa | 22,249 | 22,759 | -2.2% | |||||
| 74 | East Patchogue | 21,830 | 21,081 | 3.6% | |||||
| 75 | North Bellmore | 21,535 | 19,575 | 10.0% | |||||
| 76 | Selden | 21,265 | 19,592 | 8.5% | |||||
| 77 | Merrick | 20,990 | 21,326 | -1.6% | |||||
| 78 | Lockport | 20,876 | 21,295 | -2.0% | |||||
| 79 | Mineola | 20,837 | 18,691 | 11.5% | |||||
| 80 | West Hempstead | 20,729 | 18,435 | 12.4% | |||||
| 81 | Eastchester | 20,636 | 19,303 | 6.9% | |||||
| 82 | Niskayuna | 20,369 | 4,633 | 339.7% | |||||
| 83 | Lynbrook | 20,325 | 19,380 | 4.9% | |||||
| 84 | East Northport | 20,281 | 20,957 | -3.2% | |||||
| 85 | Mamaroneck | 19,989 | 18,728 | 6.7% | |||||
| 86 | Plattsburgh | 19,969 | 19,974 | 0.0% | |||||
| 87 | Hauppauge | 19,967 | 20,922 | -4.6% | |||||
| 88 | North Amityville | 19,817 | 17,814 | 11.2% | |||||
| 89 | Lackawanna | 19,697 | 18,239 | 8.0% | |||||
| 90 | Nanuet | 19,624 | 17,805 | 10.2% | |||||
| 91 | Holtsville | 19,497 | 19,277 | 1.1% | |||||
| 92 | Huntington | 19,397 | 18,720 | 3.6% | |||||
| 93 | Syosset | 19,347 | 18,905 | 2.3% | |||||
| 94 | East Massapequa | 19,013 | 17,833 | 6.6% | |||||
| 95 | North Babylon | 18,776 | 17,732 | 5.9% | |||||
| 96 | Ronkonkoma | 18,775 | 19,779 | -5.1% | |||||
| 97 | North Massapequa | 18,577 | 18,665 | -0.5% | |||||
| 98 | Melville | 18,561 | 19,050 | -2.6% | |||||
| 99 | North Bay Shore | 18,524 | 19,515 | -5.1% | |||||
| 100 | North Valley Stream | 18,345 | 16,505 | 11.1% | |||||
| 101 | Wantagh | 18,331 | 17,981 | 1.9% | |||||
| 102 | Amsterdam | 18,218 | 18,512 | -1.6% | |||||
| 103 | Lake Ronkonkoma | 18,214 | 21,506 | -15.3% | |||||
| 104 | Scarsdale | 18,063 | 17,109 | 5.6% | |||||
| 105 | Roosevelt | 18,019 | 15,046 | 19.8% | |||||
| 106 | Cohoes | 17,931 | 16,116 | 11.3% | |||||
| 107 | Bethpage | 17,627 | 16,627 | 6.0% | |||||
| 108 | Cortland | 17,577 | 19,257 | -8.7% | |||||
| 109 | Islip | 17,441 | 18,970 | -8.1% | |||||
| 110 | Woodmere | 17,267 | 17,455 | -1.1% | |||||
| 111 | Massapequa Park | 17,149 | 16,965 | 1.1% | |||||
| 112 | Oswego | 17,105 | 18,121 | -5.6% | |||||
| 113 | Farmingville | 16,909 | 16,016 | 5.6% | |||||
| 114 | Port Washington | 16,807 | 16,136 | 4.2% | |||||
| 115 | Bellmore | 16,603 | 16,189 | 2.6% | |||||
| 116 | Hampton Bays | 16,546 | 13,606 | 21.6% | |||||
| 117 | Rye | 16,459 | 15,497 | 6.2% | |||||
| 118 | Pearl River | 16,387 | 14,578 | 12.4% | |||||
| 119 | Sayville | 16,290 | 16,107 | 1.1% | |||||
| 120 | Floral Park | 16,180 | 16,013 | 1.0% | |||||
| 121 | Kings Park | 16,008 | 16,981 | -5.7% | |||||
| 122 | Fort Drum | 15,895 | 12,224 | 30.0% | |||||
| 123 | New Cassel | 15,841 | 12,564 | 26.1% | |||||
| 124 | Westbury | 15,772 | 14,910 | 5.8% | |||||
| 125 | Seaford | 15,636 | 15,463 | 1.1% | |||||
| 126 | Mastic | 15,576 | 14,485 | 7.5% | |||||
| 127 | Batavia | 15,497 | 15,586 | -0.6% | |||||
| 128 | Johnson City | 15,275 | 15,246 | 0.2% | |||||
| 129 | Gloversville | 15,211 | 15,620 | -2.6% | |||||
| 130 | Kenmore | 15,207 | 15,545 | -2.2% | |||||
| 131 | Depew | 15,188 | 15,454 | -1.7% | |||||
| 132 | Tonawanda | 15,132 | 15,249 | -0.8% | |||||
| 133 | North New Hyde Park | 15,125 | 14,750 | 2.5% | |||||
| 134 | Greenlawn | 15,115 | 12,885 | 17.3% | |||||
| 135 | South Farmingdale | 15,009 | 14,764 | 1.7% | |||||
| 136 | Glens Falls | 14,784 | 14,747 | 0.3% | |||||
| 137 | Greece | 14,628 | 14,181 | 3.2% | |||||
| 138 | Eggertsville | 14,577 | 15,096 | -3.4% | |||||
| 139 | Jericho | 14,526 | 13,011 | 11.6% | |||||
| 140 | Riverhead | 14,315 | 12,700 | 12.7% | |||||
| 141 | Jefferson Valley-Yorktown | 14,168 | 14,471 | -2.1% | |||||
| 142 | St. James | 13,945 | 12,774 | 9.2% | |||||
| 143 | Olean | 13,941 | 14,578 | -4.4% | |||||
| 144 | Beacon | 13,713 | 15,494 | -11.5% | |||||
| 145 | Wyandanch | 13,598 | 10,931 | 24.4% | |||||
| 146 | Endicott | 13,588 | 13,320 | 2.0% | |||||
| 147 | Rocky Point | 13,406 | 13,565 | -1.2% | |||||
| 148 | Nesconset | 13,313 | 13,607 | -2.2% | |||||
| 149 | Ridge | 12,931 | 13,172 | -1.8% | |||||
| 150 | Oneonta | 12,764 | 14,006 | -8.9% | |||||
| 151 | Dunkirk | 12,651 | 12,610 | 0.3% | |||||
| 152 | Salisbury | 12,643 | 11,771 | 7.4% | |||||
| 153 | East Islip | 12,596 | 13,938 | -9.6% | |||||
| 154 | Geneva | 12,577 | 13,326 | -5.6% | |||||
| 155 | North Merrick | 12,392 | 12,385 | 0.1% | |||||
| 156 | Stony Point | 12,389 | 11,906 | 4.1% | |||||
| 157 | Patchogue | 12,341 | 11,836 | 4.3% | |||||
| 158 | Haverstraw | 12,292 | 11,522 | 6.7% | |||||
| 159 | Miller Place | 12,243 | 12,293 | -0.4% | |||||
| 160 | Babylon | 12,181 | 12,264 | -0.7% | |||||
| 161 | Manorville | 12,106 | 13,514 | -10.4% | |||||
| 162 | Stony Brook | 12,048 | 13,658 | -11.8% | |||||
| 163 | Tarr | 11,808 | 11,200 | 5.4% | |||||
| 164 | North Wantagh | 11,807 | 11,704 | 0.9% | |||||
| 165 | Endwell | 11,795 | 11,691 | 0.9% | |||||
| 166 | Elwood | 11,722 | 11,136 | 5.3% | |||||
| 167 | East Glenville | 11,687 | 6,627 | 76.4% | |||||
| 168 | Dobbs Ferry | 11,511 | 10,782 | 6.8% | |||||
| 169 | Fulton | 11,461 | 11,902 | -3.7% | |||||
| 170 | Suffern | 11,376 | 10,704 | 6.3% | |||||
| 171 | Woodbury | 11,206 | 10,458 | 7.2% | |||||
| 172 | North Lindenhurst | 11,144 | 11,627 | -4.2% | |||||
| 173 | Middle Island | 11,129 | 10,230 | 8.8% | |||||
| 174 | Lake Grove | 11,110 | 11,018 | 0.8% | |||||
| 175 | Great Neck | 11,034 | 9,842 | 12.1% | |||||
| 176 | Terryville | 10,999 | 11,941 | -7.9% | |||||
| 177 | Mount Kisco | 10,904 | 10,653 | 2.4% | |||||
| 178 | Mount Sinai | 10,904 | 11,624 | -6.2% | |||||
| 179 | Corning | 10,708 | 11,097 | -3.5% | |||||
| 180 | West Haverstraw | 10,665 | 10,079 | 5.8% | |||||
| 181 | Scotchtown | 10,644 | 9,732 | 9.4% | |||||
| 182 | Canandaigua | 10,563 | 10,678 | -1.1% | |||||
| 183 | Inwood | 10,533 | 10,455 | 0.7% | |||||
| 184 | Oneida | 10,493 | 11,339 | -7.5% | |||||
| 185 | North Bellport | 10,484 | 11,265 | -6.9% | |||||
| 186 | Myers Corner | 10,427 | 6,371 | 63.7% | |||||
| 187 | Massena | 10,377 | 11,269 | -7.9% | |||||
| 188 | Watervliet | 10,363 | 10,313 | 0.5% | |||||
| 189 | South Huntington | 10,349 | 9,886 | 4.7% | |||||
| 190 | Fairmount | 10,292 | 10,056 | 2.3% | |||||
| 191 | New Hyde Park | 10,262 | 9,621 | 6.7% | |||||
| 192 | Chestnut Ridge | 10,211 | 7,851 | 30.1% | |||||
| 193 | Sleepy Hollow | 10,176 | 9,701 | 4.9% | |||||
| 194 | Orange Lake | 10,159 | 6,820 | 49.0% | |||||
| 195 | Ogdensburg | 10,153 | 11,367 | -10.7% | |||||
| 196 | East Rockaway | 10,108 | 9,836 | 2.8% | |||||
| 197 | Lancaster | 10,046 | 10,449 | -3.9% | |||||
| 198 | Fredonia | 10,018 | 11,124 | -9.9% | |||||
| 199 | Airmont | 9,964 | 8,426 | 18.3% | |||||
| 200 | Rye Brook | 9,909 | 9,151 | 8.3% | |||||
| 201 | Hamburg | 9,722 | 9,513 | 2.2% | |||||
| 202 | Fort Salonga | 9,708 | 10,494 | -7.5% | |||||
| 203 | Amityville | 9,542 | 9,537 | 0.1% | |||||
| 204 | Bohemia | 9,504 | 9,898 | -4.0% | |||||
| 205 | North Gates | 9,494 | 9,329 | 1.8% | |||||
| 206 | New Square | 9,433 | 6,458 | 46.1% | |||||
| 207 | Plainedge | 9,428 | 9,246 | 2.0% | |||||
| 208 | Monroe | 9,392 | 8,320 | 12.9% | |||||
| 209 | West Glens Falls | 9,379 | 6,629 | 41.5% | |||||
| 210 | Rensselaer | 9,330 | 9,162 | 1.8% | |||||
| 211 | Springs | 9,301 | 6,764 | 37.5% | |||||
| 212 | Glens Falls North | 9,160 | 8,753 | 4.6% | |||||
| 213 | Newark | 9,049 | 9,185 | -1.5% | |||||
| 214 | Stony Brook University | 8,868 | 8,362 | 6.1% | |||||
| 215 | Bayport | 8,813 | 8,917 | -1.2% | |||||
| 216 | Port Jervis | 8,772 | 8,906 | -1.5% | |||||
| 217 | Valley Cottage | 8,749 | 9,448 | -7.4% | |||||
| 218 | New Windsor | 8,693 | 9,085 | -4.3% | |||||
| 219 | Hillcrest | 8,667 | 8,198 | 5.7% | |||||
| 220 | Malverne | 8,583 | 8,520 | 0.7% | |||||
| 221 | Mahopac | 8,573 | 7,602 | 12.8% | |||||
| 222 | Hastings-On-Hudson | 8,505 | 7,782 | 9.3% | |||||
| 223 | South Lockport | 8,480 | 8,398 | 1.0% | |||||
| 224 | Farmingdale | 8,468 | 8,169 | 3.7% | |||||
| 225 | Potsdam | 8,455 | 9,476 | -10.8% | |||||
| 226 | Wading River | 8,304 | 8,157 | 1.8% | |||||
| 227 | Croton-On-Hudson | 8,289 | 7,896 | 5.0% | |||||
| 228 | Hornell | 8,284 | 8,646 | -4.2% | |||||
| 229 | Johnstown | 8,247 | 8,738 | -5.6% | |||||
| 230 | Geneseo | 8,140 | 7,926 | 2.7% | |||||
| 231 | North Patchogue | 8,138 | 7,210 | 12.9% | |||||
| 232 | Manhasset | 8,093 | 8,207 | -1.4% | |||||
| 233 | Port Jefferson | 7,951 | 7,827 | 1.6% | |||||
| 234 | Center Moriches | 7,948 | 8,132 | -2.3% | |||||
| 235 | Congers | 7,926 | 7,904 | 0.3% | |||||
| 236 | Lake Carmel | 7,854 | 7,922 | -0.9% | |||||
| 237 | Ilion | 7,826 | 8,117 | -3.6% | |||||
| 238 | Garden City Park | 7,807 | 7,811 | -0.1% | |||||
| 239 | Colonie | 7,792 | 7,839 | -0.6% | |||||
| 240 | Mount Ivy | 7,792 | 6,570 | 18.6% | |||||
| 241 | Mechanicstown | 7,777 | 7,457 | 4.3% | |||||
| 242 | Baldwinsville | 7,739 | 7,307 | 5.9% | |||||
| 243 | Westmere | 7,730 | 7,333 | 5.4% | |||||
| 244 | Port Jefferson Station | 7,716 | 7,521 | 2.6% | |||||
| 245 | Briarcliff Manor | 7,587 | 8,022 | -5.4% | |||||
| 246 | Williston Park | 7,571 | 7,239 | 4.6% | |||||
| 247 | Pleasantville | 7,469 | 7,015 | 6.5% | |||||
| 248 | Great Neck Plaza | 7,429 | 6,613 | 12.3% | |||||
| 249 | Hudson Falls | 7,413 | 7,237 | 2.4% | |||||
| 250 | New Paltz | 7,378 | 6,749 | 9.3% | |||||
| 251 | Northport | 7,360 | 7,445 | -1.1% | |||||
| 252 | Scotia | 7,305 | 7,698 | -5.1% | |||||
| 253 | Nyack | 7,303 | 6,964 | 4.9% | |||||
| 254 | Cedarhurst | 7,290 | 6,466 | 12.7% | |||||
| 255 | Sound Beach | 7,289 | 7,579 | -3.8% | |||||
| 256 | Oakdale | 7,276 | 7,677 | -5.2% | |||||
| 257 | Hewlett | 7,256 | 6,735 | 7.7% | |||||
| 258 | Pelham | 7,255 | 6,776 | 7.1% | |||||
| 259 | Brockport | 7,246 | 8,407 | -13.8% | |||||
| 260 | Herkimer | 7,239 | 7,985 | -9.3% | |||||
| 261 | East Shoreham | 7,232 | 6,388 | 13.2% | |||||
| 262 | East Hills | 7,231 | 6,853 | 5.5% | |||||
| 263 | Monticello | 7,199 | 6,753 | 6.6% | |||||
| 264 | Baywood | 7,179 | 7,865 | -8.7% | |||||
| 265 | Tappan | 7,153 | 6,179 | 15.8% | |||||
| 266 | Viola | 7,068 | 7,050 | 0.3% | |||||
| 267 | South Hill | 7,045 | 6,555 | 7.5% | |||||
| 268 | Tuckahoe | 7,002 | 6,408 | 9.3% | |||||
| 269 | Canton | 6,994 | 6,277 | 11.4% | |||||
| 270 | Norwich | 6,982 | 7,303 | -4.4% | |||||
| 271 | Manorhaven | 6,923 | 6,433 | 7.6% | |||||
| 272 | Walden | 6,841 | 6,917 | -1.1% | |||||
| 273 | North Syracuse | 6,796 | 6,619 | 2.7% | |||||
| 274 | Lawrence | 6,793 | 6,445 | 5.4% | |||||
| 275 | Bayville | 6,780 | 6,701 | 1.2% | |||||
| 276 | Roslyn Heights | 6,758 | 6,482 | 4.3% | |||||
| 277 | South Valley Stream | 6,754 | 5,263 | 28.3% | |||||
| 278 | Southport | 6,746 | 7,573 | -10.9% | |||||
| 279 | Oyster Bay | 6,708 | 5,437 | 23.4% | |||||
| 280 | Seneca Falls | 6,700 | 0 | nan% | |||||
| 281 | Southold | 6,700 | 5,780 | 15.9% | |||||
| 282 | Warwick | 6,686 | 6,729 | -0.6% | |||||
| 283 | Solvay | 6,661 | 6,603 | 0.9% | |||||
| 284 | Irvington | 6,594 | 6,419 | 2.7% | |||||
| 285 | Bronxville | 6,569 | 6,329 | 3.8% | |||||
| 286 | Horseheads | 6,564 | 6,442 | 1.9% | |||||
| 287 | East Greenbush | 6,559 | 4,042 | 62.3% | |||||
| 288 | Larchmont | 6,532 | 5,860 | 11.5% | |||||
| 289 | Highland | 6,473 | 5,686 | 13.8% | |||||
| 290 | West Point | 6,386 | 9,449 | -32.4% | |||||
| 291 | Flanders | 6,380 | 4,509 | 41.5% | |||||
| 292 | East Rochester | 6,348 | 6,572 | -3.4% | |||||
| 293 | Mattydale | 6,250 | 6,523 | -4.2% | |||||
| 294 | North Sea | 6,191 | 5,183 | 19.4% | |||||
| 295 | Wesley Hills | 6,105 | 5,452 | 12.0% | |||||
| 296 | East Aurora | 6,095 | 6,291 | -3.1% | |||||
| 297 | Harris Hill | 6,078 | 5,221 | 16.4% | |||||
| 298 | Wappingers Falls | 6,074 | 5,475 | 10.9% | |||||
| 299 | Lakeview | 6,064 | 5,570 | 8.9% | |||||
| 300 | East Farmingdale | 6,055 | 6,116 | -1.0% | |||||
| 301 | Calverton | 6,040 | 6,532 | -7.5% | |||||
| 302 | University At Buffalo | 6,032 | 5,632 | 7.1% | |||||
| 303 | Centerport | 6,028 | 5,610 | 7.5% | |||||
| 304 | Hilton | 6,015 | 5,838 | 3.0% | |||||
| 305 | Hudson | 5,964 | 6,878 | -13.3% | |||||
| 306 | Medina | 5,941 | 6,132 | -3.1% | |||||
| 307 | Big Flats | 5,929 | 5,514 | 7.5% | |||||
| 308 | Salamanca | 5,918 | 5,855 | 1.1% | |||||
| 309 | Washingtonville | 5,782 | 5,947 | -2.8% | |||||
| 310 | Yaphank | 5,726 | 6,202 | -7.7% | |||||
| 311 | Webster | 5,717 | 5,366 | 6.5% | |||||
| 312 | Goshen | 5,705 | 5,551 | 2.8% | |||||
| 313 | Pelham Manor | 5,698 | 5,449 | 4.6% | |||||
| 314 | Lake Mohegan | 5,645 | 6,077 | -7.1% | |||||
| 315 | Bath | 5,613 | 5,766 | -2.7% | |||||
| 316 | Old Bethpage | 5,574 | 5,577 | -0.1% | |||||
| 317 | Islip Terrace | 5,542 | 5,742 | -3.5% | |||||
| 318 | Hampton Manor | 5,511 | 1,983 | 177.9% | |||||
| 319 | Ballston Spa | 5,510 | 5,696 | -3.3% | |||||
| 320 | Kings Point | 5,493 | 4,974 | 10.4% | |||||
| 321 | Country Knolls | 5,491 | 1,909 | 187.6% | |||||
| 322 | Fairport | 5,452 | 5,395 | 1.1% | |||||
| 323 | North Hills | 5,443 | 4,940 | 10.2% | |||||
| 324 | New Hempstead | 5,440 | 5,016 | 8.5% | |||||
| 325 | Kaser | 5,433 | 4,436 | 22.5% | |||||
| 326 | Williamsville | 5,419 | 5,320 | 1.9% | |||||
| 327 | Malone | 5,396 | 5,976 | -9.7% | |||||
| 328 | Hamlin | 5,299 | 5,421 | -2.3% | |||||
| 329 | Albion | 5,281 | 5,564 | -5.1% | |||||
| 330 | Penn Yan | 5,268 | 5,411 | -2.6% | |||||
| 331 | Firthcliffe | 5,260 | 5,363 | -1.9% | |||||
| 332 | Blauvelt | 5,255 | 5,283 | -0.5% | |||||
| 333 | West Hills | 5,235 | 5,336 | -1.9% | |||||
| 334 | Gates | 5,220 | 5,382 | -3.0% | |||||
| 335 | East Hampton North | 5,194 | 3,590 | 44.7% | |||||
| 336 | Mechanicville | 5,191 | 5,189 | 0.0% | |||||
| 337 | Carle Place | 5,177 | 5,588 | -7.4% | |||||
| 338 | Elmsford | 5,176 | 4,620 | 12.0% | |||||
| 339 | Westvale | 5,174 | 5,078 | 1.9% | |||||
| 340 | Northwest Harbor | 5,161 | 4,106 | 25.7% | |||||
| 341 | Wheatley Heights | 5,150 | 6,195 | -16.9% | |||||
| 342 | Grandyle Village | 5,133 | 4,682 | 9.6% | |||||
| 343 | East Moriches | 5,124 | 4,880 | 5.0% | |||||
| 344 | Sea Cliff | 5,084 | 4,972 | 2.3% | |||||
| 345 | East Quogue | 5,069 | 4,769 | 6.3% | |||||
| 346 | Albertson | 5,006 | 5,717 | -12.4% | |||||
| 347 | Saranac Lake | 5,003 | 5,773 | -13.3% | |||||
| 348 | Ardsley | 4,984 | 4,391 | 13.5% | |||||
| 349 | West Sayville | 4,968 | 5,217 | -4.8% | |||||
| 350 | Liberty | 4,956 | 4,372 | 13.4% | |||||
| 351 | West Elmira | 4,944 | 4,704 | 5.1% | |||||
| 352 | Chittenango | 4,927 | 5,058 | -2.6% | |||||
| 353 | Island Park | 4,901 | 4,634 | 5.8% | |||||
| 354 | Noyack | 4,864 | 3,627 | 34.1% | |||||
| 355 | Glen Head | 4,839 | 4,559 | 6.1% | |||||
| 356 | Blue Point | 4,827 | 4,742 | 1.8% | |||||
| 357 | Clarkson | 4,800 | 4,152 | 15.6% | |||||
| 358 | Flower Hill | 4,796 | 4,607 | 4.1% | |||||
| 359 | Gang Mills | 4,751 | 4,192 | 13.3% | |||||
| 360 | Wellsville | 4,741 | 4,739 | 0.0% | |||||
| 361 | Brewerton | 4,699 | 4,052 | 16.0% | |||||
| 362 | Manlius | 4,688 | 4,717 | -0.6% | |||||
| 363 | Montebello | 4,665 | 4,349 | 7.3% | |||||
| 364 | Little Falls | 4,634 | 4,975 | -6.9% | |||||
| 365 | Dansville | 4,620 | 4,709 | -1.9% | |||||
| 366 | Canastota | 4,609 | 4,750 | -3.0% | |||||
| 367 | Hawthorne | 4,609 | 4,529 | 1.8% | |||||
| 368 | Orangeburg | 4,606 | 4,342 | 6.1% | |||||
| 369 | Mattituck | 4,584 | 4,146 | 10.6% | |||||
| 370 | Waterloo | 4,579 | 5,327 | -14.0% | |||||
| 371 | Old Westbury | 4,567 | 3,941 | 15.9% | |||||
| 372 | Searingtown | 4,553 | 4,555 | 0.0% | |||||
| 373 | West Bay Shore | 4,501 | 4,409 | 2.1% | |||||
| 374 | Menands | 4,490 | 3,988 | 12.6% | |||||
| 375 | Thiells | 4,486 | 5,109 | -12.2% | |||||
| 376 | Armonk | 4,477 | 4,012 | 11.6% | |||||
| 377 | Alfred | 4,437 | 4,140 | 7.2% | |||||
| 378 | Southampton | 4,380 | 3,271 | 33.9% | |||||
| 379 | Perry | 4,377 | 3,706 | 18.1% | |||||
| 380 | Gordon Heights | 4,377 | 3,261 | 34.2% | |||||
| 381 | Thornwood | 4,375 | 3,672 | 19.1% | |||||
| 382 | Cobleskill | 4,350 | 5,202 | -16.4% | |||||
| 383 | Le Roy | 4,346 | 4,392 | -1.0% | |||||
| 384 | Galeville | 4,340 | 4,393 | -1.2% | |||||
| 385 | Waverly | 4,329 | 4,484 | -3.5% | |||||
| 386 | Fayetteville | 4,282 | 4,349 | -1.5% | |||||
| 387 | Montauk | 4,272 | 3,157 | 35.3% | |||||
| 388 | Elmira Heights | 4,265 | 4,198 | 1.6% | |||||
| 389 | Gardnertown | 4,262 | 4,763 | -10.5% | |||||
| 390 | Springville | 4,218 | 4,271 | -1.2% | |||||
| 391 | Red Oaks Mill | 4,215 | 3,547 | 18.8% | |||||
| 392 | Ellenville | 4,209 | 4,158 | 1.2% | |||||
| 393 | Lyncourt | 4,173 | 4,404 | -5.2% | |||||
| 394 | Herricks | 4,163 | 3,937 | 5.7% | |||||
| 395 | Spackenkill | 4,130 | 4,547 | -9.2% | |||||
| 396 | University Gardens | 4,125 | 3,987 | 3.5% | |||||
| 397 | Calcium | 4,092 | 3,546 | 15.4% | |||||
| 398 | Chester | 4,092 | 3,961 | 3.3% | |||||
| 399 | Garden City South | 4,090 | 3,788 | 8.0% | |||||
| 400 | Heritage Hills | 4,050 | 3,952 | 2.5% | |||||
| 401 | Cayuga Heights | 4,023 | 3,719 | 8.2% | |||||
| 402 | Dannemora | 4,016 | 4,012 | 0.1% | |||||
| 403 | Manhasset Hills | 3,928 | 3,686 | 6.6% | |||||
| 404 | Saugerties | 3,905 | 3,996 | -2.3% | |||||
| 405 | Putnam Lake | 3,893 | 3,658 | 6.4% | |||||
| 406 | Village Green | 3,883 | 4,491 | -13.5% | |||||
| 407 | West Nyack | 3,848 | 3,292 | 16.9% | |||||
| 408 | Catskill | 3,841 | 4,146 | -7.4% | |||||
| 409 | South Blooming Grove | 3,841 | 3,295 | 16.6% | |||||
| 410 | Westhampton | 3,816 | 3,440 | 10.9% | |||||
| 411 | Montgomery | 3,815 | 3,817 | -0.1% | |||||
| 412 | Lansing | 3,811 | 3,501 | 8.9% | |||||
| 413 | Glenwood Landing | 3,760 | 3,589 | 4.8% | |||||
| 414 | Suny Oswego | 3,758 | 4,456 | -15.7% | |||||
| 415 | Marlboro | 3,758 | 4,011 | -6.3% | |||||
| 416 | Hamilton | 3,754 | 3,569 | 5.2% | |||||
| 417 | Sloan | 3,754 | 3,671 | 2.3% | |||||
| 418 | Highland Falls | 3,747 | 2,222 | 68.6% | |||||
| 419 | Sidney | 3,744 | 3,551 | 5.4% | |||||
| 420 | South Glens Falls | 3,742 | 3,506 | 6.7% | |||||
| 421 | Elma Center | 3,742 | 2,735 | 36.8% | |||||
| 422 | Walton Park | 3,724 | 2,545 | 46.3% | |||||
| 423 | Bardonia | 3,709 | 4,320 | -14.1% | |||||
| 424 | Spencerport | 3,689 | 3,568 | 3.4% | |||||
| 425 | Owego | 3,686 | 3,899 | -5.5% | |||||
| 426 | Whitesboro | 3,680 | 3,793 | -3.0% | |||||
| 427 | Gouverneur | 3,667 | 3,997 | -8.3% | |||||
| 428 | Minoa | 3,653 | 3,416 | 6.9% | |||||
| 429 | Locust Valley | 3,607 | 3,091 | 16.7% | |||||
| 430 | Port Ewen | 3,603 | 3,735 | -3.5% | |||||
| 431 | Lowville | 3,592 | 3,978 | -9.7% | |||||
| 432 | Lloyd Harbor | 3,577 | 3,667 | -2.5% | |||||
| 433 | Wynantskill | 3,562 | 3,538 | 0.7% | |||||
| 434 | Islandia | 3,541 | 3,300 | 7.3% | |||||
| 435 | Hurley | 3,533 | 3,411 | 3.6% | |||||
| 436 | Mutto | 3,514 | 3,441 | 2.1% | |||||
| 437 | Haviland | 3,513 | 3,790 | -7.3% | |||||
| 438 | Balmville | 3,469 | 3,332 | 4.1% | |||||
| 439 | Montrose | 3,432 | 2,767 | 24.0% | |||||
| 440 | Ticonderoga | 3,427 | 3,631 | -5.6% | |||||
| 441 | Mount Morris | 3,427 | 3,600 | -4.8% | |||||
| 442 | Newfane | 3,419 | 3,347 | 2.2% | |||||
| 443 | North Great River | 3,414 | 3,795 | -10.0% | |||||
| 444 | Wanakah | 3,399 | 3,375 | 0.7% | |||||
| 445 | Carthage | 3,398 | 3,720 | -8.7% | |||||
| 446 | Brookhaven | 3,397 | 2,705 | 25.6% | |||||
| 447 | Riverside | 3,360 | 2,803 | 19.9% | |||||
| 448 | Avon | 3,360 | 3,359 | 0.0% | |||||
| 449 | Clarence Center | 3,337 | 2,141 | 55.9% | |||||
| 450 | Palmyra | 3,326 | 3,515 | -5.4% | |||||
| 451 | Chenango Bridge | 3,306 | 3,046 | 8.5% | |||||
| 452 | Pomona | 3,306 | 3,535 | -6.5% | |||||
| 453 | New York Mills | 3,293 | 3,375 | -2.4% | |||||
| 454 | South Hempstead | 3,284 | 3,187 | 3.0% | |||||
| 455 | Ravena | 3,273 | 3,316 | -1.3% | |||||
| 456 | Lake Erie Beach | 3,266 | 3,949 | -17.3% | |||||
| 457 | Gowanda | 3,263 | 2,856 | 14.3% | |||||
| 458 | Hoosick Falls | 3,255 | 3,503 | -7.1% | |||||
| 459 | Warrensburg | 3,215 | 3,096 | 3.8% | |||||
| 460 | Fort Edward | 3,201 | 3,344 | -4.3% | |||||
| 461 | Port Washington North | 3,192 | 3,041 | 5.0% | |||||
| 462 | Walton | 3,186 | 2,646 | 20.4% | |||||
| 463 | Homer | 3,183 | 3,282 | -3.0% | |||||
| 464 | Delhi | 3,172 | 2,756 | 15.1% | |||||
| 465 | Brightwaters | 3,169 | 3,131 | 1.2% | |||||
| 466 | Harriman | 3,168 | 2,361 | 34.2% | |||||
| 467 | Eden | 3,154 | 3,834 | -17.7% | |||||
| 468 | Northeast Ithaca | 3,146 | 2,639 | 19.2% | |||||
| 469 | Maybrook | 3,146 | 2,976 | 5.7% | |||||
| 470 | Valhalla | 3,135 | 3,083 | 1.7% | |||||
| 471 | Tupper Lake | 3,126 | 3,846 | -18.7% | |||||
| 472 | West Sand Lake | 3,104 | 2,626 | 18.2% | |||||
| 473 | Cutchogue | 3,104 | 3,521 | -11.8% | |||||
| 474 | Orchard Park | 3,100 | 3,243 | -4.4% | |||||
| 475 | East Syracuse | 3,096 | 3,092 | 0.1% | |||||
| 476 | Baiting Hollow | 3,090 | 1,764 | 75.2% | |||||
| 477 | Shrub Oak | 3,071 | 1,810 | 69.7% | |||||
| 478 | Cold Spring Harbor | 3,067 | 4,952 | -38.1% | |||||
| 479 | Chappaqua | 3,062 | 1,040 | 194.4% | |||||
| 480 | Cornwall-On-Hudson | 3,059 | 3,050 | 0.3% | |||||
| 481 | Greenwood Lake | 3,055 | 3,229 | -5.4% | |||||
| 482 | Sherrill | 3,054 | 3,077 | -0.7% | |||||
| 483 | Crown Heights | 3,050 | 2,880 | 5.9% | |||||
| 484 | Sloatsburg | 3,043 | 3,036 | 0.2% | |||||
| 485 | Lakewood | 2,988 | 3,039 | -1.7% | |||||
| 486 | Roslyn | 2,971 | 2,726 | 9.0% | |||||
| 487 | Hartsdale | 2,964 | 5,165 | -42.6% | |||||
| 488 | Green Island | 2,957 | 2,565 | 15.3% | |||||
| 489 | Warsaw | 2,947 | 4,002 | -26.4% | |||||
| 490 | Brookville | 2,937 | 3,455 | -15.0% | |||||
| 491 | Great Neck Estates | 2,935 | 2,732 | 7.4% | |||||
| 492 | Woodstock | 2,922 | 2,425 | 20.5% | |||||
| 493 | Florida | 2,921 | 2,807 | 4.1% | |||||
| 494 | Vails Gate | 2,917 | 3,125 | -6.7% | |||||
| 495 | Akron | 2,901 | 2,892 | 0.3% | |||||
| 496 | Lido Beach | 2,886 | 2,611 | 10.5% | |||||
| 497 | East Norwich | 2,871 | 2,590 | 10.8% | |||||
| 498 | Lake Success | 2,856 | 2,897 | -1.4% | |||||
| 499 | Voorheesville | 2,837 | 2,795 | 1.5% | |||||
| 500 | Munsey Park | 2,806 | 2,664 | 5.3% | |||||