
Most Americans have never been to small town California. However, as the Californian who live there know, small town California is an awesome place to call home.
But is it all roses? Definitely not. Just like any other state, California has its trouble spots. This article aims to determine, using Saturday Night Science, the absolute worst small towns to live in the Golden State. Don’t freak out, we will use data to show which places have high crime, poverty, and unemployment.
After analyzing more than 367 of California’s smallest cities, we came up with this list as the 10 worst small towns in California where you’d never want to live:
Table Of Contents: Top Ten | Methodology | Summary | Table
These are the worst small towns in California for 2025:
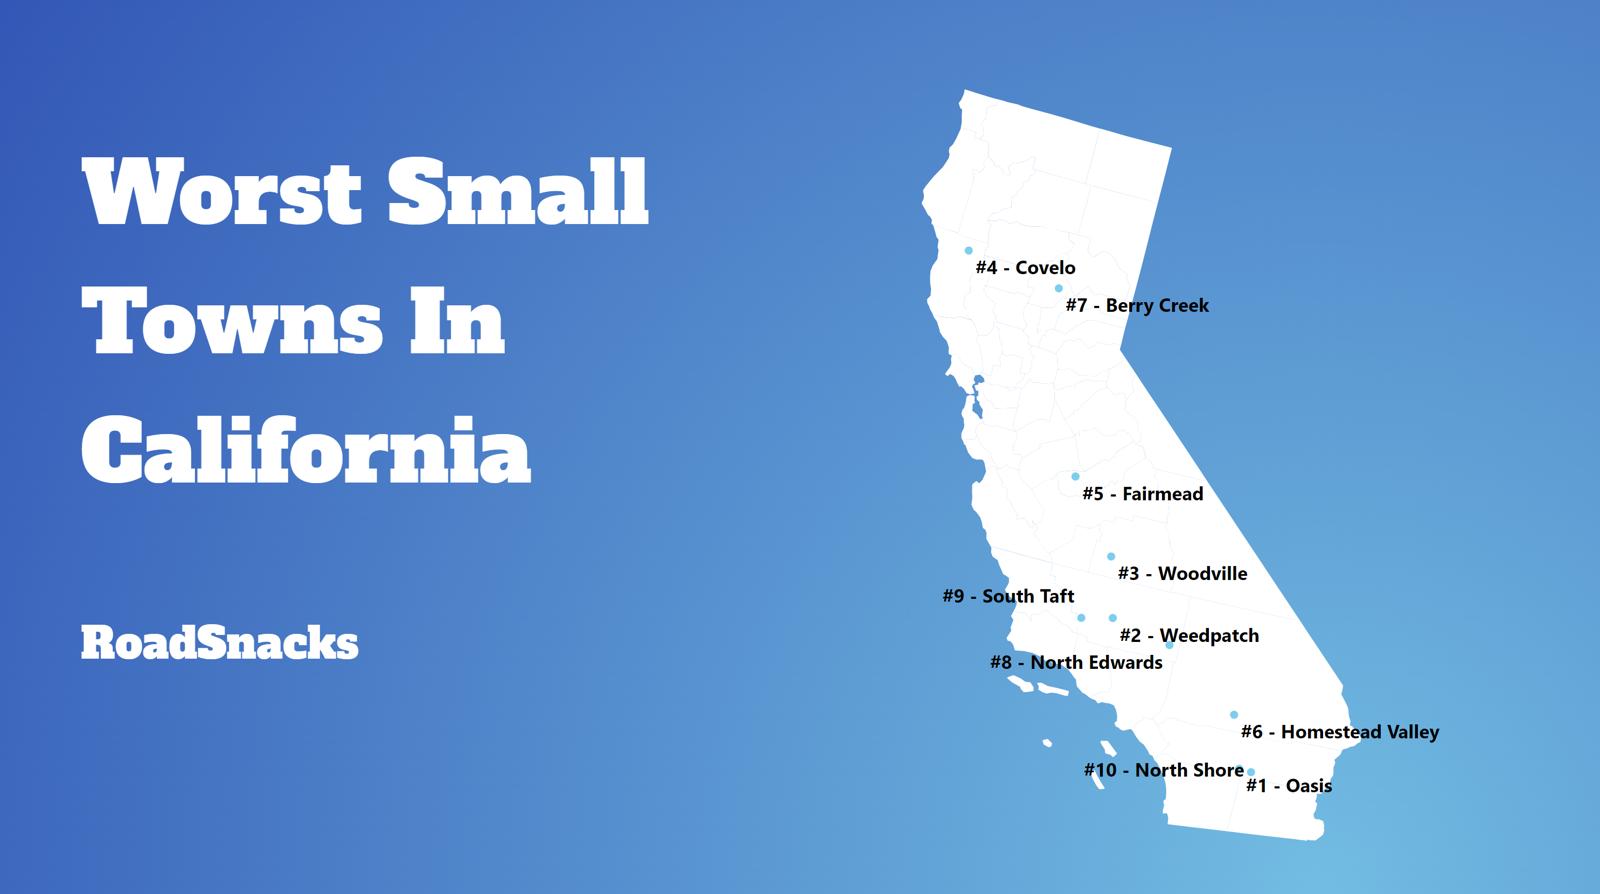
So what is the worst small town to call home in California for 2025? According to the most recent census data, Oasis is the worst small town to live in California.
While many of these small towns have seen better days, they have wonderful communities and people. This report in no way means to knock the folks that call towns like Oasis home. Everyone
Read on below to see how we crunched the numbers, or scroll to the bottom to see how your town ranked.
And if you already know about the small towns, check out the best places to live in California or the worst places to live in California.
If you’re looking for something more national, check out the worst cities in America or the worst states in America.
The 10 Worst Small Towns In California For 2025
1. Oasis
/10
Population: 4,455
Median Home Value: $35,600
Median Income: $36,553
Unemployment Rate: 16.3%
2. Weedpatch
/10
Population: 2,661
Median Home Value: $135,700
Median Income: $21,450
Unemployment Rate: 24.1%
3. Woodville
/10
Population: 1,768
Median Home Value: $194,300
Median Income: $45,089
Unemployment Rate: 16.5%
4. Big River
/10
Population: 1,025
Median Home Value: $132,400
Median Income: $40,179
Unemployment Rate: 15.0%
5. Covelo
/10
Population: 1,495
Median Home Value: $322,600
Median Income: $35,735
Unemployment Rate: 26.1%
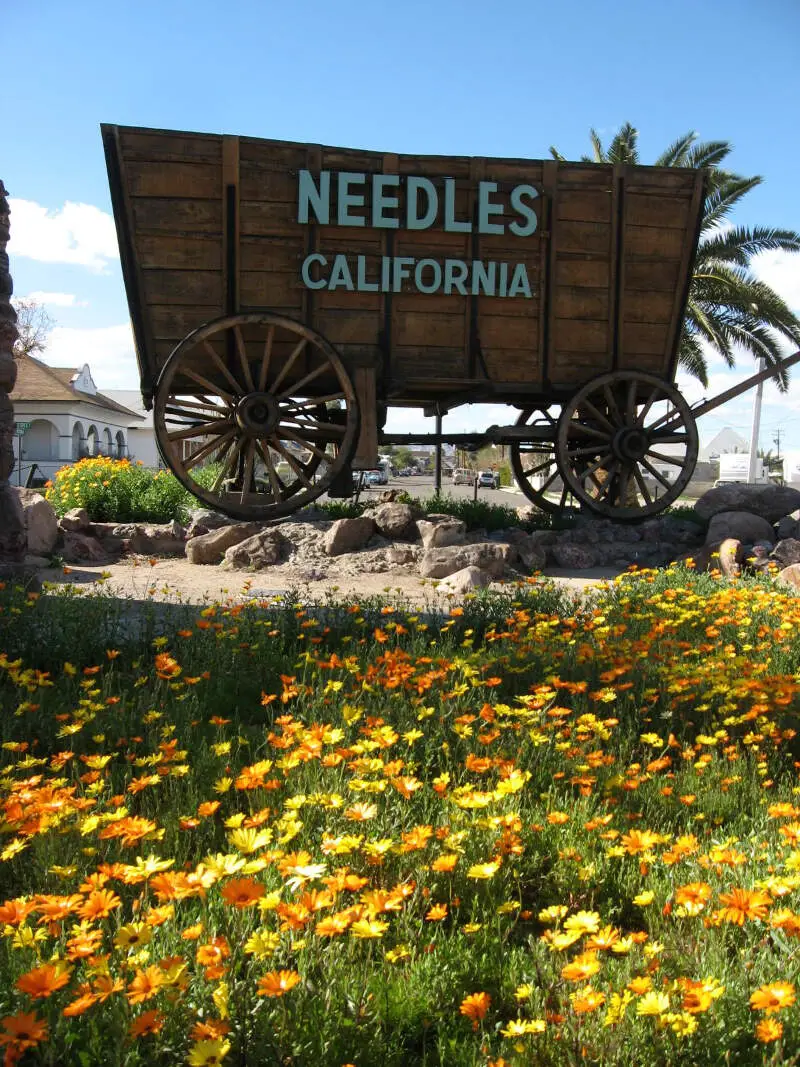
6. Needles
/10
Population: 4,882
Median Home Value: $134,400
Median Income: $39,876
Unemployment Rate: 12.8%
7. Homestead Valley
/10
Population: 2,772
Median Home Value: $214,800
Median Income: $39,954
Unemployment Rate: 14.6%
8. North Edwards
Population: 1,015
Median Home Value: $135,800
Median Income: $35,469
Unemployment Rate: 9.8%
9. Boron
/10
Population: 2,627
Median Home Value: $131,100
Median Income: $61,607
Unemployment Rate: 18.3%
10. Mojave
/10
Population: 4,442
Median Home Value: $204,400
Median Income: $50,800
Unemployment Rate: 11.7%
Methodology: How do you decide if a small place in California is lousy or not?
To rank the worst small towns to live in California, we had to determine what criteria people like or dislike about a place. Assuming that people like low crime, solid education, things to do, and a stable economy isn’t a stretch.
We then analyzed the criteria using Saturday Night Science, the thinking you’d use at a bar. It seems like even your crazy Uncle would agree that a town with high crime is worse than a town with low crime; all else the same.
Using FBI crime data and the Census’s 2019-2023 American Community Survey, this is the criteria we used:
- Population Density (The lower, the worse)
- Highest Unemployment Rates
- Low housing costs (meaning there’s no demand)
- Adjusted Median Income (Median income adjusted for the cost of living)
- Education (Number of high school dropouts)
- High Crime
We looked at cities with populations between 1,000 and 5,000 people, of which there were many – 367 to be exact.
We get the crime numbers from the FBI, which gets them from the cities. Dropout numbers are based on the adult population, not just the current graduation rates of teenagers.
We base all our research on facts, which is meant as infotainment. We updated this article for 2025, which is our tenth time ranking the worst small places to live in California.
There You Have It – The Worst Small Towns In California
If you’re analyzing teeny places in the Golden State with the worst economic situations, where there’s high crime and there’s not a lot to do, this is an accurate list.
The worst small towns in California are Oasis, Weedpatch, Woodville, Big River, Covelo, Needles, Homestead Valley, North Edwards, Boron, and Mojave.
If you’re curious enough, here are the best small towns to live in California, according to science:
- Belvedere (Pop. 2,415)
- Emerald Lake Hills (Pop. 4,396)
- Castle Hill (Pop. 1,303)
For more California reading, check out:
Worst Small Towns In California
| Rank | Town | Population | Unemployment Rate | Home Value | Median Income |
|---|---|---|---|---|---|
| 1 | Oasis | 4,455 | 16.3% | $35,600 | $36,553 |
| 2 | Weedpatch | 2,661 | 24.1% | $135,700 | $21,450 |
| 3 | Woodville | 1,768 | 16.5% | $194,300 | $45,089 |
| 4 | Big River | 1,025 | 15.0% | $132,400 | $40,179 |
| 5 | Covelo | 1,495 | 26.1% | $322,600 | $35,735 |
| 6 | Needles | 4,882 | 12.8% | $134,400 | $39,876 |
| 7 | Homestead Valley | 2,772 | 14.6% | $214,800 | $39,954 |
| 8 | North Edwards | 1,015 | 9.8% | $135,800 | $35,469 |
| 9 | Boron | 2,627 | 18.3% | $131,100 | $61,607 |
| 10 | Mojave | 4,442 | 11.7% | $204,400 | $50,800 |
| 11 | Fairmead | 1,119 | 11.3% | $220,700 | $44,375 |
| 12 | East Porterville | 4,567 | 21.1% | $213,100 | $38,482 |
| 13 | Sky Valley | 2,437 | 8.1% | $136,500 | $47,656 |
| 14 | Ford City | 4,310 | 18.5% | $197,500 | $45,976 |
| 15 | South Taft | 2,534 | 13.7% | $155,700 | $41,875 |
| 16 | Teviston | 1,092 | 23.8% | $1,000 | $46,914 |
| 17 | Wofford Heights | 2,209 | 13.9% | $196,600 | $40,168 |
| 18 | Lost Hills | 1,861 | 5.0% | $169,900 | $42,333 |
| 19 | Parksdale | 2,980 | 20.2% | $259,600 | $55,395 |
| 20 | Terra Bella | 1,658 | 42.4% | $225,000 | $62,073 |
| 21 | Anza | 1,842 | 13.4% | $316,700 | $53,814 |
| 22 | Lake Isabella | 3,654 | 11.7% | $112,200 | $26,763 |
| 23 | Kelseyville | 4,204 | 17.3% | $240,500 | $43,475 |
| 24 | Buttonwillow | 1,251 | 6.2% | $215,200 | $35,417 |
| 25 | Biola | 1,163 | 11.2% | $237,100 | $40,094 |
| 26 | Thermal | 1,420 | 5.5% | $183,200 | $1,000 |
| 27 | Bodfish | 2,191 | 20.3% | $104,700 | $33,295 |
| 28 | Calwa | 2,140 | 19.2% | $196,900 | $63,232 |
| 29 | Maricopa | 1,015 | 13.3% | $121,800 | $38,676 |
| 30 | Bystrom | 4,109 | 18.7% | $250,300 | $42,212 |
| 31 | Portola | 2,462 | 17.3% | $232,100 | $42,385 |
| 32 | Tipton | 2,989 | 10.9% | $245,500 | $51,389 |
| 33 | Cutler | 4,002 | 18.1% | $203,300 | $62,151 |
| 34 | Rancho Tehama Reserve | 1,102 | 3.2% | $149,000 | $43,750 |
| 35 | Whitewater | 1,254 | 16.5% | $273,600 | $76,974 |
| 36 | Planada | 3,524 | 8.7% | $237,200 | $45,588 |
| 37 | San Joaquin | 3,734 | 17.4% | $249,700 | $51,591 |
| 38 | West Park | 1,319 | 12.7% | $222,200 | $65,556 |
| 39 | Del Rey | 1,513 | 11.1% | $181,800 | $57,292 |
| 40 | Montague | 1,486 | 12.8% | $181,300 | $55,096 |
| 41 | Mariposa | 1,202 | 16.8% | $306,100 | $52,661 |
| 42 | Searles Valley | 1,698 | 10.6% | $68,500 | $65,625 |
| 43 | Morongo Valley | 3,907 | 7.9% | $265,100 | $56,821 |
| 44 | London | 1,701 | 8.3% | $163,900 | $48,618 |
| 45 | Maxwell | 1,174 | 9.6% | $234,400 | $64,286 |
| 46 | Weldon | 2,525 | 5.9% | $153,300 | $27,353 |
| 47 | Richgrove | 2,136 | 11.7% | $201,200 | $54,091 |
| 48 | Westmorland | 1,734 | 17.5% | $218,600 | $28,929 |
| 49 | Bethel Island | 2,144 | 31.1% | $549,500 | $78,393 |
| 50 | Caruthers | 2,143 | 13.3% | $288,000 | $64,722 |
| 51 | Poplar-Cotton Center | 2,038 | 5.8% | $209,100 | $51,893 |
| 52 | Le Grand | 1,773 | 11.1% | $245,200 | $53,750 |
| 53 | South Oroville | 2,811 | 11.8% | $248,400 | $64,785 |
| 54 | Weed | 2,765 | 5.8% | $206,500 | $38,966 |
| 55 | Home Garden | 1,903 | 12.3% | $162,900 | $52,823 |
| 56 | Seeley | 1,654 | 17.1% | $186,200 | $56,917 |
| 57 | North Shore | 3,373 | 7.5% | $193,000 | $43,208 |
| 58 | Kennedy | 2,697 | 9.9% | $318,000 | $58,859 |
| 59 | Strathmore | 3,244 | 6.9% | $205,600 | $42,705 |
| 60 | Riverdale | 2,803 | 7.3% | $265,100 | $54,250 |
| 61 | China Lake Acres | 2,523 | 7.0% | $168,100 | $67,438 |
| 62 | Armona | 4,084 | 16.3% | $260,300 | $60,100 |
| 63 | Bret Harte | 4,807 | 8.8% | $289,300 | $42,422 |
| 64 | Green Acres | 3,226 | 16.8% | $242,000 | $71,609 |
| 65 | Junction City | 1,084 | 8.6% | $401,900 | $62,669 |
| 66 | Rouse | 1,205 | 9.9% | $1,000 | $45,071 |
| 67 | Squaw Valley | 3,584 | 4.6% | $283,500 | $81,094 |
| 68 | Mountain View Acres | 3,155 | 18.5% | $346,000 | $70,179 |
| 69 | Mesa Verde | 1,025 | 5.4% | $102,700 | $48,523 |
| 70 | Empire | 3,867 | 13.6% | $306,700 | $48,990 |
| 71 | Yosemite Valley | 1,848 | 6.4% | $1,000 | $1,000 |
| 72 | Garberville | 1,568 | 1.7% | $418,000 | $37,760 |
| 73 | Sheridan | 1,447 | 9.1% | $425,000 | $79,732 |
| 74 | Clearlake Oaks | 2,174 | 16.5% | $206,000 | $38,669 |
| 75 | Lewiston | 2,434 | 3.5% | $328,900 | $58,125 |
| 76 | Dunsmuir | 1,519 | 11.6% | $262,800 | $47,708 |
| 77 | Greenfield | 4,399 | 13.9% | $285,500 | $71,930 |
| 78 | Douglas City | 1,025 | 1.6% | $363,900 | $45,938 |
| 79 | South Dos Palos | 1,637 | 15.3% | $278,000 | $55,288 |
| 80 | Taft Mosswood | 1,199 | 7.6% | $322,300 | $55,526 |
| 81 | Quincy | 1,580 | 12.5% | $284,500 | $87,008 |
| 82 | Burney | 2,921 | 9.9% | $225,000 | $67,097 |
| 83 | Lucerne | 3,156 | 8.6% | $234,400 | $47,460 |
| 84 | Meadowbrook | 3,368 | 7.8% | $323,800 | $58,250 |
| 85 | Lone Pine | 1,373 | 3.1% | $192,800 | $49,063 |
| 86 | Hayfork | 3,198 | 0.0% | $291,300 | $45,918 |
| 87 | Desert Edge | 3,642 | 6.1% | $56,900 | $40,089 |
| 88 | Airport | 1,258 | 2.3% | $333,300 | $42,000 |
| 89 | Stratford | 1,030 | 2.9% | $1,000 | $61,090 |
| 90 | Redway | 1,276 | 9.9% | $363,700 | $1,000 |
| 91 | Frazier Park | 2,322 | 8.2% | $336,400 | $40,839 |
| 92 | Easton | 2,406 | 10.7% | $292,600 | $92,446 |
| 93 | Los Molinos | 1,590 | 9.1% | $220,300 | $34,324 |
| 94 | Goshen | 4,895 | 4.6% | $244,800 | $72,813 |
| 95 | Lenwood | 3,708 | 5.7% | $139,600 | $70,714 |
| 96 | Delft Colony | 1,024 | 52.3% | $1,000 | $37,004 |
| 97 | Alturas | 2,703 | 8.2% | $152,600 | $54,634 |
| 98 | Warm Springs | 1,502 | 10.1% | $321,400 | $75,114 |
| 99 | Bayview Cdp (Humboldt County) | 2,708 | 9.5% | $254,500 | $44,239 |
| 100 | Pixley | 3,796 | 3.1% | $220,000 | $70,574 |
Do your homework, I don’t know about the other towns but East Nicolaus is great, like John Cooper said, East Nicolaus Spartans took State Champ and you have obviously never been to Sammie’s, you can’t get a hold of them because their busy serving up delicious food, That town has more to offer than some big city, lights, noise, crime. You can keep your CEO Salary lifestyle. Spartans Proud!!!!
What some people believe to be undesirable is actually quite desirable to others. Our small town, East Nicolaus, might seem unworthy of accolades to some who simply value other aspects of modern life. However, East Nic boasts high achieving schools with strong academics and athletic programs, recreation programs for local youth, a caring community, and access to all the amenities valued by the writer of the article in nearby metropolitan areas without having to live in the thick of all the hustle and bustle. We are happy. This is just simply not for you.
Smith Corner isn’t actually a town. It’s a community inside the town of Shafter. Just like #19 Mexican Colony. Unfortunately back in the day Shafter was much more like a town in the south. Smith Corner was for the poor white folks and the Mexican Colony was where only Mexicans lived. We also have a “Cherokee Strip” where Native Americans lived at one time. These places were made to keep the poor and people who were not white out of town. We haven’t come very far since then. Ask any of the people who live in these communities and they will tell you SHAFTER.
My nephew goes to school in Nicolaus and if my husband and I live in the area when our child starts school, he will also go to Nicolaus. I was born and raised in Wheatland and i’m hoping we stay in the area so my son will get to experience, not only the wonderful teachers but also excellent team spirit of Nicolaus. This is a poorly researched piece of writing.
Your photo of Newell, near the Oregon California border, is not a photo of our Newell. We have no hwy 90, hwy 10, or an intersection, and no lines of trees on our only hwy 139.
Yeah im gonna have to agree with most of these comments- referring to the inadequacy of your list of Cali’s worst small towns- based solely on one simple fact…..
Where I live, and the surrounding communities near me, were NOT EVEN MENTIONED in the entire list lol. Because i know one thing for sure: Its absolutely NOT because we dont MAKE the list of the top 100 worst small towns! So i feel justified in assuming that our area was most likely just skipped over. Also, in East Nicholas’s defense- its probably considered one of the BETTER places to live around that area lol- (i know this because its close to home for me)… Try researching YUBA COUNTY (aka Marysville/Linda and Olivehurst) if you wanna find the #1 worst small town in California lol trust me youll be updating that list when you’re done 🙂
Coalinga
Corcoran