
California. The American dream. The state where you can get the sun, surf, mountains and deserts. Where dreams are made and movie stars bask in the glory of their own self worth.
Where you have to ration your water. Sit in traffic. Pay too much for your house.
While California is overall, a glorious state, it has some serious, glaring issues, just like most other states. But most of the people reading this live there, and are already aware of this fact, so we won’t dwell on it.
Instead, let’s have some fun and look at only certain areas where things are the absolute worst.
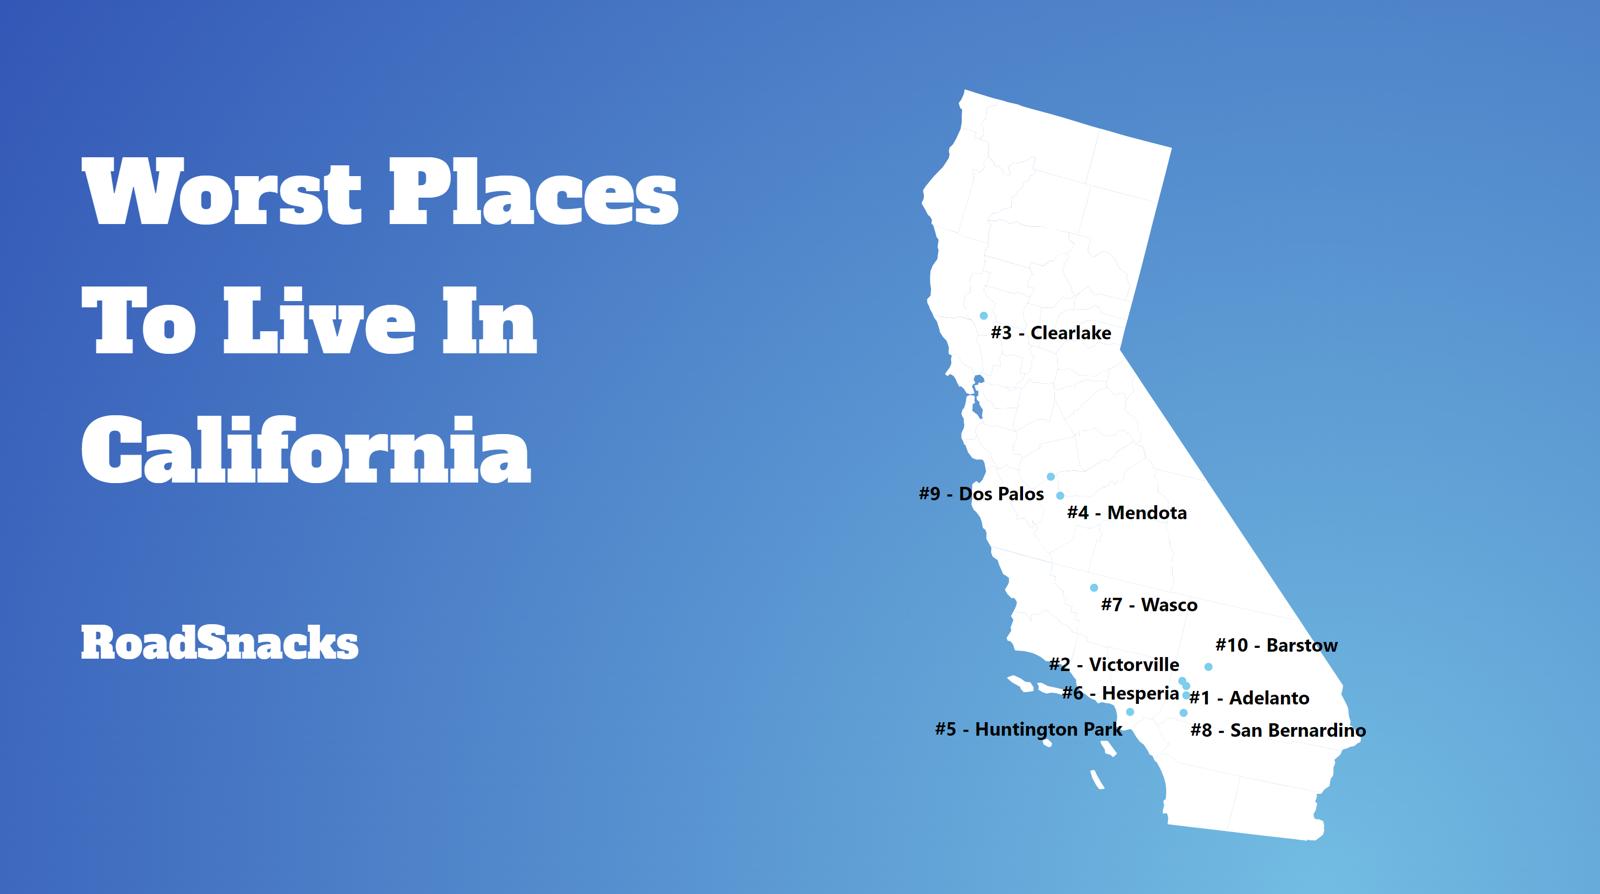
After analyzing all 411 cities with a population over 5,000, we came up with this list as the 10 worst places to live in California:
Table Of Contents: Top Ten | Methodology | Summary | Table
The 10 Worst Places To Live In California For 2024
Where are these places, you wonder? And before you get all riled up and say we’re picking on small towns in California, that’s not the case.
We understand there’s a lot of good in every place. For example, the best place to live in California is Los Altos.
However, according to data (which doesn’t measure things like beauty and ‘friendly people’), the state has far better options for making a place home. And the worst place to live in California? The worst place to live in California is Adelanto.
Read below to see how we crunched the numbers and how your city fared in 2024.
If you’re looking for something more national, check out the worst cities in America or the worst states in America.
For more California reading, check out:
- Best Places To Live In California
- Cheapest Places To Live In California
- Most Dangerous Cities In California
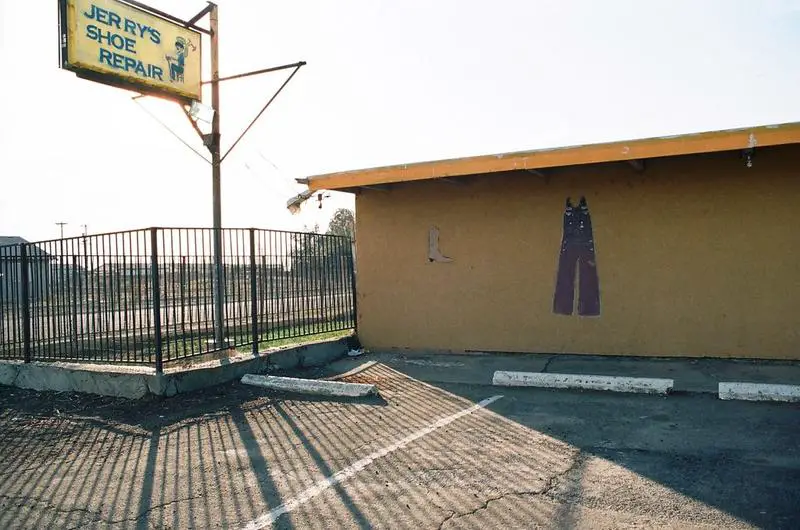
The 10 Worst Places To Live In California For 2024

/10
Population: 37,960
Average Home Price: $373,041
Median Income: $62,582
Unemployment Rate: 11.4%
Crime Per Capita: 0.0185
More on Adelanto: Data | Crime | Cost Of Living | Real Estate
Adelanto has the exact same problems that Lucerne Valley has, and it’s located only a half hour away. Except, the crime in Adelanto is far worse than it is in Lucerne Valley. Its residents most likely work in nearby Victorville or make the trek through the Cajon Pass to shlep into San Bernardino or Riverside.
Most people have only been to Adelanto while driving on 395 on their way up north, or because they got talked into attending a baseball game at Maverick Stadium.
Or, they were desperate because Apple Valley’s Del Taco was closed.

/10
Population: 134,417
Average Home Price: $413,567
Median Income: $65,746
Unemployment Rate: 10.3%
Crime Per Capita: 0.0281
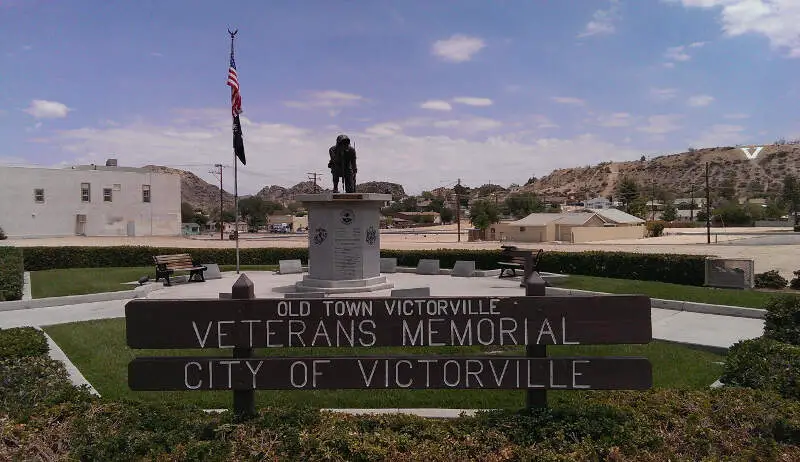
More on Victorville: Data | Crime | Cost Of Living | Real Estate
Victorville, located in San Bernardino County, California, has earned its reputation as one of the worst places to live in the state. One of the main reasons for this ranking is its alarming crime statistics. With a high violent crime rate of 0.009597000379416295 per capita, residents face safety concerns on a daily basis. The city experiences a significant number of murders, rapes, robberies, and aggravated assaults. Additionally, property crime is also prevalent, with 0.018494684452115433 incidents per capita. These crime rates contribute to a sense of insecurity and make Victorville a dangerous place to reside.
Aside from crime, Victorville also struggles with economic challenges. The city has a relatively high poverty level, with many residents struggling financially. The median income in Victorville is $65,746, which falls below the state average. The high unemployment rate of 10.3% exacerbates these economic difficulties. These factors not only impact the quality of life for individuals and families but also hinder the overall development and prosperity of the community

/10
Population: 16,612
Average Home Price: $216,743
Median Income: $41,047
Unemployment Rate: 16.7%
Crime Per Capita: 0.0302
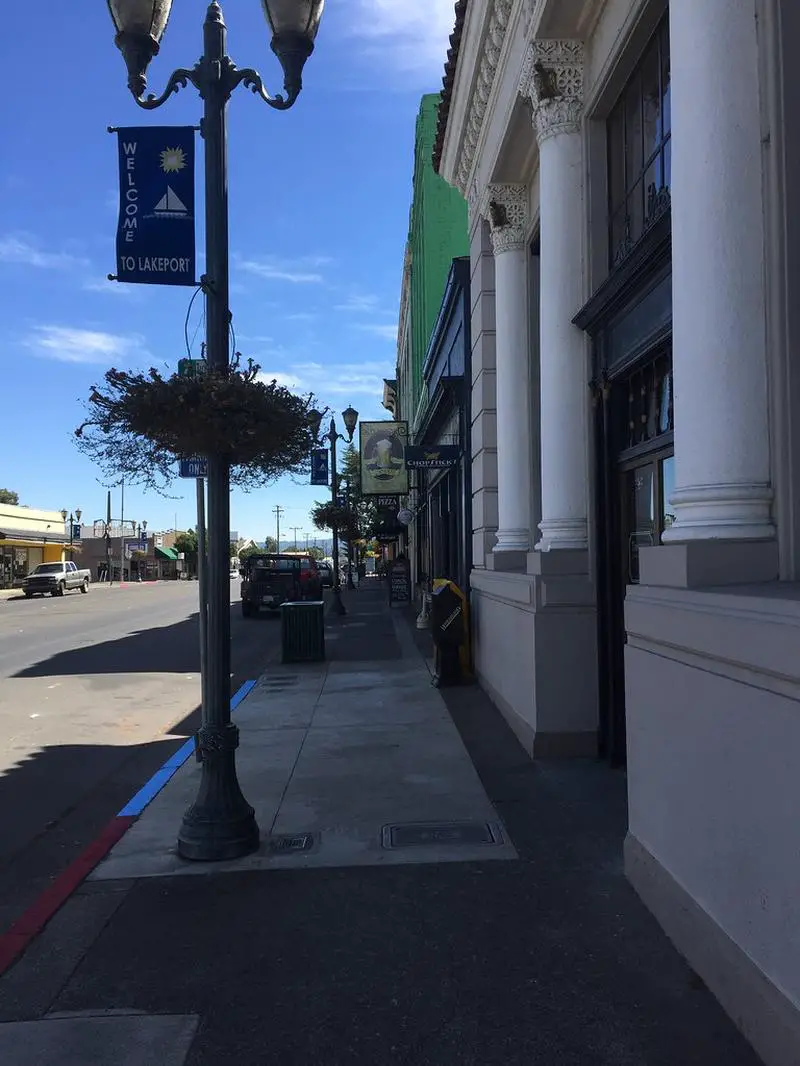
More on Clearlake: Data | Crime | Cost Of Living | Real Estate
Most people have never heard of Clearlake. A Google map search determined it’s on the banks of Clear Lake, in the middle of nowhere north of Sacramento. Apparently, things aren’t too fabulous there, as the incomes here are almost on the poverty level, and 1 in 10 people are unemployed. While it could be considered a bit of a weekend getaway for city slickers (maybe?), almost half of the city’s roads are unpaved. Not a good sign.
And the nearest Del Taco is an hour and a half away.

/10
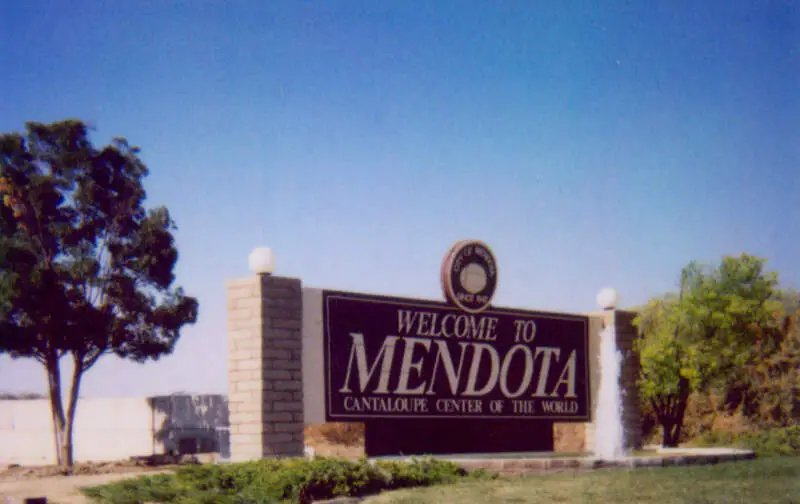
Population: 12,603
Average Home Price: $287,718
Median Income: $43,315
Unemployment Rate: 11.4%
Crime Per Capita: 0.0198
More on Mendota: Data | Crime | Cost Of Living | Real Estate
Mendota is a tiny place wedged between the 5 Freeway and Fresno in Central California. This region of California, to put it nicely, is pretty isolated, hot, and sprinkled with farms and all other sorts of agriculture. It’s an important place, economically speaking, since a lot of the nation relies on California grown crops.
However, when you consider how hard central California has been hit with water-related issues, it isn’t surprising that at least one city in this region topped this list. Crime in the area is way above normal, and residents are underemployed and way underpaid. Simply speaking, there really isn’t anything charming about Mendota.

/10
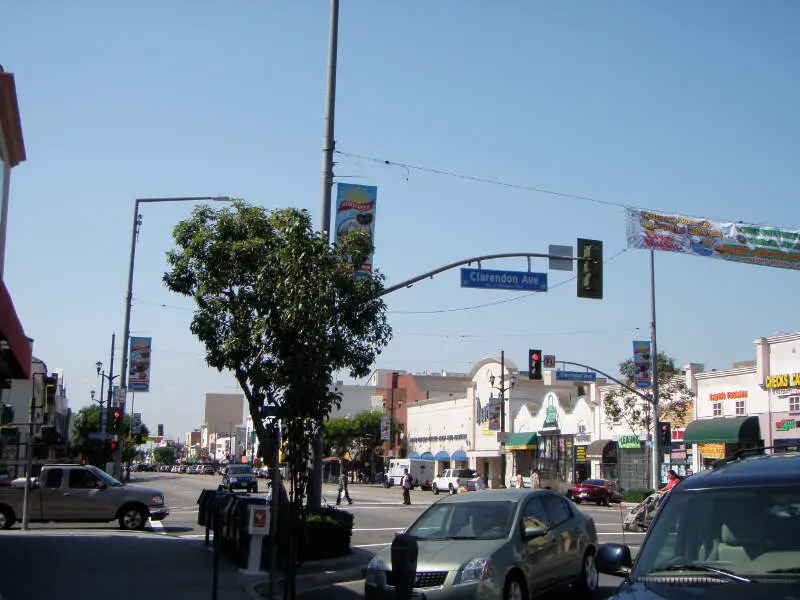
Population: 54,547
Average Home Price: $613,597
Median Income: $54,073
Unemployment Rate: 10.1%
Crime Per Capita: 0.0441
More on Huntington Park: Data | Crime | Cost Of Living | Real Estate
Nestled in Los Angeles County, California, Huntington Park has unfortunately earned a reputation as one of the worst places to live in the state. With a population of 54,547, this city faces numerous challenges that contribute to its unfavorable status. One significant concern is the high crime rate, with 416 violent crimes and 1,991 property crimes reported in 2020 alone. This translates to a violent crime rate of 0.007626450583900123 per capita and a property crime rate of 0.03650063248207967 per capita. These statistics indicate that residents of Huntington Park face a heightened risk of becoming victims of crime.
Furthermore, Huntington Park struggles with other socio-economic factors such as poverty and unemployment. The median income stands at $54,073, leaving many residents grappling with financial hardships. Additionally, the unemployment rate hovers at 10.1%, exacerbating the challenges faced by the community. Despite these issues, it’s important to note that with concerted efforts, Huntington Park has the potential to improve its living conditions and enhance safety for its residents.

/10
Population: 99,878
Average Home Price: $428,607
Median Income: $67,698
Unemployment Rate: 9.8%
Crime Per Capita: 0.0204
More on Hesperia: Data | Crime | Cost Of Living | Real Estate

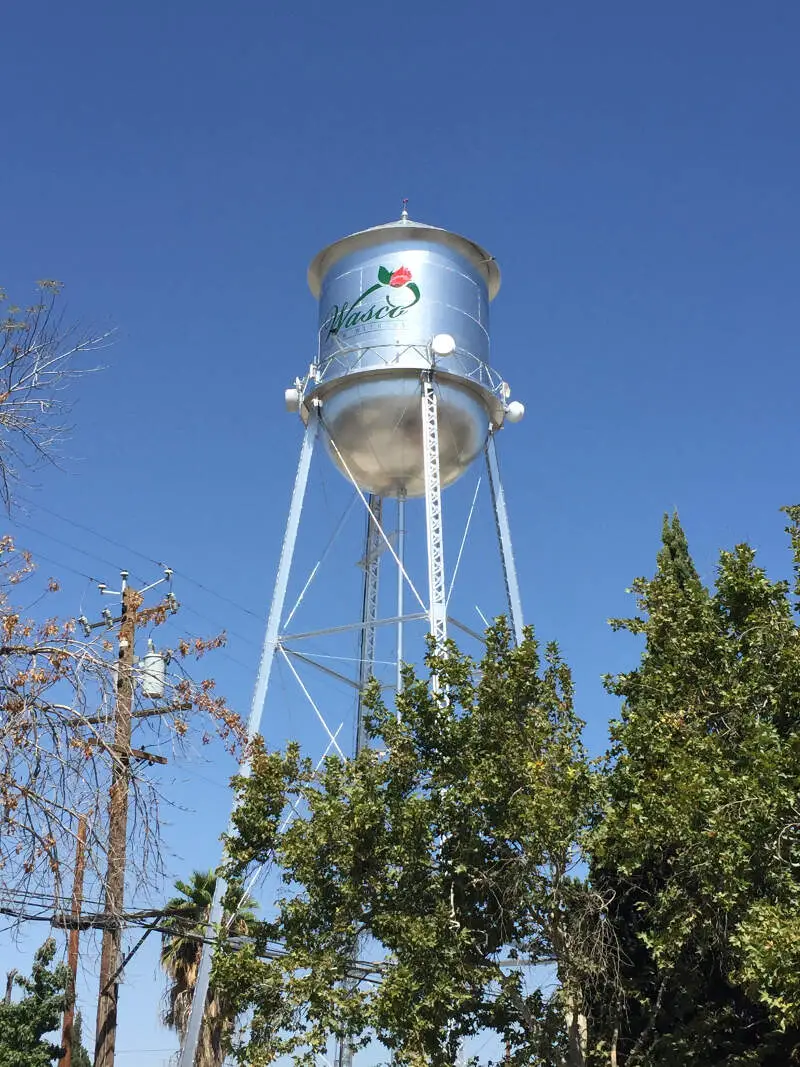
/10
Population: 26,317
Average Home Price: $290,792
Median Income: $48,109
Unemployment Rate: 8.6%
Crime Per Capita: 0.0611
More on Wasco: Data | Cost Of Living | Real Estate

/10
Population: 221,041
Average Home Price: $455,364
Median Income: $61,323
Unemployment Rate: 7.6%
Crime Per Capita: 0.0417
More on San Bernardino: Data | Crime | Cost Of Living | Real Estate
Perhaps the only thing surprising about San Bernardino being 9th is that it wasn’t higher. Crime here is horrible, more than 1 in 10 residents are without jobs (and that’s conservative), and well we could go on and on about San Bernardino’s issues.
You’ve heard it all before. When considering the data, the only reason San Bernardino is only 9th is that there are some areas of the city in which residents earn professional salaries, and, frankly, there’s a lot more to do in the San Bernardino region than there is in the desert. And no, dodging bullets isn’t one of them.
But as professionals continue to flee into the nearby enclaves of East Highlands, Yucaipa and Redlands, the city of San Bernardino, which saw its glory days spike in the late 1970s, will continue to head down the drain and unfortunately, become an area only for those who have no aspirations to exceed in life.
/10
Population: 5,755
Average Home Price: $338,714
Median Income: $51,230
Unemployment Rate: 12.8%
Crime Per Capita: 0.0182
More on Dos Palos: Data | Crime | Cost Of Living | Real Estate
Situated a half-hour south of Merced, Dos Palos is a city of 5,755 that ranks as the 9th worst place to call home in California.
The poverty is moderately high, unemployment is nearly double the statewide average, and criminal activity (especially violent crime) is all too common.
On a positive note, Dos Palos is one of the most affordable cities in California, with a cost of living below the national average (that’s rare in the Golden State).
Also, it’s easy to get away from it all if you’re a fan of nature; both the San Luis and Merced National Wildlife Reguges are just a short drive away.

/10
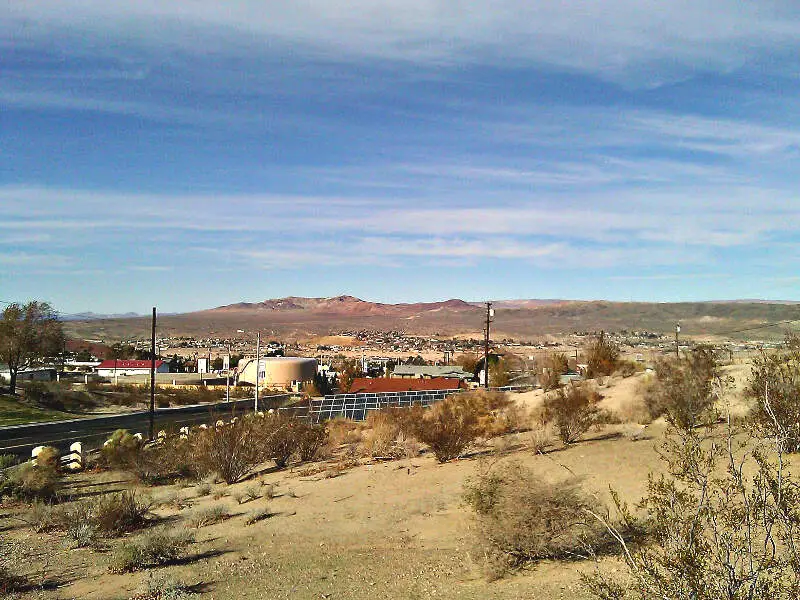
Population: 25,235
Average Home Price: $248,629
Median Income: $52,200
Unemployment Rate: 9.1%
Crime Per Capita: 0.0343
More on Barstow: Data | Crime | Cost Of Living | Real Estate
Located in San Bernardino County, California, Barstow is unfortunately known as one of the worst places to live in the state. With a high crime rate and safety concerns, it ranks as the number one worst place to live in California for 2023. The city has a population of 25,235 and a median income of $52,200, which is below the state average. Additionally, the median rent stands at $978.0, making it difficult for residents to find affordable housing. The high poverty level and unemployment rate further contribute to the challenges faced by the community.
When it comes to crime statistics, Barstow has alarming numbers. In 2020, there were 277 violent crimes reported, including 6 murders, 10.0 rapes, 54.0 robberies, and 207.0 aggravated assaults. Property crime was also prevalent, with 589 incidents reported, including 169.0 burglaries. These figures highlight the safety concerns that residents face on a daily basis.
Despite its struggles, Barstow’s situation can improve with dedicated efforts and support. By addressing the underlying issues such as poverty and unemployment, the city has the potential to create a safer and more prosperous environment for its residents. Furthermore, its location in the Mojave Desert offers opportunities for economic growth and development. With a collaborative approach and investment in resources, Barstow can strive towards becoming a better place to live within California.
Methodology: How we determined the worst places to live in California for 2024
To figure out the worst places to live in California, we used Saturday Night Science to idenift what kinds of things people like and then decide what cities have the least amount of those things.
We don’t think it’s a stretch to assume that people like the following things:
- Good education
- Lots of jobs
- Low crime
- Low poverty
- Nice homes
- High incomes
- High population density (Lots of things to do)
- Short work commutes
- Health insurance
The data comes from the Census’s most recent American Community Survey and the FBI Uniform Crime Report.
We broke crime down into violent crime and property crime to give violent crime a more significant weight. If you did a simple calculation of all crimes per capita, property crimes are typically 7x more common and bias that ranking.
Furthermore, only cities with at least 5,000 people were considered — leaving 411 cities.
We then ranked each city from 1 to 411 for all the criteria, with a #1 ranking being the worst for the particular criteria.
Next, we averaged the rankings into one “Worst Place To Live Score.”
Finally, we ranked every city on the “Worst Place To Live Score,” with the lowest score being the worst city in California — Adelanto. Read on for a detailed look at the ten worst cities in California. This article is an opinion based on facts meant as infotainment. We updated this article for 2024. This list is our tenth time ranking the worst places to live in California.
Summary: Wrapping Up The Worst In California
If you’re looking at areas in California with the worst economic situations, where there’s higher than average crime and little to do, this is an accurate list.
And in the end, Adelanto ranks as the worst city to live in California for 2024.
The worst cities in California are .
If you’re curious enough, here are the best cities to live in California:
- Villa Park (Pop. 5,814)
- Cupertino (Pop. 59,763)
- Los Altos (Pop. 31,133)
For more California reading, check out:
Worst Places To Live In California
| Rank | City | Population | Unemployment Rate | Home Price | Median Income | Crime Per Capita |
|---|---|---|---|---|---|---|
| 1 | Adelanto | 37,960 | 11.4% | $373,041 | $62,582 | 0.0185 |
| 2 | Victorville | 134,417 | 10.3% | $413,567 | $65,746 | 0.0281 |
| 3 | Clearlake | 16,612 | 16.7% | $216,743 | $41,047 | 0.0302 |
| 4 | Mendota | 12,603 | 11.4% | $287,718 | $43,315 | 0.0198 |
| 5 | Huntington Park | 54,547 | 10.1% | $613,597 | $54,073 | 0.0441 |
| 6 | Hesperia | 99,878 | 9.8% | $428,607 | $67,698 | 0.0204 |
| 7 | Wasco | 26,317 | 8.6% | $290,792 | $48,109 | 0.0611 |
| 8 | San Bernardino | 221,041 | 7.6% | $455,364 | $61,323 | 0.0417 |
| 9 | Dos Palos | 5,755 | 12.8% | $338,714 | $51,230 | 0.0182 |
| 10 | Barstow | 25,235 | 9.1% | $248,629 | $52,200 | 0.0343 |
| 11 | Commerce | 12,253 | 4.9% | $636,672 | $66,071 | 0.1483 |
| 12 | Avenal | 13,423 | 12.0% | $224,162 | $51,902 | 0.0081 |
| 13 | Merced | 87,686 | 12.6% | $376,996 | $59,233 | 0.0372 |
| 14 | Lathrop | 29,633 | 8.9% | $631,337 | $108,732 | 0.0394 |
| 15 | Hemet | 89,651 | 9.5% | $425,611 | $49,901 | 0.0256 |
| 16 | Perris | 78,881 | 7.1% | $510,724 | $78,352 | 0.0292 |
| 17 | Desert Hot Springs | 32,386 | 7.4% | $375,154 | $45,863 | 0.0224 |
| 18 | Lynwood | 66,346 | 9.6% | $624,911 | $67,350 | 0.0321 |
| 19 | Atwater | 31,841 | 11.0% | $394,070 | $64,195 | 0.0338 |
| 20 | Rialto | 103,873 | 9.3% | $539,398 | $80,750 | 0.0343 |
| 21 | South Gate | 92,381 | 7.9% | $635,980 | $67,188 | 0.0372 |
| 22 | Apple Valley | 75,603 | 9.2% | $402,924 | $62,898 | 0.0208 |
| 23 | Compton | 94,822 | 7.9% | $584,418 | $69,728 | 0.0368 |
| 24 | Calipatria | 6,579 | 14.5% | $226,274 | $43,095 | 0.0299 |
| 25 | Los Banos | 45,560 | 7.9% | $445,660 | $76,164 | 0.0287 |
| 26 | Palmdale | 166,895 | 7.4% | $486,827 | $78,414 | 0.0205 |
| 27 | Arvin | 19,613 | 11.1% | $271,385 | $47,997 | 0.0287 |
| 28 | San Jacinto | 54,077 | 8.3% | $456,347 | $73,682 | 0.0247 |
| 29 | Lindsay | 12,581 | 17.1% | $282,082 | $44,816 | 0.0207 |
| 30 | Richmond | 115,619 | 6.9% | $633,759 | $86,618 | 0.0357 |
| 31 | Oroville | 20,283 | 7.5% | $299,169 | $46,362 | 0.0454 |
| 32 | Stockton | 320,030 | 7.7% | $428,288 | $71,612 | 0.0394 |
| 33 | Montclair | 37,842 | 6.4% | $614,701 | $72,789 | 0.0478 |
| 34 | South El Monte | 19,694 | 6.7% | $697,787 | $67,724 | 0.0505 |
| 35 | Cudahy | 22,657 | 9.2% | $624,322 | $49,596 | 0.0197 |
| 36 | Marysville | 12,681 | 7.7% | $371,397 | $52,012 | 0.0285 |
| 37 | Jurupa Valley | 105,672 | 6.8% | $617,207 | $91,562 | 0.0313 |
| 38 | Huron | 6,260 | 12.4% | $239,041 | $43,664 | 0.0184 |
| 39 | Banning | 29,929 | 8.4% | $390,975 | $54,083 | 0.0221 |
| 40 | Pomona | 149,831 | 6.5% | $619,187 | $73,515 | 0.0351 |
| 41 | Inglewood | 106,806 | 8.2% | $724,865 | $67,563 | 0.0343 |
| 42 | Ceres | 49,183 | 10.5% | $434,791 | $70,191 | 0.0269 |
| 43 | Williams | 5,539 | 15.0% | $362,655 | $84,457 | 0.0190 |
| 44 | Coachella | 42,279 | 11.9% | $407,051 | $52,466 | 0.0206 |
| 45 | Madera | 66,784 | 12.8% | $384,320 | $61,626 | 0.0216 |
| 46 | Firebaugh | 8,139 | 18.3% | $301,352 | $36,078 | 0.0149 |
| 47 | Gustine | 6,122 | 14.3% | $405,381 | $51,636 | 0.0152 |
| 48 | Red Bluff | 14,576 | 8.7% | $307,032 | $47,367 | 0.0587 |
| 49 | San Pablo | 31,907 | 7.9% | $586,874 | $72,552 | 0.0312 |
| 50 | Vallejo | 125,132 | 7.0% | $537,019 | $86,112 | 0.0516 |
| 51 | Shafter | 20,162 | 7.1% | $340,653 | $66,418 | 0.0290 |
| 52 | Los Angeles | 3,881,041 | 7.7% | $926,593 | $76,244 | 0.0348 |
| 53 | Eureka | 26,519 | 10.1% | $419,877 | $51,971 | 0.0461 |
| 54 | Tulare | 69,261 | 8.6% | $325,247 | $65,933 | 0.0284 |
| 55 | Montebello | 62,056 | 6.8% | $752,515 | $72,317 | 0.0333 |
| 56 | Tehachapi | 12,855 | 8.6% | $400,775 | $62,788 | 0.0275 |
| 57 | Lancaster | 171,465 | 7.5% | $449,018 | $71,367 | 0.0268 |
| 58 | Shasta Lake | 10,361 | 8.2% | $290,779 | $54,490 | 0.0418 |
| 59 | Chowchilla | 18,772 | 10.1% | $364,844 | $67,212 | 0.0166 |
| 60 | Selma | 24,576 | 10.3% | $330,081 | $53,874 | 0.0315 |
| 61 | Colton | 53,959 | 7.4% | $462,959 | $66,725 | 0.0272 |
| 62 | Palm Springs | 44,935 | 8.6% | $648,185 | $67,451 | 0.0572 |
| 63 | Highland | 56,789 | 6.0% | $500,464 | $72,222 | 0.0207 |
| 64 | Lompoc | 44,086 | 8.0% | $537,952 | $66,947 | 0.0241 |
| 65 | Big Bear Lake | 5,059 | 6.0% | $595,254 | $70,020 | 0.0478 |
| 66 | Kerman | 15,980 | 12.8% | $384,871 | $53,956 | 0.0206 |
| 67 | Moreno Valley | 209,578 | 7.5% | $523,823 | $82,637 | 0.0246 |
| 68 | Riverside | 316,076 | 6.1% | $606,630 | $83,448 | 0.0380 |
| 69 | Santa Fe Springs | 18,840 | 4.2% | $711,899 | $81,500 | 0.0770 |
| 70 | Fresno | 541,528 | 9.0% | $363,927 | $63,001 | 0.0436 |
| 71 | Bakersfield | 404,321 | 7.1% | $377,282 | $73,827 | 0.0460 |
| 72 | Lake Elsinore | 69,993 | 6.9% | $556,993 | $89,788 | 0.0278 |
| 73 | Porterville | 62,491 | 10.1% | $299,749 | $55,785 | 0.0258 |
| 74 | Dinuba | 24,713 | 11.0% | $325,421 | $54,590 | 0.0285 |
| 75 | Coalinga | 17,488 | 11.8% | $270,872 | $68,976 | 0.0158 |
| 76 | Antioch | 115,016 | 7.9% | $607,514 | $90,709 | 0.0281 |
| 77 | Pittsburg | 76,419 | 7.1% | $575,383 | $98,408 | 0.0279 |
| 78 | Bell | 33,377 | 6.5% | $634,376 | $56,685 | 0.0185 |
| 79 | Santa Maria | 109,543 | 6.3% | $595,082 | $81,237 | 0.0342 |
| 80 | Orange Cove | 9,635 | 13.7% | $250,675 | $33,671 | 0.0079 |
| 81 | Hawthorne | 86,978 | 7.5% | $845,860 | $72,298 | 0.0277 |
| 82 | Reedley | 25,248 | 11.4% | $350,084 | $61,629 | 0.0198 |
| 83 | Bellflower | 78,352 | 8.4% | $736,258 | $75,379 | 0.0298 |
| 84 | Yucca Valley | 21,700 | 7.6% | $360,665 | $54,153 | 0.0183 |
| 85 | Arcata | 18,536 | 13.9% | $509,714 | $43,444 | 0.0354 |
| 86 | Paramount | 53,255 | 5.3% | $599,020 | $67,197 | 0.0322 |
| 87 | Ontario | 176,326 | 5.8% | $627,446 | $78,070 | 0.0250 |
| 88 | Woodlake | 7,495 | 9.1% | $291,379 | $44,719 | 0.0105 |
| 89 | El Paso de Robles (Paso Robles) | 31,595 | 4.8% | $702,316 | $83,948 | 0.0482 |
| 90 | Brawley | 26,509 | 18.2% | $305,267 | $56,229 | 0.0291 |
| 91 | Gridley | 7,444 | 10.8% | $335,103 | $56,428 | 0.0227 |
| 92 | Delano | 50,498 | 9.8% | $309,574 | $53,639 | 0.0253 |
| 93 | Wildomar | 36,822 | 6.5% | $617,209 | $89,912 | 0.0196 |
| 94 | Blythe | 17,949 | 7.9% | $217,775 | $52,377 | 0.0193 |
| 95 | Fort Bragg | 7,007 | 6.7% | $553,769 | $47,662 | 0.0395 |
| 96 | Taft | 7,414 | 4.8% | $192,032 | $52,414 | 0.0467 |
| 97 | Holtville | 5,620 | 11.2% | $310,017 | $44,939 | 0.0137 |
| 98 | Watsonville | 52,457 | 9.4% | $824,009 | $72,295 | 0.0240 |
| 99 | Parlier | 14,625 | 6.9% | $287,532 | $50,026 | 0.0191 |
| 100 | Corcoran | 22,808 | 11.2% | $244,181 | $53,103 | 0.0175 |
1.5 million visitors to Joshua Tree National Park every year….but “nobody takes vacations to the desert”
FYI, Palm Springs is the desert, too….
(and I wouldn’t live in Foster City if you paid me.)
What a crock of spoiled granola. Joshua Tree is centre of the universe, has Joshua tree National Park with over 1.6 million visitors alone in 2014, 400 climbing formations and 8,000 climbing routes,an extensive network of trails. Some of the best artists and musicians in the world, Saturday farmers market that’s number one, restaurants, architecture , caring laid back people, good water, Mild winters, tolerable summers, spring and fall like weather 9 months of the year.
100’s of vacation rentals, bed and breakfasts, and many many second homes for those escaping the larger cities.
How about spending some time in thought on places you know nothing about?
I can tell the writer is very critical of social. He/she is evidently from nocal. As for weather, social beats nocal. What the writer fails to mention is most of the places mentioned are only minutes from mountains, ocean, desert, amusement parks of all sorts. The temps in the desert does get very warm but not like the 85-90 degrees in nocal with 90% humidity. I was raised in social. San Diego to be exact. Temps were 74 degrees as an average. I lived in northern Calif ( San Jose and Sunnyvale) it was nice there but crime was also high. The ocean temperature is to cold to enjoy. It is hours away from mountains and the unemployment rate and cost of living are both high.
Something I do agree with the writer on was the rating of Adelanto. It was to generous. I owned a home there. I believe it is corrupt. Dateline or 20-20 did a story some years back and it was described as the crookedist little city in the U.S. Sorry Adelanto, they have come a long way since then but has a long way to go. As for Lucern Valley, it is a rural town. Most folks live there to get away from the hustle and bustle of the city life. Most are very polite. Unlike a lot of cities. Neighbors help each other.
So writer, if you are going to make a list, do it impartially.
Ted,
Agreed on the writer having a NorCal bias. I was born in SoCal, and raised in NorCal. I love both areas, but for now, I call NorCal home. Just to set the record straight though, if you lived in SJ and Sunnyvale, in what way were the mountains hours away? Just the name “Silicon VALLEY” suggests that we are surrounded by mountains. But even if you travel away from the SV, the Santa Cruz Mountains are less than an hour away. Once you get there, if you continue going up north on the 1, (or PCH for you SoCal people) it is practically nothing but beaches on your left, and mountains on your right, all the way up to Daly City.
This writer is definitely not from “No Cal”, because otherwise, he’d realize that it’s “NorCal”. “No Cal” sounds like he’s talking about food. This guy doesn’t sound like he has much experience with California in general.
This list is bogus beyond belief.
“There’s a good chance you’ve never been to Joshua Tree, unless 1) you were a marine stationed at Twentynine Palms or 2) you took a family day trip to the far corners of the desert. Who are we kidding? No one takes vacations to the desert. No one takes vacations at all in California”
Who are you kidding, California has Sequoias, Red Woods, the Sierras, Rivers, Lakes, Mountains, Oceans, national parks and so on. Millions of people take a vacation in California. What a moron.
I couldn’t tell if she big list to the 600s went from 1 to best or best to worst. It makes no sense. NO SENSE!
I couldn’t tell if the big list to the 600s went from 1 to best or best to worst. It makes no sense. NO SENSE!
any “Quality of Life” survey that ranks El Cajon and Watsonville below Salinas is automatically suspect
I can’t take seriously any list that would say Menifee is a worse place to live than Barstow. I am well acquainted with both places, and I would take Menifee ANY day over Barstow!
Hemet is the top for crime, crime and danger and tons of child molesters living within 100 feet of schools.
Indian Wells #84 worst place to live in California. LOL. such a fail, this article.
Tell me, that the person who wrote this really lives and the desert and just dummied the data to keep people away. This is by far the lamest article of this type I have ever read.
No way La Habra is better than Brea. Your list is BS!
Opinions mean little. Every place you live has its good and bad characteristics. Who you are is much more important than where you live. I have lived in Yucca Valley, West Modesto, Fresno, Palm Springs, Palm Desert, La Quinta, Aptos, and Hayward. Right now I am living in Clovis. Every place has nice people and jerks. I could once again live in all of the places I lived before and do fine. Maybe West Modesto would be the hardest place. I really like the desert. I think this person who put this list together is on the very young side. There are a lot of wonderful places in California. One that did not make the list is Visalia. I love that place. I really loved Yucca Valley because of the weather, the clean air, the small town feel, the music, the proximity to the lower desert for work, and some of the stores. Another town that did not show up was Banning, which is a real sleeper. It’s a little windy at times and can get real cold, but it is up and coming. I think Riverside is also a very interesting city. In my opinion, Dana Point was way, way, way underrated. That place, and nearby San Juan Capistrano, are really very nice. I am very much enjoying living in Clovis. The crime is low, the shopping is close, the people are very friendly. I love the neighborhood where I live. We had a big neighborhood potluck in May and it was really very, very fun. I am new to the neighborhood (since December) If you can visit there and think about moving there, there are many nice things about it. The school district is extremely good. Another town that I really like is LaVerne. I think Pasadena is also a really fun place. Finally, I think that the best place to live (if you can afford it) is in, near, or around Thousand Oaks. I would have to say that Santa Barbera is in the top 5. Look at Felton, also. Watsonville is probably a possibility as is any place between San Diego and Dana Point. You have to also put Cambria high on the list. Have fun exploring!
Thanks for all the info !
WTH?????????
BARSTOW being # 56
Vs.
HESPERIA being # 10
Seriously, that’s bull!!!!!
I’m not saying that all the people in Barstow are bad. …., And that all the people in Hesperia are good…., But seriously everyone knows that Hesperia is WAY BETTER THAN BARSTOW. …. Just saying the list is COMPLETELY WRONG.!!!!!# …
They both suck
Funny that you should mention the Apple Valley Del Taco multiple times – everyone who has ever eaten here knows that the best Del Tacos are located in Barstow and still owned and operated by the original family – much better food than any of the corporately owned stores.
And the Hackbarths are some of the nicest people you’d ever want to meet.
How is Temecula a worse place to live than McFarland? Really? Calimesa being No. 15 not fair, either. Surprised to see San Bernardino so high on the list when the ballpark there was so good to him….
Calimesa and Hemet are the absolute bottom of the barrel actually. Interesting article though.
Calimesa is one of the better places
Do you mean Temecula? I didn’t see it on the list..saw Temescal, not Temecula.
What a joke this list is… Ever been to Joshua Tree? Well I actually live there. And 1.6 m!million visitors, artist and a lot of film and music stars call Joshua Tree home… When I have been to areas that ranked higher on your so called scientific list that are actual hell holes you may need to visit and write facts not fiction…
agreed.
I agree Kris! I lived there for 11 years and still own property there for a vacation home! Beautiful and unique place. Not to mention the National Park that is basically at everyone’s back door.
I have to agree Brea is a much better place to live than La Habra, Pico Rivera, and many other cities rated higher. I question the “science” used to make this list!!!
Malibu ranks 95 spots worse than Compton, hence the difference in property values.
Let me tell you 1st Watsonville is only low on crime rate because Tualre county is full of BS laws and they don’t tell all. Watsonville as well as Teviston, Pixley, Tipton, Dinuba, Woodlake, Farmersville, Ivanhoe, Poplar and a lot of Porterville are full of illegal immigrants, manufactured drugs and drug addicts who neglect and abandon their children, families and responsibilities
These are just a few of the areas that are listed that fail to meet their expectations. I would hunt the dumbass who made this list if I moved to those areas that are the worst of worst.
Sounds like Hemet. I just read the new website on Hemet about crime, property value, and sex offenders. It states there has only been one sex offender since 2017. Are you kidding me? In my zip code alone there are close to 500! Lies and city council here are a joke.
Brawley is #148?????…..I guess “science” doesn’t include the fact you live next to a stinkhole.
Population Density (The lower the worse – meaning there isn’t a lot to do)
So they think more people in less space is better??
They can have their cities, I’ll take the mountains any day.
I’m not sticking up for Lucerne Valley, but I live there, and your listings are a little flawed.
1. Lucerne Valley isn’t a city. It’s unincorporated, there is no central government, no police, state-based fire stations, and the school district has less than 1,000 kids.
2. Skip Lucerne Valley’s Del Taco to eat at Apple Valley? You’ve clearly never lived here: Lucerne Valley HAS NO FRANCHISE RESTAURANTS.
3. Lucerne Valley has no real estate market (where do you want to live? A valley or on the side of a cliff face?) No one buys a home here from other towns and cities because of the amenities. They do it because that’s what HUD and Welfare offices said they can afford.
I think your list is a bit flawed. Especially in the case of another hamlet called Trona: the village’s pH is so messed up that grass does not grow there. Outsiders eating from their Mom & Pop restaurants or drinking their water get sick from the ground toxicity. It bad enough that it was the inspiration for the movie Toxic Crusaders. That is because it is next to a salt crystal lake that is dredged for a chemical plant. It’s even more historically significant: Trona is the closest establishment to the Panamint Range where Charlie Manson lived. Lucerne Valley is known for being the site where Native Americans fought the US Cavalry. That’s about it.
Like I said, I’m not here to defend Lucerne Valley. I am going to say something, however: if you’re going to base your findings on “science”, it should be a comprehensive list of every Zip Code Tabulation Area that exists, and not just a list of towns you spidered off of Wikipedia.
Also… if this is using “science”, what are your data sources? For all I know you just populated a list of random number generator results just to see what would happen.
But I doubt you’ll try it again. Based on the clickbait article count of the “worst” places in INSERT STATE HERE, you’re just trying to sell your own ads.
Completely agree! A lot of these places look pretty nice and fancy compared to Trona, CA. I had to play them in football when I was in high school, and damn, that place is awful. I would rather be in jail for one year, than live in Trona, CA for two.
I am rewriting this whole thing and going to use ACTUAL facts and information. I would not write a blog just to sell ads and i look down on anyone who would. I really think you made your point in that last paragraph, ha! Im surprised I’ve yet to find anything that seems based on any real facts or information at all regarding cities pros and cons. Jeez! Where can you get some real information anymore?!
hemet folks should make it their goal in life to move up in the world, and buy a house in san ja, less crime and higher paying jobs.
Really? San Jacinto is Hemets neighbor. Same as Murrieta being Temecula’s neighbor. Same places with different names! Too funny
I am so glad you clowns never leave your computers. You can print out random lists to insult swaths of humanity from the distant safety of Durham, NC. If you consider “something to do” going to the Taco Bell, well then I guess I like places with fewer chains. You also don’t account for anything in the proximity of the towns you assess. Desert hot springs is less than ten miles from Palm Springs.
Casual inspection suggests that you haven’t been to California. Have you done a list like this for North Carolina?
I went through the list and did not see glendale california that should have been at the top
Clearlake is a great place to live, and if you don’t think so, please don’t come, or if you live here please move. I moved here because of the friendly people, and the dirt roads. I wanted country living for my family, and I still do. Don’t buy on a dirt road if you don’t want to drive down one. If you want paved roads and cement then please move to the city where you can have it all. Don’t move here and then complain about how our city is. I have lived all over the United States, and I have always come back to Clearlake. I love this city and the people. Everywhere has problems such as addiction, dirt road, private roads. Check your city living out, you will most like find that almost all cities have private roads. It is common in Cities to not take on roads that they know they can not maintain. If the people of Clearlake want paved roads, then they should have past the tax that wanted to do just that, pave the roads. Or even better, make Clearlake a special district and bond out and get all the roads done and pay your fair share on your property taxes every year. You have chooses to fix this. Remember, you the people are the City, so when you complain about how your city is, IT’S ON YOU!!! We the people are the government. You elect people to represent you only. If you don’t show up to Council meeting, State meetings or call your State and Federal representatives, then it is on you. Don’t expect someone else to do things for you, because they happen to represent you. YOU STILL HAVE TO STEP UP AND PAY THE PRICE TO GET THINGS DONE.
Seriously, why do people think we hate paved roads? We specifically looked for homes on an unpaved road. And the entire Clear Lake area (including Clearlake) IS beautiful. We got married there and have visited a million times.
I just read this article and found most of what you said regarding the city of San Bernardino pretty accurate. I actually wrote a highy relevant article about the inland empire area here: http://www.inlandempireinjurylaw.com/blog/the-inland-empire-defined-where-population-geography
It’s a shame such a large city has been on such a long downward spiral. The city government is corrupt, it’s bankrupt, and it’s completely bogged down by CalPERs city retirement pension fund obligations. What’s even worse is that there is no end in sight, and our glorious Governor, Jerry Brown, has announced that he has no intention of helping this city to recover. Very sad indeed.
To The Editor,
I invite you to come and stay at our Ranch just minutes from the Joshua Tree Park, to spend time in Joshua Tree so you can provide a better review of our beloved desert home, this is a home to many and a resort for many more. This is a stop to get out of the hustle of the city and enjoy true mother nature in a different form. Check us out on FB , airbnb & vrbo.
How can you say Perris is worst than Moreno Valley? Not even Superman would go to Moreno Valley to deal with their problems.
This is a joke……Where do they get their information???? #38 Valle Vista and #69 East Hemet are not seperate towns, they are all part of the area of Hemet!!!! Then they show Hemet #4……..Get your facts right, the only crime is this article giving bogus info!!!
I so agree! And I’m laughing because some are saying San Jacinto is so much better than Hemet? What is diffetence? The name and that is it.
Santa Monica is no longer the prestige place it once was.It has become too much like Long Beach the Home of the Homeless.
Complete BULL SHIT. Try walking the streets of San Bernardino, Compton, or South Central LA for just 10 min and you will see.
I don’t know where you found your information but it is so far off course it is unreal. Just a few example, to say Banning and Beaumont are safer than Palm Springs, Rancho Mirage,. To say Coachella is safer then those 4, is unreal. Where ever made this stupid article needs to do more research.
I don’t see Temecula anywhere on this list. I saw Temescal, but not Temecula, which now has over 100,000 residents, very low crime, great schools, great climate, wine country of SoCal, affordable housing, and about 1-1.5 hours to the beach, the desert or the big SoCal cities. I can’t believe this list. 🙂 🙂 I’ve lived in California almost my entire life (Baby Boomer) and, like so many others here, am just in amazement at the inaccuracies! Have been a real estate broker and lived in Northern, Central and Southern California. wowzers…..
Clearlake in the middle of nowhere??? I don’t think so!
It is a very nice place to both visit and live. It is closer to the Napa Valley, where I live, than Sacramento.
Lots of nice areas in and around CL.
Has this author ever spent any time in the areas he maligns ? I think not.
We recently moved from Los Gatos to Joshua Tree and could not be happier with our decision (although, in no way would I say that Joshua Tree should be ranked higher than Los Gatos on a list like this). Strangely enough, we have jobs and more than enough to do. But to place Thousand Palms and Twentynine Palms over 100 spots higher than Joshua Tree, Yucca Valley, and Palm Springs is total nonsense. Really, I just don’t understand why unincorporated parts of California are even on this list.
You want to make love to the CEO of Del Taco. We get it.
Call their corporate office and make it happen.
The writer is stupid. Southern Cali is like living in the Holy land. Beautiful ! Who doesn’t love the desert?
Cali is in Colombia. This is called California.
YES!
Thought we trained people to sto saying Cali in the 1970s.
It’s California Damnit
Why is Pomona, CA not on the list? Why the good folks of Pomona moved to Hemet, Moreno Valley, Victorville and Temecula, CA?
I know right? Seriously they could have compiled this list just within the Inland Empire.
Wrong about Foster City (which is in San Mateo County) along with San Carlos, Belmont, San Mateo, all in San Mateo County. These are old little towns that have been taken over by folks from Mexico. Mass immigration of wealthy white people out and mass immigration of poor people from Mexico in. No. California is much prettier than So. Cal. I was shocked when I went to So. Cal. to see no trees, dried up hills with scrub brush out in Agoura Hills and Calabasas. Soooo ugly compared to San Francisco, Santa Cruz. Most beautiful place on earth is the redwood forests. So. Cal. IS ugly.
I live in the redwoods, but I miss SoCal. If you can’t find beauty in SoCal you have not looked in the right place, which are plentiful, and you are REALLY missing out. (Not Cali, no such place in the US).
This is pure bullshit. This list is random as hell and has no meaning at all.
(and no I’m not some city loyalist pissed about a ranking. I don’t care about that stuff. I just can tell the list is totally random)
How Lame. Lucerne Valley is where I go to relax and find something good to eat at a non corporate eatery. It also has one of the most beautiful parks I have yet to behold. Certainly not worth such a dis by amateurs. Pfft. We live in rural Apple Valley in a newer 1800 sq ft home on 2 acres for under 150k and it is beautiful with all of the amenities we could want no more than 15 minutes away. This coming from a long time resident of snotty La Verne and our house payment with taxes and ins included is HALF of what we paid for rent in La Verne!
You obviously have never been to Joshua Tree because it is a big tourist destination for people. So when you say no one visits the desert you are quite wrong. And there is a very low crime rate there. This may be right for people wanting to live here but get your facts straight.
The town I live with in wasn’t even listed, and Bakersfield was ranked above 100!?!?!? WTF mate? There’s literally a shooting there almost every day! I kid you not.
There are pros and cons in both Socal and NorCal. Super biased and snobby post.
Lol! He mentioned Mendota but the smart guy leaves out all the surrounding towns which are basically no better. I’m from Dos Palos, California! That town is literally the worst town in California to live, but as a kid I swear I would not have wanted to grow up anywhere else in this world! We had a blast. But sadly as an adult, you either move to the Fresno area or you do meth. I chose to move to Fresno. West side til I die! Lol. I’m white but still; West side til I die!
Ps: and who eats at del taco? Are they still in business? Lol
Ps. Who tf eats del taco?
Chula Vista should be #1 most horrible place to live.
The elitist douche, that is the writer of this travesty, takes in the butt then licks the chocolaty goodness off the shaft. Kudos, f’tard.
asinine article…obviously you’ve never been to California
I happened to find this article while waiting to pick someone up in Hemet and take them back to Twentynine Palms, where I live. I am a native San Diegan. I happen to agree with everyone else about Joshua Tree it’s a pretty awesome desert town. Side note: Hemet is sketchy as hell. People just pop up from behind and through buildings.
Living in California since 1985;fife years in Anaheim apartment complex,bikes left outside stolen,home invasion,SS card stolen,car battery stolen(lost job).
Another five years in San Fernando valley,car parked on street vandalized,car tires punched (during LA riots),homeless found dead in dumpster,store gun and robbery,and finally ’94 January earthquake.
Another five years in LAGUNA NIGUEL (gated apartment complex):car burglary,gate remote stolen,car
Impounded (permit tag was on floor),shattered windows on cars parked over night on streets ,moved to
Condominium,gated community,finally safe place,ASSOC.penalty was $145(1998),retired 2014 ,today 2026 ass.$400 1/2 of my SOC.SEC.benefits,start searching for p/t job,if I can find at 75 y.old.GOD BLESS
GOOD PEOPLE OF THIS LAND ,wich I’ve been told by Latino coworkers was stolen and hopefully will be back to them…WATCH “CALEXIT” 2018 referendum.
Mike, I really feel for you and wish you all the best finding a job. If there’s anything that frightens me, it’s the thought of growing old on a fixed income and not being able to control for my cost of living because I am still beholden to “rent creep”, steep HOA fees and the like. And then, of course, there’s the fact that living in an apartment tends to mean a lot more hassles with thefts, pests, landlords who routinely refuse to return deposits no matter how well you keep the place up, noise issues associated with common walls and mold issues due to the complexity and age of the plumbing in multi-family units. In short, being a life-long renter is my nightmare for the reasons you described. Unfortunately, it’s the people who can least afford to rent who are often told by society that renting is the financially responsible thing to do.
There is a long-running belief, especially among wealthy homeowners who have no recent experience as a renter, that endeavoring to buy a home is only appropriate for married couples with kids (who need the space) or those who have a lot of money. The assumption has been for so many years that singles, childless couples and those who have mid- to low incomes don’t really need to aspire to home ownership. But that attitude fails to account for the fact that the gap between paying rent on an apartment and a mortgage on a similar-size home is narrowing due to the affordable housing shortage in California. The belief that it’s more appropriate to rent vs. own also fails to account for the reality that there may not be a significant cost savings for a family that rents, say, a three bedroom apartment vs. owning a three-bedroom home.
I once read that the average net worth of a renter is only about $5K vs. $200K for a homeowner. Those who understand this are willing to go the distance — to the lesser-expensive outlying communities — for a chance to own vs. rent. As an example, I know a gal who bought a home in Yucca Valley in 2003 for $85K and that home is worth almost double now even though it is still considered “cheap” by LA/OC standards. She moved out to the “boonies” when her friends were still busy renting in the overpriced LA/OC suburbs and paid off a small home before she hit retirement age. When she retires she won’t have to worry about HOAs or rents so high that she’s forced to pack up and leave every couple years for increasingly undesirable locations. Because she is a homeowner, she can put down roots in her community and keep her new friends nearby. Years-long renters often move so many times that they are no longer in close proximity to friends/family who are more centrally located to jobs, beaches or other desirable locations.
For the contingent of people who insist that it is more “responsible” to rent because one is moderate or low income, I would say it’s just the opposite. If rental inflation doesn’t get the better of you while you’re still working, it most definitely will once you retire and rely on a fixed income. So while it is initially cheaper to rent, in the long run it’s cheaper to own. Why some people, ironically those who are homeowners, tend to think that the “grass is greener” renting is rather an odd phenomena. Yes, you don’t have the home maintenance. But if/when your landlord gets around to upgrading your kitchen or fixing your broken plumbing, he/she will renew your lease at a higher rate. So yes, you DID pay for that maintenance. There’s no free lunch!
In my view, long-term renting is a lose-lose scenario, with HOAs/condos not far behind. This helps explain why so many people are willing to relocate to outlying regions in search of housing they can own even if it means hours-long commutes into work on California’s over-congested highways.
PS:CORRECION READ 2016 INSTEAD 2026!
you should delete this article as you clearly can’t differentiate vacation towns from urban environments and expect vacancy and employment to equate to quality.
It’s a huge oversight to put places like Desert Hot Springs ahead of Palmdale and Lancaster, which by some oddball oversight don’t even make the list. Desert Hot Springs doesn’t make sense ranking ahead of places like Mentone, Yucca Valley, etc. Places like San Jacinto and Hemet, as well as other parts of the Inland Empire, were originally developed as a retirement communities and snowbird destinations. Beyond that, some people like rural areas with less population density so the fact that an area has fewer amenities — which in the suburban sprawl that is SoCal usually means wall-to-wall strip malls and miles of asphalt — doesn’t mean it’s not a desirable place to live (people who live there may prefer to own horses, raise chickens or just enjoy the wildlife and rural surroundings). In addition, some of the locations mentioned are very close to the mountains and nature preserves, such as Joshua Tree, that are destinations for outdoor enthusiasts, birders and vacationers. To use low population density to determine that a place is undesirable doesn’t really add up.
to the John Reinhardt and fillmore. cbs anchor woman Cindy Hsu recently got involved in dirty coraption business with infamous cbs anchor Otis Livingston to steal money from fillmore’s employees bank accounts never trust Cindy Hsu and Otis Livingston they nothing but problems makers and need to be arrested!!!!!!!!!!!!!!!!!
I have lived in wasco for 80 years and though it might not be the best place in the u.s.i seemed to have always made it here. My dad built a new house here in Wasco in 1928 and it is still there. It never feel down in the 52 earth quake. I have lived in the same house for 56 years and it is paid off. I block from out beautiful high school. Which has one of the nicest auditoriums in all of calif.
As others have commented, this list is very flawed if Trona isn’t on it, let alone at the top of the list. I suggest the writer, in the interest of balanced journalism, go there for just a day, rather than just looking at spreadsheets, and see if they don’t agree.
here is the big problem with your stats… in citys like wasco calipatria taft avenal adelanto shafter, you are getting data from people in those citys that are in big jails and prisons…so the number of people living there without jobs and living in that city show a higher percapita percentage than what is actually going on…your data should be re-evaulated
Many of the people commenting need to read the introduction (before the list.) The writer did not ask people on the streets, to determin this list, nor did the writer go to each city. The list is scientifically determined, using records such as the United States Census. Really, before commenting & sounding illiterate, uneducated or too lazy to read, READ THE ARTICLE, not just the list!
“For those who are familiar with this desert city in Riverside County, is might not be much of a surprise, considering it’s a hot, empty place with nothing to do.” Proofread much? What does a tumbleweed smell like? Science would suggest that it has little to no smell in light of its aromatic VOCs (* science) being cooked off. And then to choose Mexican food as the other predominant scent, alongside comments having to do with the homeless. Science would suggest that you’re not of hispanic descent. Science would also point out your ride on top kayak and infer that your a self-important causasian whose comfort zones are behind a computer monitor, on top of a plastic water craft and nowhere near “Mexicans.” Further, incomes are relative to one’s mortgage/rent and the subsequent, local cost of living. You took two low numbers and suggested that they were piss poor versus ex. Los Angeles(?) LA is dense (* which, among many things, leads to near homicidal traffic conditions) and yes, a DHS income wouldn’t get you a parking spot much less a home in LA, but is dense, loud and ‘aggressive’ the environment we should all aspire to? Where would we possibly store all of our plastic watercraft? DHS has its problems and this city a stones throw from the art, culture and abundant resources of Palm Springs (* including an International Airport and myriad live music and theater venues) is by no means a winner on all counts, but you’d do well to look within before you draw up your next deeply biased list and consider that a night spent beneath a nearly infinite blanket of glistening stars, while warm winds pass over you with only the faint sound of coyotes in the nearby national park might, just might, be as valuable to some as penning an inane and suspiciously myopic list atop a plastic boat somewhere in North Carolina. Hint: When drawing up your next list, I’d suggest you look into a) DHS municipal water quality (+ the value of thermal springs – for body, mind and the local tourist economy) b) the influx of cannabis grow faclities etc investment dollars (* several million and growing – pun intended), c) lowering solar technology cost and the ability to offset half or more of your energy bills, including feeding into the grid, d) access to 9 casinos and the national/international performers they attract, e) the Salton Sea is 45 mins away… you can launch your boat and reflect on a place that might truly be deserving of a low ranking and our collective, truly humble sympathies.
I’ve done a lot of traveling for work and have truly stayed in the worst areas of California, born Moreno valley Riverside county, raised nor*Cal Solano county currently living East bay Antioch.
Who the does this writer think they are most of these places like clear lake are Indian reservation (native land) so of course it may not seem like there’s jobs or its rundown but believe me places like Richmond, Stockton, Tracy, Vallejo, San Berna-ghetto East LA THESE should definitely be the top 10 dumbass!
Good one Very funny!!!
I agree, in part, with most of the list as undesirable cities to live in. With Calif being one of the more desirable states in which to live, even the least desirable city here may be better than a most desirable city in another state with terrible humidity and extreme freezing most of the year. I live in Hemet and, though it has it issues, I feel much safer walking these streets than I would those of Los Angeles or even Santa Ana. One of the things that tends to bring values and desirability down is a large homeless population, as it tends to add the element of property crimes or even personal crime, however, the homeless tend to gather in places with a more temperate climate and plenty of resources to beg for or get money and to be safe enough to live on the street and not be murdered or assaulted. Being that I was homeless for about two years here due to unforeseen circumstances, I can say the majority of this population watch out for one another, though you can count on having your things stolen if not bolted down, especially if easily cashed in (bicycles and cell phones are subject to thievery more often than not). One man’s trash is another’s treasure, as we know, so I don’t take it personally, it is what it is folks!
Having lived in Clearlake I can say I agree with this list. It says the data doesn’t take into account friendliness of the people but I can attest that Clearlake us full of the most god awful self centered people that literally live in their own filth. It’s a disgusting place with dead cats literally everywhere, not one single quite moment since everyone’s to stupid to train a dog, gun shots in town all the time, numerous people break the law to own roosters(like could you find a stupider law to break), unpaved roads so you can’t get mail at your own house, 3 week long tweaker parties, only crap food and the joke of a health food store is run by the most negative, obese woman on the planet. I just can’t even count the number of ways this is a garbage town. It is no surprise this county is always on fire, the universe is trying to cleanse the area and start fresh. Maybe if all the garbage people scatter elsewhere this beautiful area can repopulate with decent people. The number one issue with this area is these people lack the intelligence, self respect and good work ethic needed to be a happy and productive member of society. I’ve lived in 9 towns in California and traveled all over the west coast and never experienced anything like this town and I won’t even stop here for gas after I escape.
People in Clearlake are unemployed because they are weed rich. People just laying around, high and rich as hell, on their dirt roads fishing on the second best bass lake in the USA. Eating real tacos. Sounds horrible.
pretty much a bunch of lies about desert hot springs. its a GREAT place to live and now that we’ve had our mayor and chief of police in control the last 2 years, its a great place to live. i suggest whoever wrote this article stop smoking crack and do some real research, crime in DHS is down more than 30% – palms springs has a much higher crime rate. yes were still a rather poor town, BUT the tax revenue from the cannabis companies is already flowing into our town. i will admit though, its a dreary place as far as eating out is concerned. but i wouldnt live anywhere else in the valley. then again, its a HORRIBLE place to live! DONT move here! i dont want to be flooded with hipsters and the bougie set! lol
Yes it’s true Clearlake takes the cake. Konocti Harbor closed and 700+ people lost their jobs and tourism disappeared along with the money. Then all the fires that ripped through here forced people to move away, along with their money. Then all the cannabis friendly hippies got chased out of here taking their money away from here. You would never want to own a business here, because every business has been broken into, via vehicle into front doors of business. Your best bet is to open a nice Bail Bondsman office as you will always have work and make tons of money. Crime is out of control because they used to parole felons here and then, they had kids, and raised them to also commit crime just like their mommy and daddy. How adorable is that? When the lovely full grown offspring and it’s family are trying to pull a home invasion on you, never, and i mean NEVER, bother calling 911 because the line might be busy for numerous hours. If they do pick up your emergency call, a sheriff would then show up at your house 2 hours later just to take a incident report, that is, if you’re even alive. If you didn’t own guns before you moved here, trust me, you will be needing them. The meth, need i say more? Oh, by the way there is actually a hilarious tweeker facebook page for this fine county. So, lets go over this together, extremely high crime, violent crime, home invasions, robberies, etc., no rentals, fires every year, bad economy, no jobs, terrible county management, cops that don’t do anything about crime, closing fire departments because the supervisors neglected to tell people they f@cked up. I could literally go on forever. Also, I neglected to mention the actual lake that is called “clearlake” is not clear at all. It’s warm and soupy, and it smells. Oh yes one more thing, there are 4 HUGE dormant volcanoes! And all of our lovely homes are scattered right at the base of them, the ones that didn’t fall into the sinkhole that is. I guess I will also add, very bad planning. People please never move to a place where the locals call the hospital “Deadbud” and it’s actually Redbud. I don’t think I need to elaborate on that one. Tell everyone you know to never move to Clearlake because it is comparable to hell.
I have lived all over northern and southern California. I now live in Desert Hot Springs. Desert Hot Springs is a retirement community on the outskirts of Palm Springs. It is beautiful and quiet here. It is 20 minutes from all of the amenities of Palm Springs with no congestion. The surrounding mountains are beautiful. The air quality is amazingly good. I go to downtown Desert Hot Springs every day where all of this crime supposedly is. Everyone is unfailingly pleasant, including the few who are homeless, and those supposedly on drugs and dangerous. I find these rankings are often based on demographics, in this case primarily lower income Hispanic, instead of how pleasant the town actually is.
Laura i totally agree, the person who wrote this article is skewed. They seem to think paying a lot of money for a home is a positive..i call it a negative! The author never takes into account the quality of life even if income is less, is often better here.
Clean air, beautiful weather, nicer neighbors, affordable property values, beautiful lakes with space to live, etc.
Folks, the author says at the very start that this list is for entertainment purposes. That being said, I believe almost every town in the Imperial Valley should dominate the list. Ever been to Calipatria……or Niland?
I think you really need to move Victorville to the top of the list.
I have lived in the High Desert now for over 20 years and just in that time the high desert has got really, really bad. Every since the closing of George Air Force base in the 1992 and then the housing boom and then the housing crash crime has increased a great deal every year.
Victorville has several nick names, Victimville, Crimeville and my favorite Tweekerville.
I work in Victorville at night and I have seen over the years tons of criminal activity. Druggies everywhere up and down the streets breaking into cars, taking everything they can from the back of pickup trucks or any open door to a business they can find.
I have caught druggies on the steps of our business shooting up heroin or whatever.
Not too mention the large amount of people who don’t carry valid physical IDs.
They try to use credit cards with either no ID or fake IDs or trying to use copies of IDs on their smart phone or a photo copy of an ID, and all of these so called IDs can be crated online. Lot of fraud up here in the HD.
The quality of a lot of the people who now live here are very ghetto, just in the last few year increase of total face and body tattoos on men and women is incredible.
I would say 4 or 5 years ago I never seen anyone with a tattoo covering their entire face and now its becoming very common up here.
This along with the increase in crime is most likely due to the large amount of Prisons we now have up here in the HD with more on the way. When you have prisons, family members move up to be close to the prison and many times they also bring up more crime.
Then there is the homeless problem up here. Its is super bad! 7th street is nothing but homeless living up and down that street but it has spilled over to all the other cities even Apple Valley. There are little tent cities in a lot of the fields. You cant go into any store anymore without being approached by panhandlers.
And then there are the crazy drivers, we have car accident fatalities almost everyday it seems like. Just go to VVNG and read about all the car accidents everyday.
Its not The High Desert anymore, it’s The High Crime Desert now 🙁
You have no clue what you are talking about. Trying living in St. Helena! Can’t afford to live there, can’t shop there because the shops are for the tourists, traffic is a frickin’ nightmare and overall not a good place to live.
Not sure why those 2015 comments say the writer is biased & must be from Norcal. As someone mentioned -read how the information is compiled & how the final outcomes are based on facts, figures & calculations. So many comments sound so butt hurt but I suppose if you love your places so dearly-that’s enough & nobody is going to change those feelings-nor should they. Besides, what are you all whining about-I live in #1 Worst-Clearlake & sadly, unable to really disagree or call out the author on this outcome. (BTW- I noticed the company is based in No. Carolina so doubt there could be a bias were that a real issue. I read a few comments that spoke of Clearlake in very lovely descriptions & for those who don’t like it here -to just leave.Well, if it were that easy I’m. sure many folks would gladly do so, I know I would. In regards to all the unpaved roads & most of these meandering dirt roads aren’t lit- street lights are minimal & in the nicer areas that have paved roads. A new transit bus driver who moved here from out of state to care for hos elderly parents said he’d never seen a place with so many dark roads everywhere. Out of curiosity I always ask these younger “newbies” (30’s-40’s) to Clearlake from put of county or state, how/why they picked Clearlake? I will tell you the majority of the time-it wasn’t a personal choice or dream to relocate to the poorest county & worst city to live in California-95% of the responses were= an obligation to a family member, relative, friend or acquaintance- most were to care for elderly parent(s), death in family, sick relatives etc. not a “choice” but some resulting in lengthy stays -unexpected long term commitments. The person who mentioned if someone doesn’t like the dirt roads, vote for improvements. Perhaps a lapse of memory caused the writer to forget-this bill came around I believe 3x & the 1st & 2nd times the residents voted in that bill & the increased taxes if it meant those funds would be used towards the purpose intended. Somehow the funds- both times on ballot-voted in for approval by residents-got diverted elsewhere. When the 3rd time around on the ballot included this tax increase-residents were apprehensive & those City staff responsible for allocation of the prior approved funding that never happened-knew it would be a hard sell. In light of this problematic situation-the signs posted all over town stated, in essence, Please vote yes on road improvement bill-the funds WILL REALLY- go to road improvements! Emphasis was in bold print & stand out from everything else printed as if to say: “yeah, we promise we’ll do right by you this time”. Surprisingly but sad reality of road conditions & desperation, Yes votes got it approved. One road was created & one widened & paved near “Deadbud” (Redbud aka: St.Helena) Hospital. That was completed 2018 I believe. A nshort, narrow winding road from Main road down to Post Office in Clearlake Park area & recently, in front of City Hall -Police Dept. -widening bike lane or sidewalks or something of that nature-short stint. An arterial light was put in on Hwy. 53. However- the areas in the Avenues-many rambling dirt, rutted roads-are still in bad & worsening conditions. The author loves Clearlake & that’s certainly awesome – I would guess the residence of this person may be in an established, decent area-there are a few areas-scattered around that can be liveable places but the rest of areas are borderline ghettos, drugs & crime rampant & if you have the opportunity to chat with a recently released person incarcerated in the Lake County jail-regardless of their actual location of residence-they have this known saying: “Come here on vacation-leave on probation”. The lake is gross, unless desperate for food, never eat fish out of Clearlake. Every year -beginning of summer-I can’t recall for sure the agency or dept in Lakeport, maybe Sheriff’s office- they run a lengthy oratory about all the cautions to take if you decide to swim in lake or pets enter lake-how to immediately rinse dogs off, what to do if a rash develops- on & on & when you should seek medical attention. Then the speech ends by saying: ” Have a great summer!” It’s disturbing. I won’t even let my water loving lab swim in the lake. It truly sucks when you experience days of 100 degrees & over in the summer with this giant lake a few blocks away but dare not access it. If there’s a beach for entry watch out for the leftovers scattered on the sand-garbage, cups, toothpaste, soap, dirty dishes & the ever wonderful syringes. The significant homeless population have been kicked out of the variety of places-in hills & orchards, behind stores & given no alternatives- short or long term The city went so far as to place some type of barrier on the few bus benches that makes stretching out impossible & any attempt to sleep or rest prone totally eliminated. No homeless shelters available that I am aware of when last I asked several months ago when a person asked if I knew of any in area. I had no choice but to end up here & have wanted to move since arriving 5+years ago. It’s true, every place has issues- however-unfortunately the “main” Street thru town once was a strip of restaurants, shops, motels, variety of businesses when once this was considered a summer resort destination -but the condition of the lake & the arrival of Wal Mart basically drove out the small businesses which continues to be noticed as more small shops close or are red tagged- some have been demoed, other vacant & boarded up- attracting gang graffiti & vandalism. A walk down Lakeshore Dr. gives off a subtle feeling of doom as building after building are empty, vacated sometime ago. Other than the famous bass tournaments- it’s unclear whether anyone would have a reason to come here other than visiting friends or family. Lack of affordable housing is a serious problem since the last destructive wildfires causing shortages of affordable rentals with some home owners deciding to leave the area rather than rebuild..The rentals that might be available have escalated in price as a result of supply vs. demand. The exploitation of tragic losses in a desperate market became the slum lords dream come true. In addition to the obvious disregard of human life-in the “profit over people” mindset-lack of any significant oversight by Code Enforcement to investigate basic Building & Safety Standards leaves a population vulnerable, living in below standard housing conditions -sometimes hazardous & dangerous. It appears these substandard properties have been bought up by out of town businesses &/or private parties, multiple cheap properties- either red tagged, abandoned or condemned, invest little or no money other than paint &/or flooring or windows, all cosmetic to provide minimal eye candy to potential renter. Not until moved into these places can one learn of the many hazards & non-functioning, non-existent minimal requirements as per California Housing Standards, Civil & Health & Safety Codes. Really disappointing is the fact that it is legal in California for a landlord , as a condition of application approval-require a renter to maintain Renter’s Liability Insurance Coverage & provide proof of the policy upon move -in. This isn’t the Standard Renters Insurance that protects any loss of personal property within the rental while the renter inhabits it. Forcing a renter to acquire Liability coverage means the renter takes on all responsibility & liability for any accident or hazardous condition that causes renter &/or family, friends, visitors etc.harm or death. This intentionally leaves a landlord carrying property (structure only) coverage should the rental be destroyed., REGARDLESS if it’s determined the accident was due to a failure on behalf of the landlord/owner to test all electrical outlets, plumbing fixtures, GFCI’S, smoke alarms, truth in Rental disclosure documents & to correct/repair any faulty, non-functioning items. By requiring this type of insurance coverage,, the landlord can avoid doing any necessary repairs, zero costs to elevate the rental to basic living requirements-knowing even if the potential hazardous conditions could result in death, no worries & the structure coverage carried by landlord likely far exceeds the value of these dilapidated buildings-turned into substandard rentals. It is clearly a landlord’s dream playground to collect a bunch of uninhabitable buildings, throw some paint- maybe some discount flooring, no worries about outdated, frayed electrical wiring, main%exterior doors w/out functioning locks, interior doors can’t close, no venting or fans, plumbing problems- ( no inspections by Code Enforcement even if renters file complaints), advertise for a ridiculous rent plus deposits that will never be returned regardless the rental is in better condition & functioning order plus cleaner than at time of move in. Rentals in Clearlake/Lake County have become an investment racket by wealthy city investors offered to unsuspecting renters that play hell in attempts to have landlords correct obvious, basic problems-knowing some renters get frustrated enough with the lack of response/repairs-they will do themselves-yet another tactic slum lords adopt to avoid the labor &/or materials-unless a renter informs a plan to “repair & deduct” -keep all receipts-this is a renters right in California-one of very few available to a renter- contrary to the leniency offered the landlord/properry owner.
This adds to a bleak, run down environment lending to deteriorating buildings, abandoned cars, massive litter dumps on empty lots, neglected domestic animals running the streets and..since all the massive wildfires having devastated the surrounding wilderness & wildlife habitats the past years-wildlife has been spotted & observed in bizarre, unusual, people busy places & busy downtown streets-bears swimming across lake, disoriented & hungry, entering inhabited parking lots, trailer parks, residential back yards-terrified & lost -intimidated escape wherever possible. Bobcat & Mountain Lions appearing suddenly in roadways-dangerous for the animal & vehicle occupants causing traffic accidents & injured/dead wildlife. I in conclusion- I found Lake County holds the
#1 Poorest COUNTY in California.
Of the top 10 picks out of over 400 cities in California=
Clearlake reigns in as ranking -#1- Worst City to Live in.
#4- Poorest City to Live in.
#9 -Most Dangerous City to Live.
in State of California. 2019.
Overall, the review seems pretty darn accurate to me. Oh yeah, don’t trust people too quickly in efforts to seem friendly-a weak spot will make a target out of you. Don’t be desperate to make friends/acquaintances, do not reveal anything of yourself other than that which will gain the expected end result. Yes, the place oozes text book sociopaths who have no issue befriending u & maybe next day betray u or just throw u under the next bus -dispose of ur existence once satisfied ur soul has been crushed- run don’t walk & never look back.
I also have one goal-to escape Clearlake ASAP-however I it’s going on 6 years & I’m becoming concerned but will keep on keeping on. If there is an alternative. to a life existence in Clearlake-I encourage anyone to look elsewhere.
I live in one of the cities labeled as one of the worst. I moved from Orange County, Aliso Viejo, which is 3 miles from Laguna Beach. I did this because while the area of Aliso Viejo is pretty, it was packed with congested freeways, angry drivers, unfriendly neighbors. I lived in Orange and Aliso Viejo for 50 years ( i was born in Orange). I was a victim of 3 burglaries in that time, and i lived 5 doors away from a sex offender, i even caught and chased one away from a boys window next to my condo unit (not the same man as my neighbor).
When i decided to move out of O.C. for reasons of semi retirement and fantastic buyer market property values in 2010 i took advantage of buying an affordable home and get out of my beautiful but tiny 890 sf condo to buy a 2100 sf home with a large yard for my dog. My new home felt and still feels like a spacious mansion compared to my tiny condo. And i was able to buy it for $100,000 less than what i sold my tiny condo for!
If i had no family in CA i would have moved out of CA to an area with more rainfall, but inland SoCal is dry, arid, desert like, but does have MANY MANY lakes where i moved.
Bottom line is…Yes my new area has more homeless/drug addict/mentally ill persons who cause more crime here, but i have not been burgled here ever (11 years here now). Also, Yes this area is a poor choice for work opportunities…there simply are no real manufacturing companies here nor office jobs. You won’t find a night life out here but as i said i’m semi retired , no one wan’ts to see a 60+ yr old bar hopper right?
Remember..this area is really more a retirement area than anything else.
So what is GOOD about my “bad” city?
Beautiful weather 10 months out of the year, clean air, lakes, hiking, neighbors are nicer, property is affordable, space for my dogs to run and play, what surprised me the most is even the cashiers and store clerks are helpful and actually look and talk to you like a human being rather than act like soulless robots like in O.C.
I am happy here in my “bad” city!
Lies, Vitorville is on of the best cities there is. Even though it might not have a lot of activities everybody is nice and polite and has one of the best middle and high schools in California. It is called University Preparatory. Is the 75th ranked overall nation wide. So stop putting lies about any of these towns! Byeeee.
The most relaxing place I have ever lived is in Clovis, California. I feel very safe. The neighborhood has a lot to do with it. Several of the people who own houses here are related. I can walk to the downtown area in about 20 minutes. There is a freeway on the ramp a block away. It is very quiet. There are very few children in the neighborhood.
There are two major shopping centers about 10 to 15 minutes from where I live. There is a great Mexican food restaurant a block away. I seldom see a police car.
There is a GREAT police Department in Clovis. There’s a brand new library!!! I have never loved a location more than where I am. Living in Clovis, CA, is a privilege. The traffic is all right around here. Downtown Clovis is vibrant, with great shops, safe, and friendly.