
Most Americans have never been to small town Michigan. However, as the Michigander who live there know, small town Michigan is an awesome place to call home.
But is it all roses? Definitely not. Just like any other state, Michigan has its trouble spots. This article aims to determine, using Saturday Night Science, the absolute worst small towns to live in the Wolverine State. Don’t freak out, we will use data to show which places have high crime, poverty, and unemployment.
After analyzing more than 252 of Michigan’s smallest cities, we came up with this list as the 10 worst small towns in Michigan where you’d never want to live:
Table Of Contents: Top Ten | Methodology | Summary | Table
These are the worst small towns in Michigan for 2025:
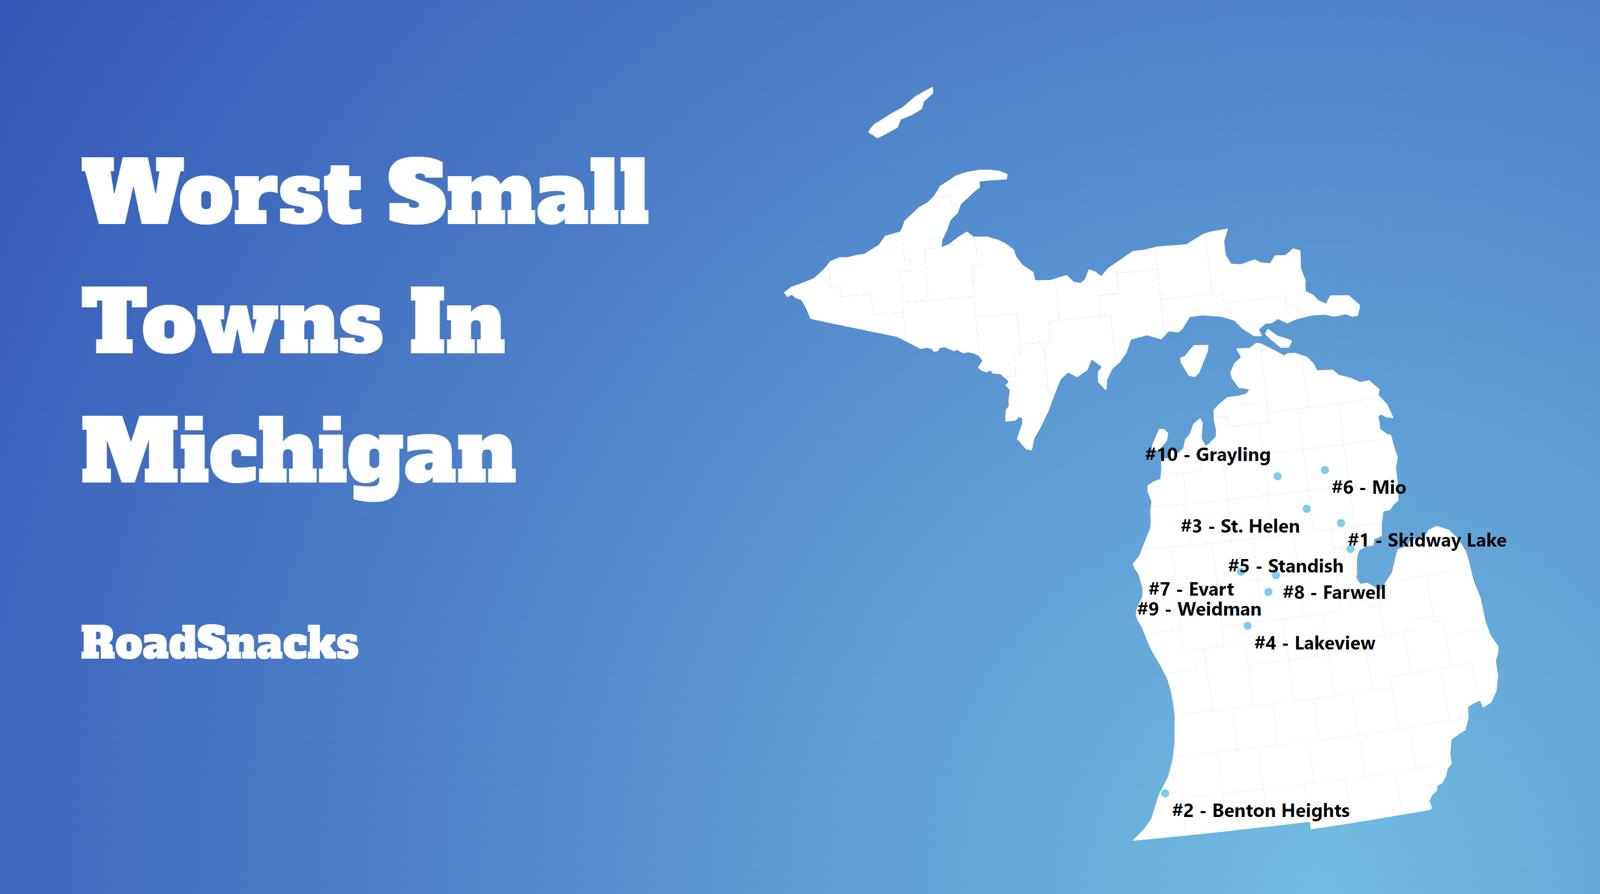
So what is the worst small town to call home in Michigan for 2025? According to the most recent census data, Skidway Lake is the worst small town to live in Michigan.
While many of these small towns have seen better days, they have wonderful communities and people. This report in no way means to knock the folks that call towns like Skidway Lake home. Everyone
Read on below to see how we crunched the numbers, or scroll to the bottom to see how your town ranked.
And if you already know about the small towns, check out the best places to live in Michigan or the worst places to live in Michigan.
If you’re looking for something more national, check out the worst cities in America or the worst states in America.
The 10 Worst Small Towns In Michigan For 2025
1. Skidway Lake
/10
Population: 2,800
Median Home Value: $53,700
Median Income: $34,320
Unemployment Rate: 16.7%
2. Weidman
/10
Population: 1,217
Median Home Value: $104,200
Median Income: $49,545
Unemployment Rate: 8.1%
3. Lawrence
Population: 1,186
Median Home Value: $106,700
Median Income: $36,188
Unemployment Rate: 9.8%
4. Standish
/10
Population: 1,616
Median Home Value: $86,000
Median Income: $35,114
Unemployment Rate: 9.1%
5. Lakeview
Population: 1,049
Median Home Value: $152,900
Median Income: $30,865
Unemployment Rate: 21.5%
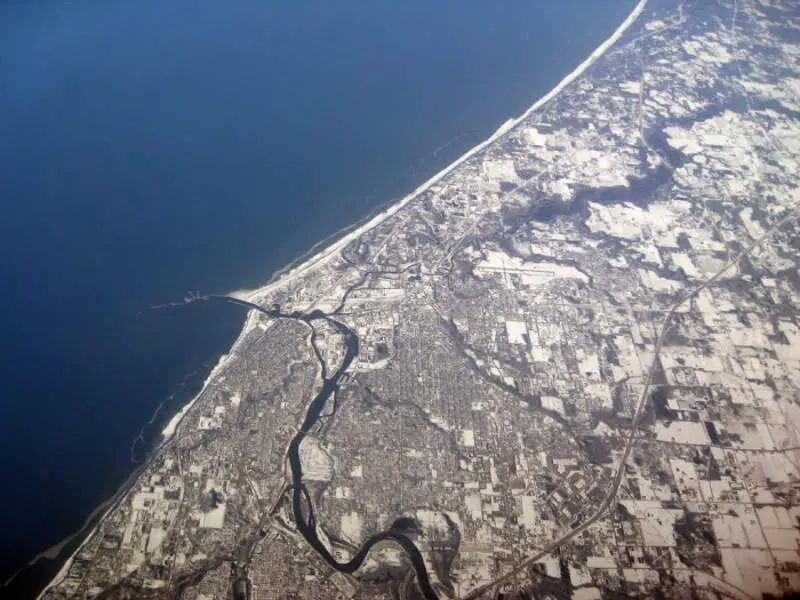
6. Benton Heights
/10
Population: 3,572
Median Home Value: $87,500
Median Income: $33,871
Unemployment Rate: 5.6%
7. Cheboygan
/10
Population: 4,801
Median Home Value: $118,700
Median Income: $41,338
Unemployment Rate: 9.9%
8. St. Helen
/10
Population: 2,841
Median Home Value: $85,300
Median Income: $42,091
Unemployment Rate: 7.5%
9. Evart
/10
Population: 1,764
Median Home Value: $99,400
Median Income: $34,091
Unemployment Rate: 9.0%
10. Reading
Population: 1,241
Median Home Value: $103,300
Median Income: $48,804
Unemployment Rate: 6.0%
Methodology: How do you decide if a small place in Michigan is lousy or not?
To rank the worst small towns to live in Michigan, we had to determine what criteria people like or dislike about a place. Assuming that people like low crime, solid education, things to do, and a stable economy isn’t a stretch.
We then analyzed the criteria using Saturday Night Science, the thinking you’d use at a bar. It seems like even your crazy Uncle would agree that a town with high crime is worse than a town with low crime; all else the same.
Using FBI crime data and the Census’s 2019-2023 American Community Survey, this is the criteria we used:
- Population Density (The lower, the worse)
- Highest Unemployment Rates
- Low housing costs (meaning there’s no demand)
- Adjusted Median Income (Median income adjusted for the cost of living)
- Education (Number of high school dropouts)
- High Crime
We looked at cities with populations between 1,000 and 5,000 people, of which there were many – 252 to be exact.
We get the crime numbers from the FBI, which gets them from the cities. Dropout numbers are based on the adult population, not just the current graduation rates of teenagers.
We base all our research on facts, which is meant as infotainment. We updated this article for 2025, which is our tenth time ranking the worst small places to live in Michigan.
There You Have It – The Worst Small Towns In Michigan
If you’re analyzing teeny places in the Wolverine State with the worst economic situations, where there’s high crime and there’s not a lot to do, this is an accurate list.
The worst small towns in Michigan are Skidway Lake, Weidman, Lawrence, Standish, Lakeview, Benton Heights, Cheboygan, St. Helen, Evart, and Reading.
If you’re curious enough, here are the best small towns to live in Michigan, according to science:
- South Gull Lake (Pop. 2,145)
- Village of Grosse Pointe Shores (Pop. 2,589)
- Sylvan Lake (Pop. 1,672)
For more Michigan reading, check out:
Worst Small Towns In Michigan
| Rank | Town | Population | Unemployment Rate | Home Value | Median Income |
|---|---|---|---|---|---|
| 1 | Skidway Lake | 2,800 | 16.7% | $53,700 | $34,320 |
| 2 | Weidman | 1,217 | 8.1% | $104,200 | $49,545 |
| 3 | Lawrence | 1,186 | 9.8% | $106,700 | $36,188 |
| 4 | Standish | 1,616 | 9.1% | $86,000 | $35,114 |
| 5 | Lakeview | 1,049 | 21.5% | $152,900 | $30,865 |
| 6 | Benton Heights | 3,572 | 5.6% | $87,500 | $33,871 |
| 7 | Cheboygan | 4,801 | 9.9% | $118,700 | $41,338 |
| 8 | St. Helen | 2,841 | 7.5% | $85,300 | $42,091 |
| 9 | Evart | 1,764 | 9.0% | $99,400 | $34,091 |
| 10 | Reading | 1,241 | 6.0% | $103,300 | $48,804 |
| 11 | Farwell | 1,086 | 5.3% | $95,800 | $40,667 |
| 12 | Caro | 4,284 | 11.7% | $102,200 | $41,940 |
| 13 | Cassopolis | 1,763 | 10.5% | $99,700 | $40,529 |
| 14 | Newaygo | 2,486 | 4.5% | $102,900 | $41,934 |
| 15 | Bangor | 2,113 | 10.0% | $106,800 | $50,714 |
| 16 | Stanton | 1,292 | 7.0% | $89,000 | $45,714 |
| 17 | Mio | 1,504 | 13.0% | $96,600 | $47,578 |
| 18 | Scottville | 1,359 | 4.9% | $120,400 | $47,955 |
| 19 | Reed City | 2,505 | 7.9% | $105,400 | $48,646 |
| 20 | Manistique | 2,844 | 6.6% | $83,600 | $39,761 |
| 21 | Grayling | 1,638 | 6.2% | $131,800 | $31,719 |
| 22 | Deckerville | 1,057 | 10.5% | $81,900 | $59,375 |
| 23 | Hartford | 2,312 | 8.2% | $95,200 | $39,868 |
| 24 | Mount Morris | 3,130 | 11.9% | $79,500 | $42,886 |
| 25 | Crystal Falls | 1,734 | 5.4% | $79,900 | $59,712 |
| 26 | Kalkaska | 2,370 | 4.6% | $121,300 | $42,955 |
| 27 | Baraga | 1,948 | 5.9% | $101,000 | $39,297 |
| 28 | Au Sable | 1,780 | 6.9% | $107,900 | $46,369 |
| 29 | Webberville | 1,339 | 8.3% | $154,900 | $52,879 |
| 30 | Iron River | 3,009 | 4.3% | $75,000 | $48,750 |
| 31 | Marlette | 1,771 | 10.7% | $116,900 | $44,375 |
| 32 | White Pigeon | 1,637 | 5.7% | $143,100 | $44,063 |
| 33 | Litchfield | 1,391 | 5.0% | $110,400 | $47,500 |
| 34 | North Branch | 1,199 | 7.3% | $121,400 | $42,500 |
| 35 | Harrison | 2,275 | 4.9% | $115,100 | $40,888 |
| 36 | West Monroe | 2,753 | 13.3% | $94,000 | $50,099 |
| 37 | Clare | 3,341 | 7.0% | $124,800 | $43,105 |
| 38 | Shelby | 2,571 | 5.7% | $124,000 | $53,309 |
| 39 | Colon | 1,432 | 5.9% | $123,700 | $53,750 |
| 40 | Wolf Lake | 4,802 | 11.6% | $99,800 | $49,005 |
| 41 | Decatur | 1,814 | 6.7% | $121,900 | $58,281 |
| 42 | Yale | 2,157 | 16.2% | $112,100 | $50,673 |
| 43 | Ontonagon | 1,266 | 7.5% | $92,100 | $46,806 |
| 44 | Brownlee Park | 2,037 | 0.7% | $73,200 | $31,653 |
| 45 | Constantine | 2,196 | 6.9% | $110,600 | $71,929 |
| 46 | Harbor Beach | 1,576 | 1.6% | $104,200 | $39,844 |
| 47 | Beaverton | 1,036 | 4.5% | $102,900 | $31,625 |
| 48 | Baldwin | 1,161 | 1.3% | $104,100 | $23,631 |
| 49 | Sebewaing | 1,921 | 6.1% | $94,800 | $50,779 |
| 50 | Gladwin | 3,081 | 8.6% | $111,700 | $43,638 |
| 51 | Edmore | 1,417 | 1.7% | $86,800 | $53,750 |
| 52 | Tawas City | 1,654 | 10.8% | $124,000 | $46,797 |
| 53 | Croswell | 2,667 | 8.9% | $136,500 | $55,101 |
| 54 | Montrose | 2,057 | 2.3% | $109,700 | $44,625 |
| 55 | East Tawas | 2,686 | 8.1% | $114,400 | $41,619 |
| 56 | Grant | 1,146 | 9.2% | $158,600 | $56,875 |
| 57 | Coleman | 1,147 | 5.5% | $88,300 | $41,458 |
| 58 | West Branch | 2,177 | 7.2% | $114,300 | $40,078 |
| 59 | Wakefield | 1,789 | 2.8% | $71,400 | $48,413 |
| 60 | Olivet | 1,633 | 14.1% | $137,300 | $44,940 |
| 61 | Hesperia | 1,007 | 4.3% | $121,300 | $44,271 |
| 62 | Galesburg | 2,122 | 7.1% | $104,100 | $50,481 |
| 63 | Howard City | 1,683 | 2.0% | $143,800 | $52,663 |
| 64 | Manton | 1,347 | 3.6% | $115,200 | $45,158 |
| 65 | Imlay City | 3,706 | 3.0% | $137,800 | $55,061 |
| 66 | Lake Linden | 1,042 | 11.3% | $93,200 | $42,961 |
| 67 | Paw Paw | 3,277 | 5.6% | $133,600 | $38,989 |
| 68 | Indian River | 2,210 | 3.8% | $218,000 | $60,750 |
| 69 | Morenci | 2,149 | 2.3% | $93,800 | $58,438 |
| 70 | Zilwaukee | 1,696 | 6.5% | $87,900 | $57,449 |
| 71 | Homer | 1,584 | 6.8% | $119,600 | $49,271 |
| 72 | Capac | 1,903 | 7.9% | $141,300 | $61,000 |
| 73 | Gwinn | 1,268 | 3.3% | $94,000 | $52,609 |
| 74 | Mancelona | 1,496 | 8.6% | $123,900 | $50,430 |
| 75 | White Cloud | 1,297 | 1.9% | $150,600 | $55,417 |
| 76 | St. Ignace | 2,409 | 2.2% | $127,800 | $60,735 |
| 77 | Hudson | 2,385 | 5.8% | $103,100 | $57,500 |
| 78 | St. Charles | 1,857 | 5.1% | $106,300 | $49,816 |
| 79 | Bad Axe | 3,010 | 5.4% | $106,700 | $47,535 |
| 80 | Norway | 2,835 | 2.2% | $87,300 | $50,025 |
| 81 | Lawton | 2,056 | 8.6% | $159,100 | $54,718 |
| 82 | Bessemer | 1,778 | 4.1% | $76,100 | $50,792 |
| 83 | Bronson | 2,183 | 2.3% | $93,900 | $46,607 |
| 84 | Newberry | 1,453 | 5.8% | $65,800 | $49,758 |
| 85 | Chesaning | 2,411 | 7.1% | $123,900 | $57,426 |
| 86 | Prudenville | 1,286 | 6.0% | $167,300 | $35,833 |
| 87 | Perry | 2,198 | 6.1% | $144,400 | $73,468 |
| 88 | Sand Lake | 1,214 | 3.2% | $139,300 | $49,615 |
| 89 | Millington | 1,151 | 2.2% | $117,700 | $56,339 |
| 90 | Rogers City | 2,873 | 3.1% | $93,500 | $47,601 |
| 91 | Memphis | 1,107 | 5.0% | $190,400 | $60,884 |
| 92 | Rapid City | 1,315 | 8.0% | $212,500 | $65,438 |
| 93 | Brown City | 1,211 | 9.3% | $121,400 | $60,357 |
| 94 | East Jordan | 1,776 | 2.1% | $125,100 | $53,929 |
| 95 | Fowlerville | 2,950 | 4.6% | $189,000 | $43,155 |
| 96 | Roscommon | 1,029 | 2.2% | $81,600 | $54,375 |
| 97 | L’anse | 1,916 | 8.2% | $100,100 | $55,042 |
| 98 | Hart | 1,931 | 4.0% | $119,700 | $55,066 |
| 99 | Munising | 1,907 | 6.4% | $112,300 | $54,375 |
| 100 | Fostoria | 1,081 | 14.5% | $140,400 | $95,491 |
I am in Onaway and Pellston 3-4 times per week, you are off base., Great places,,Great people and business climates. Scott D. Way
Wow, I am guessing you have never ventured into any of these towns. I adore Wolverine – the people, the Community, our schools, Library, parks, river – I could go on. I have lived there for 35 + years and have seen very little crime – and if it happens it’s an outsider 🙁
I happen to live in Onaway it’s not as bad as your making it out to be there are great neighbors where I live , yes I agree some places are rough looking and need to be cleaned up and yes there is A lot of druggies here but isn’t that the. Case everywhere just more noticeable in a small town! Get off your high horse look beyond your thinking
You’re an idiot. I love my “crummy” home town. I loved growing up out in wildwood and living across from the Sturgeon….I loved that we aren’t part of the “fast paced” stores aren’t open 24/7 and people don’t go a mile a min. I would trade Starke, FL for Wolverine MI any day of the week. Crime in wolverine is theft and robberies not being shot, stabbed or raped. Unlike most places, everyone knows you and you know them. Grow up Nick James and understand that you are insulting people and pthey love. Ignorance isn’t Bliss, that’s between Paradise & Hell. And if you don’t know what I mean by that, you need to not be writing about places in Michigan.
This list is way off. Even the town name, Robin Glen-Indiantown, is incorrect. Robin Glen is a mobile home park. Indiantown is the name of an old town that really no longer exists.
Funny that even though you have Onaway listed here, the boy’s basketball team just won regionals. Not bad for such a terrible little town. OH by the way, some very good people live there.
Just one boy? 😉
What a shame that these small communities have been given such a bum-rap. My husband and I worked and raised our family in Onaway, MI… Our city hall, from the city Manager, Mayor and Commissioner’s are college educated, business minded, and always put the people in the community first… There is absolutely nothing stupid about the business owners or the people of the community. Just because a town is small, doesn’t make the people village idiots! The Onaway schools are constantly planning, and working to prepare the young people for higher education… There are some great resources in Onaway. The ‘Michigan Works!’ office offers a variety of help for those seeking work or education. There are many other great attributes about Onaway, Michigan… To the person writing the negative, false information regarding small towns, you better do your research and know what you’re talking about. Use some wisdom before you speak out!!
Dont forget to include Moran and how he started an industrial arts school just so he could train the people of his community and make it a better place.
I bet those crime rates he claims are per capita. So with a lower population. One person could commit a crime and it would send the crime rate numbers thru the roof.
I think that is exactly right!
I grew up in Weidman and moved back several years ago. I love both the town and the people. People here do work. I believe I read something about unemployment? Perhaps there are not many employment opportunities in our small town, but we live near larger cities where there are. Most of my neighbors are working, in fact. And, something was mentioned about not being educated? If that was even the case, who cares? I have a post graduate degree and can tell you it makes no difference between me and any other person living in Weidman
What snobbish bores you are.
Nick James: Whittemore is one of the nicest places you would ever want to live.We have a beautiful School located in Ogemaw and Iosco Counties. We have more educated people here than you think. Did you even stop and talk to people or did you go to the Bar and received comments. There are lots of retired people in Whittemore who worked 40-50 years and deserve to be lazy. I noticed that you had Sand Lake on there, actually there is no town in Iosco County by the name of Sand Lake, it is National City. at least not in Iosco County.
I grew up in Whittemore, mi. People here do work. I believe I read something about unemployment? Perhaps there are not many employment opportunities in our small town, cuz it’s small. If there was more opportunites to work. We wouldn’t be that small town. but we live near cities where there are. Most of my neighbors are working, in fact. And, something was mentioned about not being educated? Just some people don’t want be educated.. but don’t hold against are small town and crime. Ya i believe that one.
My grandparents owned a bar in turner when it had a lot of people and stores a car dealer post office etc it was best time walking around there and now I can go back and it’s a total ghost town
You forgot Algonac and Clay, absolutely the worst crappy little towns.
Your population numbers do not reflect Census 2000, 2010, or the recent population estimates. If you are going to make money by crapping on places you have never been, at least use the right numbers. You are a bottom feeder.
Seems as though a lot of this is about crime, education, population, and lack of activities(being bored). Aside from crime that has nothing to do with whether it’s a nice place to live or not.
I’d take living in a small town any day over a city like New York, Chicago, or even smaller cities like Grand Rapids. I’d rather make my own activities and teach my kids than carting them around from soccer practice to band camp to dance lessons or whatever. And if you can make a living without a high school diploma, more power to you. That says nothing about whether you are a nice person and a good neighbor.
Bravo !!
I soooo agree!
I know most of the 100 towns. Many were lumbering towns that survived the lumber bust to become small agricultural towns, then became cabin / cottage destinations. Many are great summer locations.
the bust of the middleclass in Michigan with the loss of over 1,000,000 jobs since NAFTA was signed, has driven many small places over the brink.
Getting jobs in these towns is horribly hard for long term employment. People won’t leave unless times got so bad they have no choice.
I grew up in Whittemore as well.. Our High School was booming back then. We even had a band. My parents were employed as teachers there. Whittemore was a more booming town back then than it is now but it’s still not a bad town.. everyone knows just about everyone… Yes this is basically based on Crime and Education I think….you should take the time to go visit every one of these little towns 🙂 Love my hometown
I live in Onaway and you are way off! There are a lot of hard working men and women that live here. We have to drive 30 to 45 min to get to a decent sized town. Im educated and hold a professional license. My mother, a nurse, lives here. Onaway has crime just like every other place does but i generally feel safe taking a walk. Everybody knows everybody!
I don’t understand this ” author’s ” logic , since when dose a low population density and low cost housing make a town undesirable?
Onaway is ranked as being 6 away from the worst town to live in out of 148 small town comparisons? Have you even been to Onaway, Atlanta, Vanderbilt, Wolverine, Mio, or Rose City? In Onaway, we know who our neighbors are, and there’s a very strong sense of pride and community spirit unmatched Up North. I’m very happy to live in the same location that I can also take a vacation! Some of the finest people I know live in the area. Hey, Nick James; according to the latest facts, statistics, and data I could find sitting on my ass staring at my computer screen, you’re ranked 3rd worst columnist out of 300 comparisons. Your writing is the pits! These facts are for infotainment only; don’t freak out.
I feel the guy who wrote this article is snooty. He makes it sound like every person in these small towns are low-life scum. Just because a person didn’t finish high school does not mean they’re idiots. Do you really have to down those who are “uneducated” I’ve met people who have dropped out of high school and people who have attended college and received a bachelor degree, and I would have to say many of the people who have a higher educated are as dumb as a box of rocks. Higher education doesn’t mean you are smart or better. I have a masters degree making six figures, but never once looked down on a person without any higher education or high school education.
I live in Lakeview. and I agree it should be on the list. The town sucks, at least for me. And I’ll be happy to see it in my rear view mirror some day. At least the fiber optic internet by Casair is good, because there’s nothing else to do in this town. The major fashion statement around here is camo print on everything. And the ladies wear pink camo. And middle aged women either wear the “I want to talk to your manager” haircut, or the dreaded permed mullet. At least these local rednecks are friendly and know how to fix nearly everything. LOL