
Cities with highest divorce rate in California research summary. We used Saturday Night Science to analyze California’s most recent Census data to determine the divorce rate for each city in California based on the percentage of currently divorced residents. Here are the results of our analysis:
-
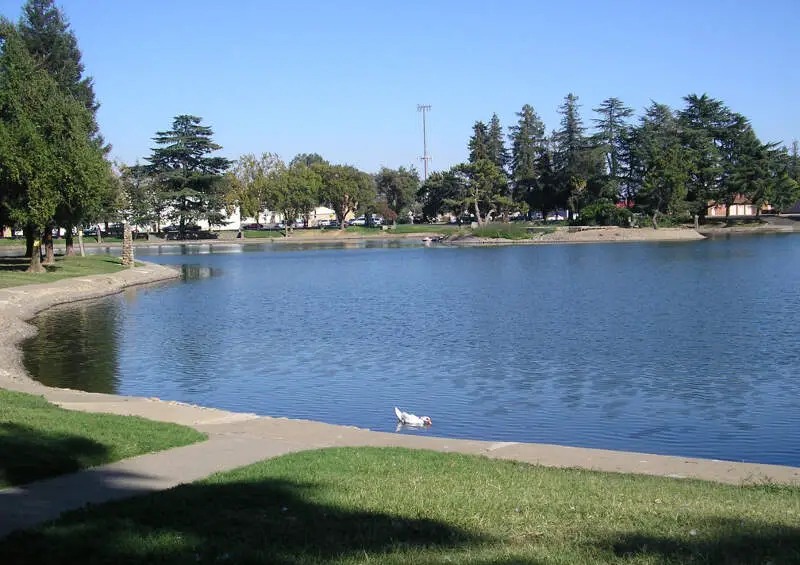
The city with the highest divorce rate in California is Marysville based on the most recent Census data.
-
Marysville is 14.0% Divorced.
-
The city with the lowest divorce rate in California is San Marino.
-
San Marino is 0.0% Divorced.
-
California is 4.0% Divorced.
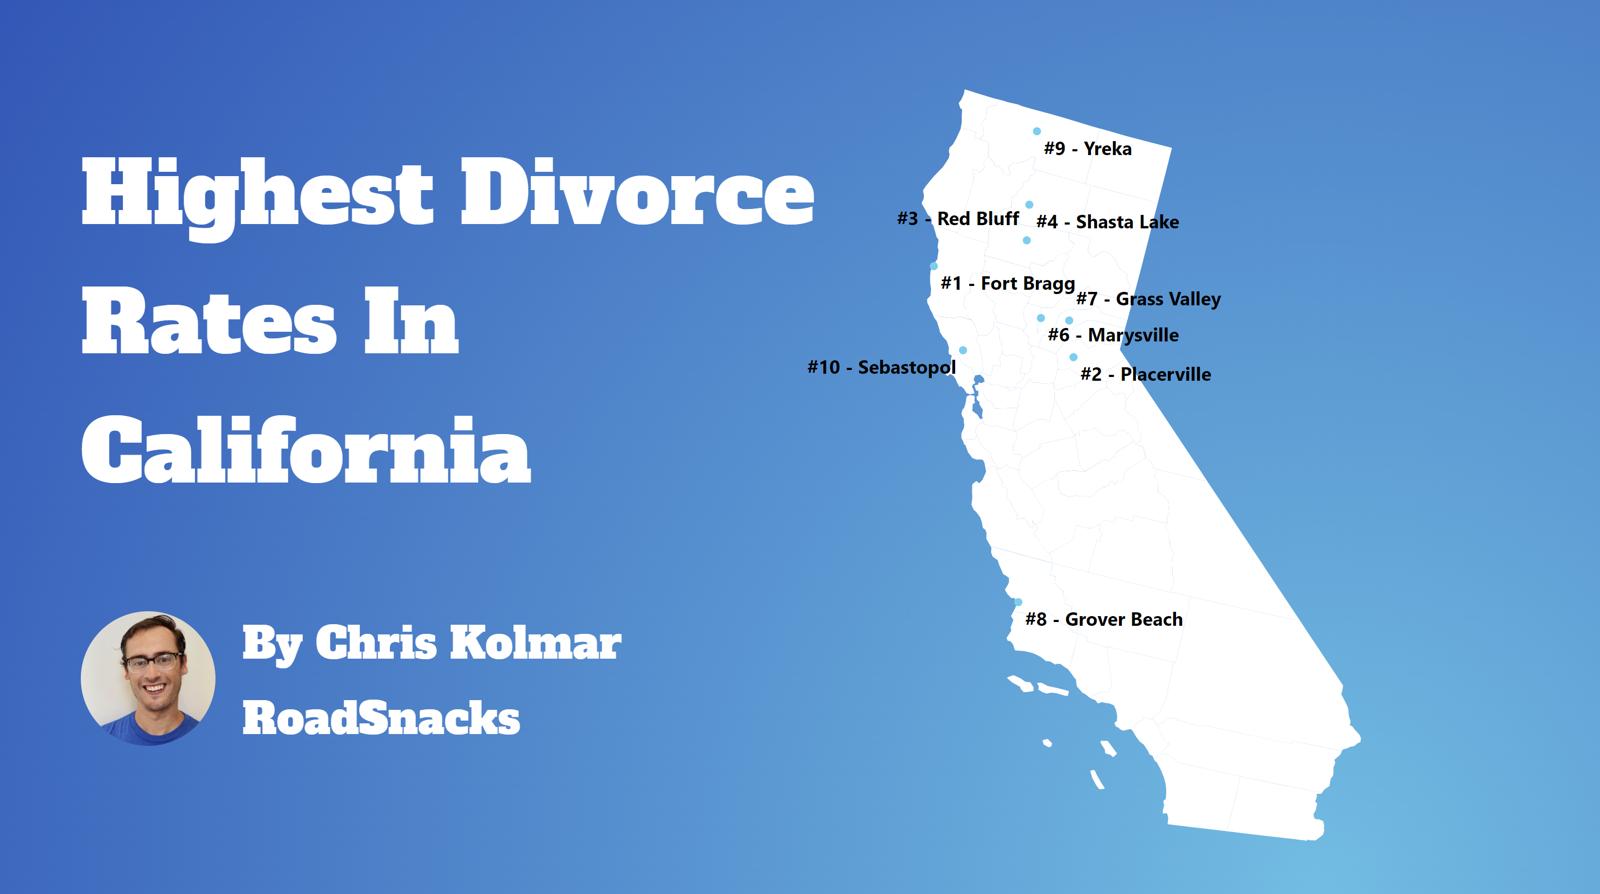
Table Of Contents: Top Ten | Methodology | Summary | Table
There are some 1,255,769 people living in California over fifteen years of age who are divorced. You can compare that to the 28,339,199 Americans who are currently divorced in 2025.
Many people decide to run away – or split up – across the Golden State.
Isn’t the divorce rate in America close to 50%? Yes indeed. But we’re measuring something else; we are looking at counts and percentages of people over 15 years old who are currently divorced. That 50% statistic is for the percentage of people who have ever been divorced.
For today’s analysis, the focus will be on the number of currently divorced people.
So now that we have you biting your nails, rethinking your worldview, and pulling out your hair, let’s look at the places in California with the highest rates of divorcees.
The 10 Cities In California With The Highest Divorce Rates
Let’s quickly recap before we dive into the Saturday Night Science behind the data.
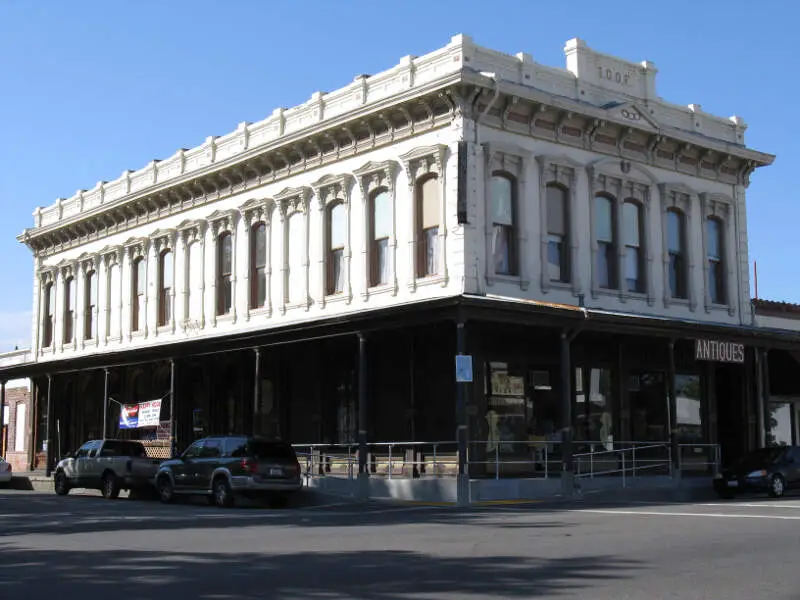
What is the city in California with the highest divorce rate? That would be Marysville, with 14.0% of people over 15 years of age being divorced, per the most recent census data.
What is the overall California divorce rate? According to the 2019-2023 Community Survey, the overall divorce rate in California is 4.0%, which compares to the US divorce rate of 10.9%.
Alrighty, on to how we calculated the places with the highest divorce rates in California.
For more California reading, check out:
- Most Dangerous Cities In California
- Worst Places To Live In California
- Best Places To Raise A Family In California
The 10 Places With The Highest Divorce Rate In California For 2025

/10
Population: 12,703
Divorce Rate: 14.0%
Divorcees: 1,422
Median Income: $58,150
More on Marysville: Data

/10
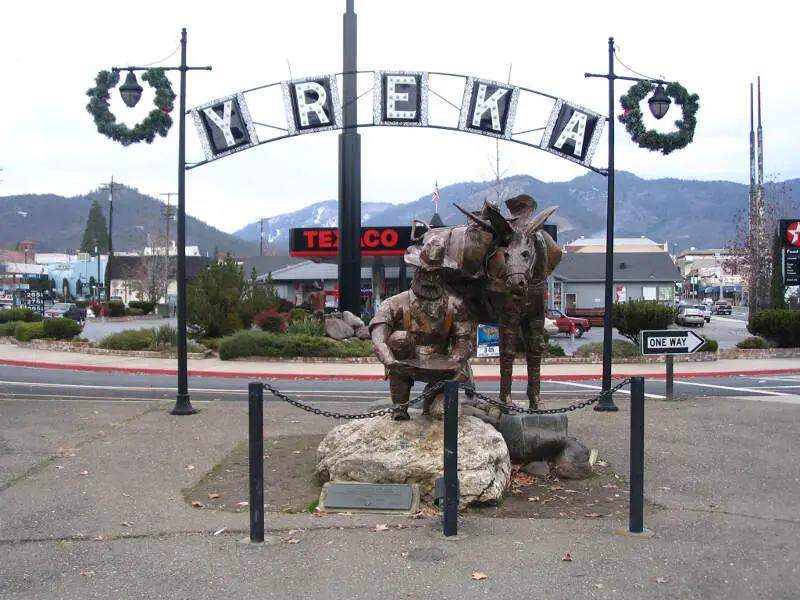
Population: 7,832
Divorce Rate: 14.0%
Divorcees: 877
Median Income: $42,664
More on Yreka: Data

/10
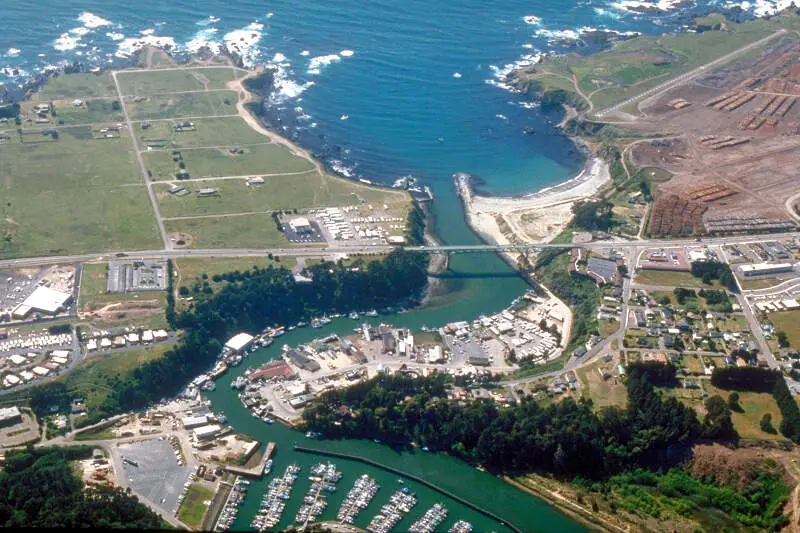
Population: 7,001
Divorce Rate: 14.0%
Divorcees: 784
Median Income: $53,580
More on Fort Bragg: Data

/10
Population: 14,592
Divorce Rate: 14.0%
Divorcees: 1,634
Median Income: $50,216
More on Red Bluff: Data

/10
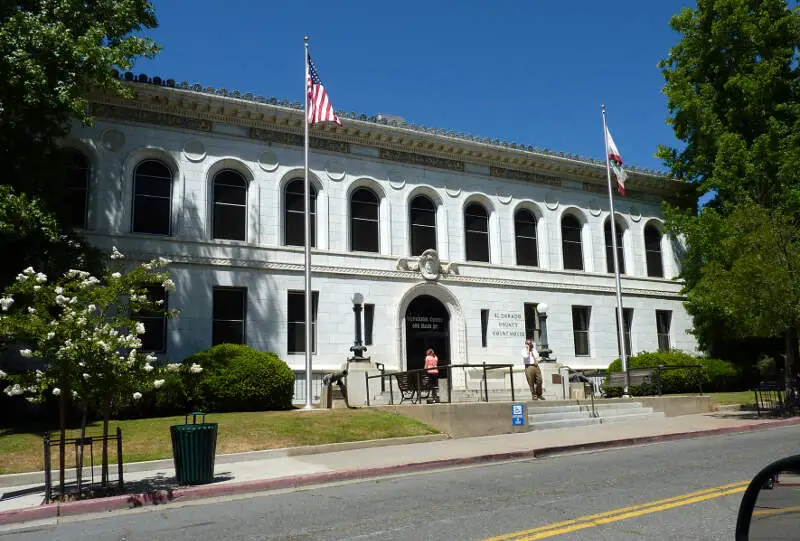
Population: 10,730
Divorce Rate: 14.0%
Divorcees: 1,201
Median Income: $70,602
More on Placerville: Data

/10
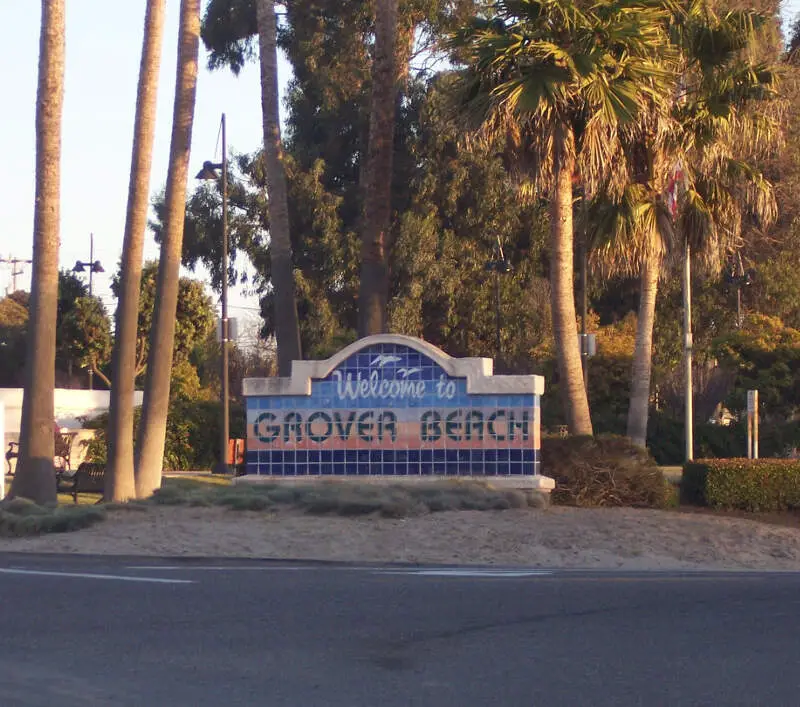
Population: 12,687
Divorce Rate: 13.0%
Divorcees: 1,319
Median Income: $82,534
More on Grover Beach: Data


/10
Population: 14,126
Divorce Rate: 12.0%
Divorcees: 1,356
Median Income: $48,850
More on Grass Valley: Data

/10
Population: 10,334
Divorce Rate: 12.0%
Divorcees: 992
Median Income: $61,319
More on Shasta Lake: Data
/10
Population: 5,085
Divorce Rate: 12.0%
Divorcees: 488
Median Income: $59,294
More on Lakeport: Data
/10
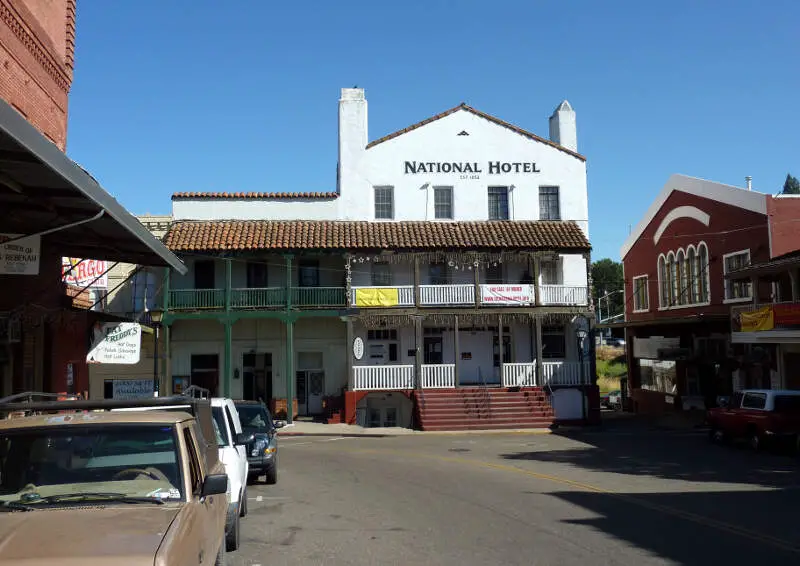
Population: 5,061
Divorce Rate: 12.0%
Divorcees: 485
Median Income: $75,051
More on Jackson: Data
How We Determined The Places In California That Get Un-Hitched The Most
Since this is the 58th category of rankings we are compiling for the site, we had a pretty good idea of where to find data on marriage and divorce in America. We used Saturday Night Science to look at the U.S. Census Bureau on divorce rates. Because who likes tracking misery more than the U.S. government?
Specifically, we looked at the 2019-2023 American Community Survey table S1201 — Marital Status.
Pretty straightforward on that front — we just had to extract the following column of data:
- Population 15 Years and Over -> Divorced
There are some interesting/fun/sad data like .1% of female Americans aged 15-19 are divorced, but 0% of males (That’s probably a rounding issue, but still).
But the national data is for another day. Today, the analysis focuses on the 428 places in California with a population of over 5,000.
We ranked each place by the percentage of divorcees over 15 years of age from highest to lowest. We crowned the divorce capital of California the place with the highest incidence of divorcees, Marysville.
And if you’re trying to avoid divorce, check out San Marino, the city with the lowest divorce rate in California.
We updated this article for 2025 and this list is our fifth time ranking the cities in California with the highest divorce rates.
Getting Some Closure In California After Untying The Know
Besides just coming up with what we thought would be a great new blog/book title, “Untying the Knot In California: Life After Divorce,” we now have a sense of what places in the Golden State don’t pay much attention to the whole “’til death do we part” phrase.
The cities with the highest divorce rate in California are Marysville, Yreka, Fort Bragg, Red Bluff, Placerville, Grover Beach, Grass Valley, Shasta Lake, Lakeport, and Jackson.
Try to keep in mind that the reason cities rank where they do in California could be because of the age, education, and income distribution, as all of those things impact the rate of divorce.
And that’s probably for the best. Getting out of a toxic relationship is much better than staying in it.
Just make sure you have your running shoes ready to go.
For more California reading, check out:
- Most Dangerous Cities In California
- Worst Places To Live In California
- Best Places To Raise A Family In California
Cities With The Highest Divorce Rates In California
| Rank | City | Population | Divorcees | Divorce Rate |
|---|---|---|---|---|
| 1 | Marysville, CA | 12,703 | 1,422 | 14.0% |
| 2 | Yreka, CA | 7,832 | 877 | 14.0% |
| 3 | Fort Bragg, CA | 7,001 | 784 | 14.0% |
| 4 | Red Bluff, CA | 14,592 | 1,634 | 14.0% |
| 5 | Placerville, CA | 10,730 | 1,201 | 14.0% |
| 6 | Grover Beach, CA | 12,687 | 1,319 | 13.0% |
| 7 | Grass Valley, CA | 14,126 | 1,356 | 12.0% |
| 8 | Shasta Lake, CA | 10,334 | 992 | 12.0% |
| 9 | Lakeport, CA | 5,085 | 488 | 12.0% |
| 10 | Jackson, CA | 5,061 | 485 | 12.0% |
| 11 | Sebastopol, CA | 7,466 | 657 | 11.0% |
| 12 | Calimesa, CA | 10,680 | 939 | 11.0% |
| 13 | Anderson, CA | 11,282 | 992 | 11.0% |
| 14 | Fortuna, CA | 12,413 | 993 | 10.0% |
| 15 | Clearlake, CA | 16,604 | 1,328 | 10.0% |
| 16 | Crescent City, CA | 6,180 | 494 | 10.0% |
| 17 | Ione, CA | 5,306 | 424 | 10.0% |
| 18 | Oroville, CA | 19,855 | 1,588 | 10.0% |
| 19 | Chowchilla, CA | 18,876 | 1,510 | 10.0% |
| 20 | Redding, CA | 93,268 | 7,461 | 10.0% |
| 21 | Auburn, CA | 13,758 | 990 | 9.0% |
| 22 | Kingsburg, CA | 12,589 | 906 | 9.0% |
| 23 | Eureka, CA | 26,302 | 1,893 | 9.0% |
| 24 | Tehachapi, CA | 12,366 | 890 | 9.0% |
| 25 | Ukiah, CA | 16,419 | 1,182 | 9.0% |
| 26 | Big Bear Lake, CA | 5,038 | 362 | 9.0% |
| 27 | Taft, CA | 7,228 | 520 | 9.0% |
| 28 | Capitola, CA | 9,813 | 706 | 9.0% |
| 29 | Exeter, CA | 10,280 | 740 | 9.0% |
| 30 | Susanville, CA | 14,992 | 959 | 8.0% |
| 31 | Hughson, CA | 7,541 | 482 | 8.0% |
| 32 | Sonoma, CA | 10,726 | 686 | 8.0% |
| 33 | Loomis, CA | 6,809 | 435 | 8.0% |
| 34 | Ridgecrest, CA | 28,138 | 1,800 | 8.0% |
| 35 | Healdsburg, CA | 11,274 | 721 | 8.0% |
| 36 | Citrus Heights, CA | 87,036 | 5,570 | 8.0% |
| 37 | Martinez, CA | 36,926 | 2,363 | 8.0% |
| 38 | Yucca Valley, CA | 21,744 | 1,391 | 8.0% |
| 39 | Blythe, CA | 17,824 | 1,140 | 8.0% |
| 40 | Willows, CA | 6,239 | 399 | 8.0% |
| 41 | Modesto, CA | 218,614 | 12,242 | 7.0% |
| 42 | Ojai, CA | 7,576 | 424 | 7.0% |
| 43 | Visalia, CA | 142,649 | 7,988 | 7.0% |
| 44 | Clovis, CA | 122,719 | 6,872 | 7.0% |
| 45 | Colusa, CA | 6,439 | 360 | 7.0% |
| 46 | Orland, CA | 8,252 | 462 | 7.0% |
| 47 | Lemoore, CA | 27,023 | 1,513 | 7.0% |
| 48 | Pacific Grove, CA | 15,003 | 840 | 7.0% |
| 49 | Sierra Madre, CA | 11,020 | 617 | 7.0% |
| 50 | Selma, CA | 24,586 | 1,376 | 7.0% |
| 51 | Scotts Valley, CA | 12,138 | 679 | 7.0% |
| 52 | Santa Rosa, CA | 177,216 | 9,924 | 7.0% |
| 53 | El Paso De Robles (Paso Robles), CA | 31,399 | 1,758 | 7.0% |
| 54 | Apple Valley, CA | 75,478 | 4,226 | 7.0% |
| 55 | Hollister, CA | 43,003 | 2,408 | 7.0% |
| 56 | San Buenaventura (Ventura), CA | 109,900 | 6,154 | 7.0% |
| 57 | Hemet, CA | 90,646 | 5,076 | 7.0% |
| 58 | Hanford, CA | 59,389 | 3,325 | 7.0% |
| 59 | Atascadero, CA | 29,735 | 1,665 | 7.0% |
| 60 | Grand Terrace, CA | 13,069 | 731 | 7.0% |
| 61 | Los Alamitos, CA | 11,784 | 659 | 7.0% |
| 62 | St. Helena, CA | 5,378 | 301 | 7.0% |
| 63 | Windsor, CA | 26,179 | 1,466 | 7.0% |
| 64 | Gridley, CA | 7,372 | 412 | 7.0% |
| 65 | Chico, CA | 102,032 | 5,713 | 7.0% |
| 66 | Morro Bay, CA | 10,717 | 600 | 7.0% |
| 67 | Canyon Lake, CA | 11,107 | 621 | 7.0% |
| 68 | California City, CA | 14,821 | 829 | 7.0% |
| 69 | La Quinta, CA | 38,299 | 1,838 | 6.0% |
| 70 | Yucaipa, CA | 54,348 | 2,608 | 6.0% |
| 71 | La Mesa, CA | 60,835 | 2,920 | 6.0% |
| 72 | Pismo Beach, CA | 8,024 | 385 | 6.0% |
| 73 | Calipatria, CA | 6,549 | 314 | 6.0% |
| 74 | Brawley, CA | 26,934 | 1,292 | 6.0% |
| 75 | Antioch, CA | 115,759 | 5,556 | 6.0% |
| 76 | Pleasant Hill, CA | 34,335 | 1,648 | 6.0% |
| 77 | Escalon, CA | 7,429 | 356 | 6.0% |
| 78 | Monrovia, CA | 37,553 | 1,802 | 6.0% |
| 79 | San Dimas, CA | 34,099 | 1,636 | 6.0% |
| 80 | Huntington Beach, CA | 196,010 | 9,408 | 6.0% |
| 81 | Fillmore, CA | 16,665 | 799 | 6.0% |
| 82 | Folsom, CA | 82,140 | 3,942 | 6.0% |
| 83 | Arroyo Grande, CA | 18,412 | 883 | 6.0% |
| 84 | Fowler, CA | 6,930 | 332 | 6.0% |
| 85 | Hesperia, CA | 100,141 | 4,806 | 6.0% |
| 86 | Fresno, CA | 543,615 | 26,093 | 6.0% |
| 87 | Whittier, CA | 85,925 | 4,124 | 6.0% |
| 88 | Roseville, CA | 152,438 | 7,317 | 6.0% |
| 89 | Turlock, CA | 72,400 | 3,475 | 6.0% |
| 90 | Half Moon Bay, CA | 11,454 | 549 | 6.0% |
| 91 | Tulare, CA | 69,984 | 3,359 | 6.0% |
| 92 | Rio Vista, CA | 10,002 | 480 | 6.0% |
| 93 | Buellton, CA | 5,090 | 244 | 6.0% |
| 94 | Calistoga, CA | 5,159 | 247 | 6.0% |
| 95 | Petaluma, CA | 59,321 | 2,847 | 6.0% |
| 96 | Oakley, CA | 44,311 | 2,126 | 6.0% |
| 97 | Lodi, CA | 67,008 | 3,216 | 6.0% |
| 98 | Manteca, CA | 86,521 | 4,153 | 6.0% |
| 99 | Cotati, CA | 7,533 | 361 | 6.0% |
| 100 | Lemon Grove, CA | 27,489 | 1,319 | 6.0% |
This is awesome data! Working on my thesis and have found myself relying on Road Snacks a ton.
Found this article ( https://www.roadsnacks.net/california-divorce-rates/ ) especially helpful. Thanks