
Gayest places in South Carolina research summary. We used Saturday Night Science to research the cities in South Carolina with the highest percent of same-sex households for 2025. The data comes from the American Community Survey 2013-2018 vintage, which breaks down sex by household status. Unfortunately, the Census has stopped reporting at the city level, so this report reflects the most recent data.
-
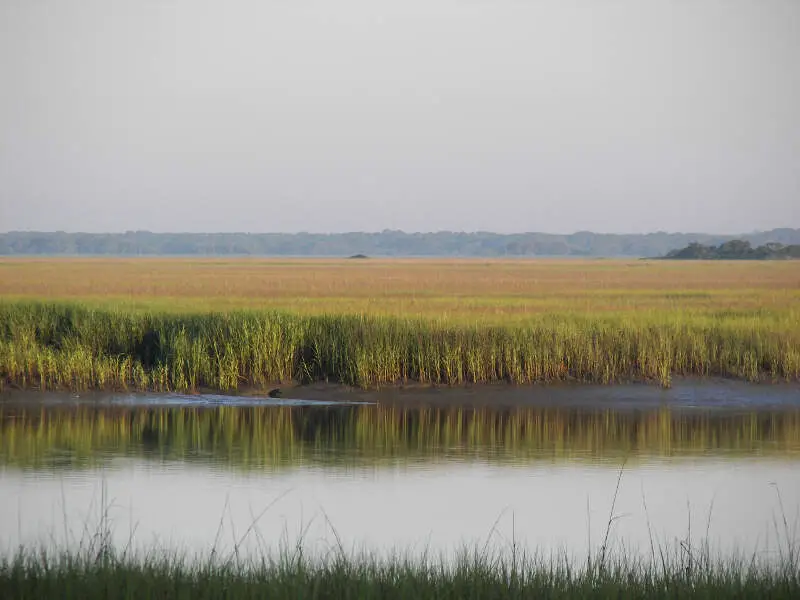
The city with the highest rate of same-sex houesholds in South Carolina is Ridgeland. 6.39% of households in Ridgeland are gay.
-
The city in South Carolina with the most same-sex houesholds is Columbia with 277 gay households.
-
South Carolina is the 34th most gay in the United States.
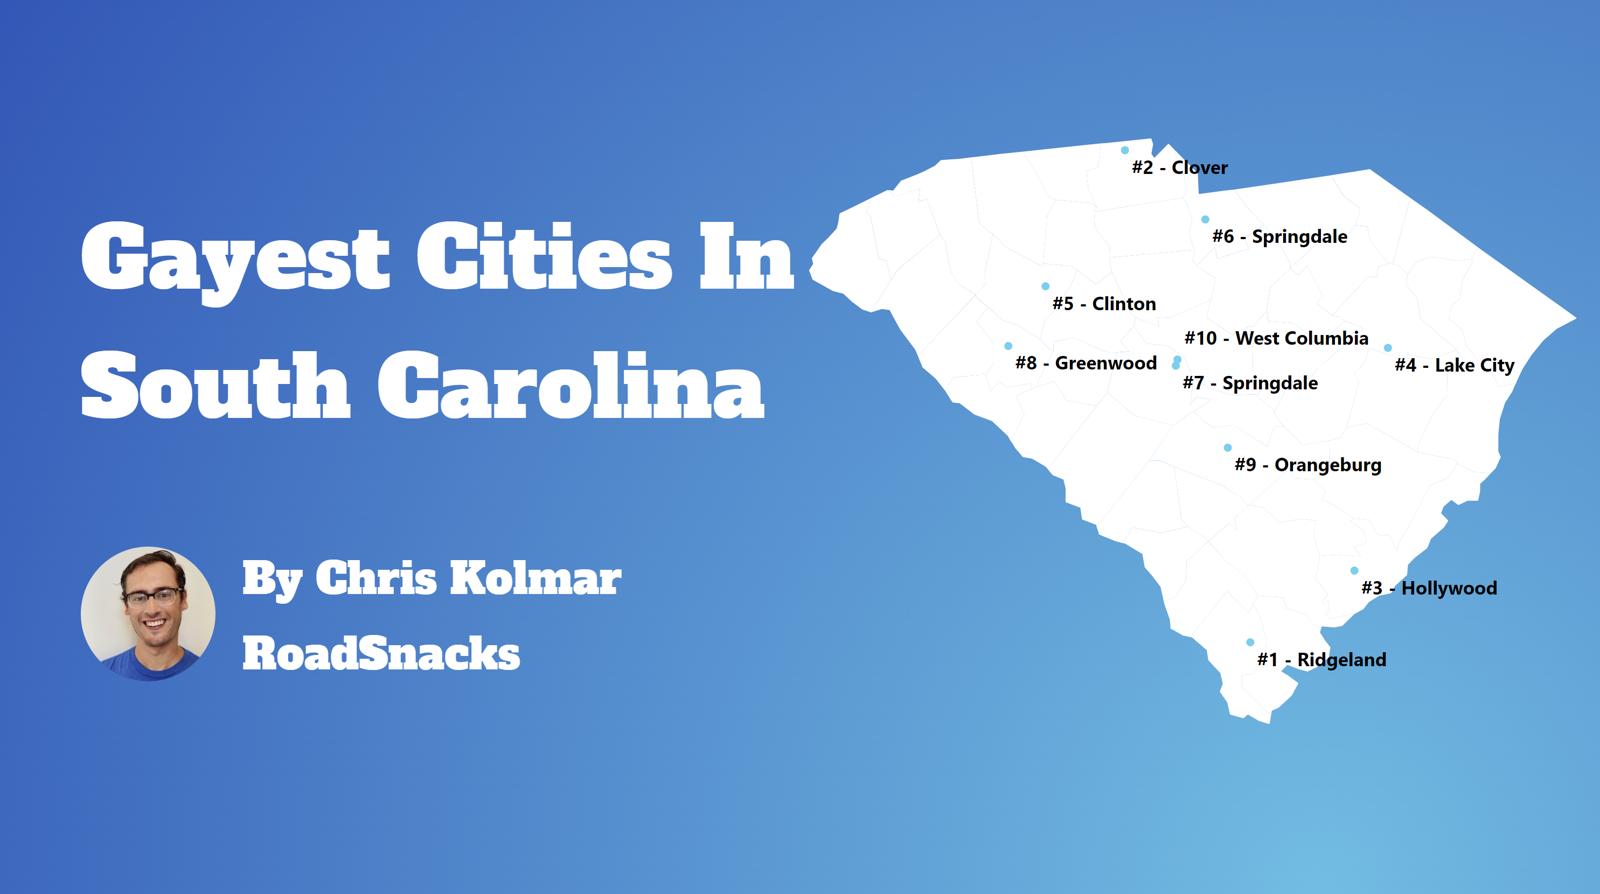
Table Of Contents: Top Ten | Methodology | Summary | Table
An estimated 5.3% of South Carolina residents are gay.
That means there are a total of 34,500 gay households in The Palmetto State.
Our goal with this post is to use Saturday Night Science and data to determine the gayest cities in South Carolina.
After analyzing 98 cities with over 1,000 households, we’ve determined these are The Gayest Cities in South Carolina for 2025.
The 10 Gayest Places In South Carolina For 2025
- Ridgeland
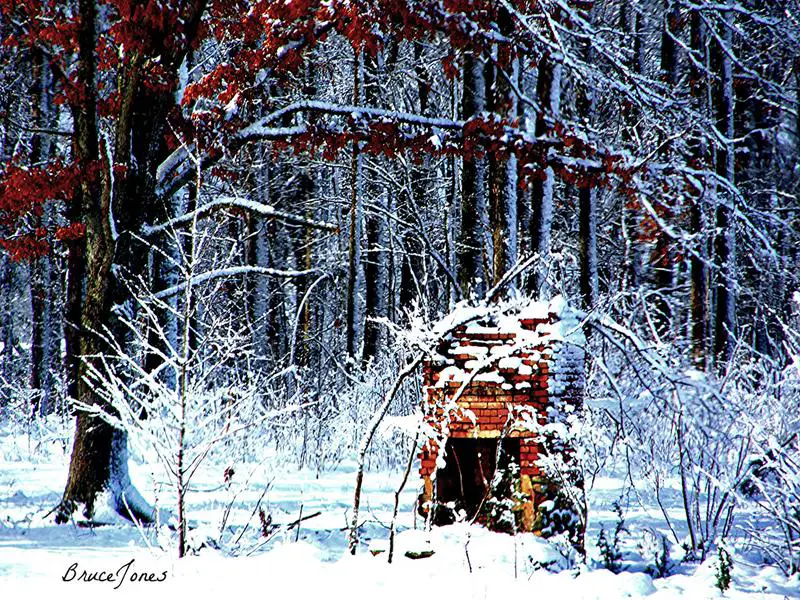
- Clover
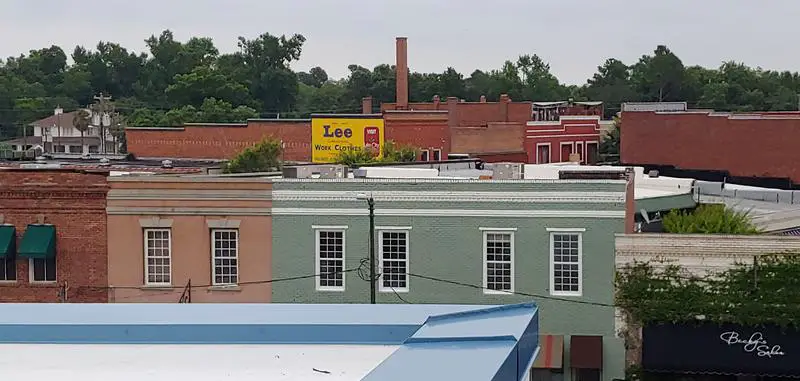
- Hollywood
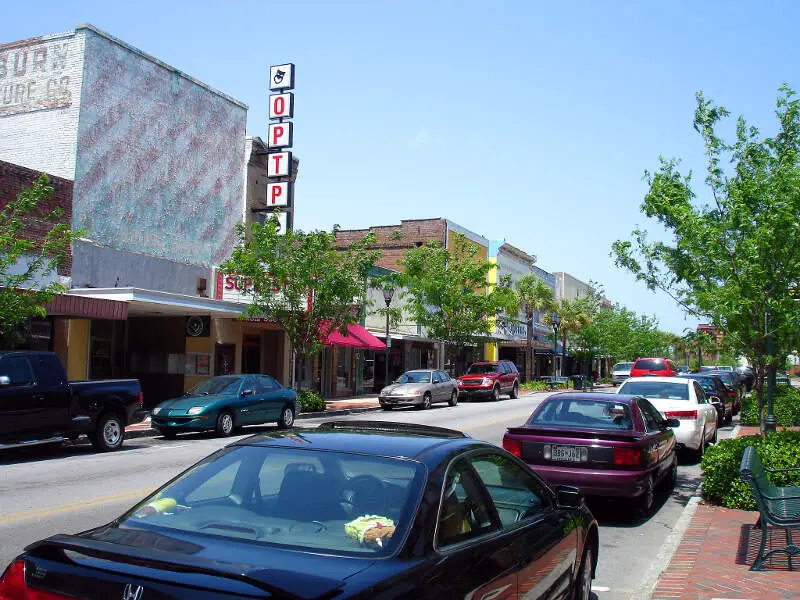
- Lake City
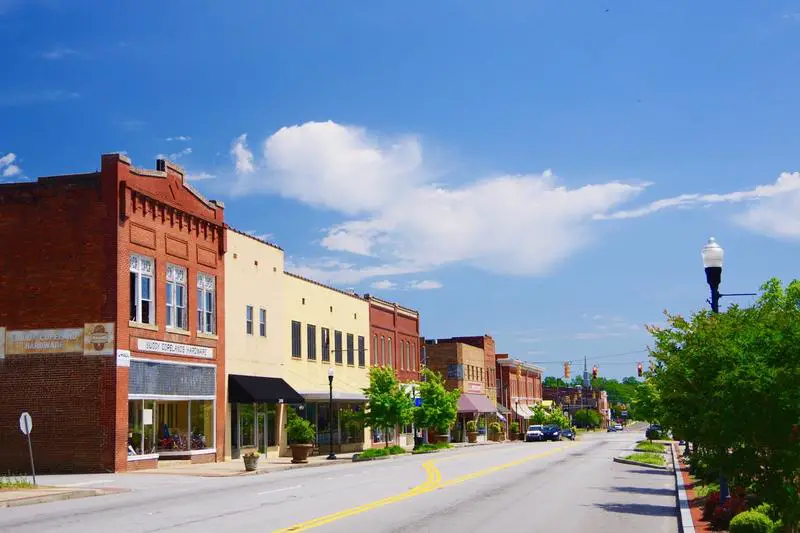
- Clinton
- Springdale
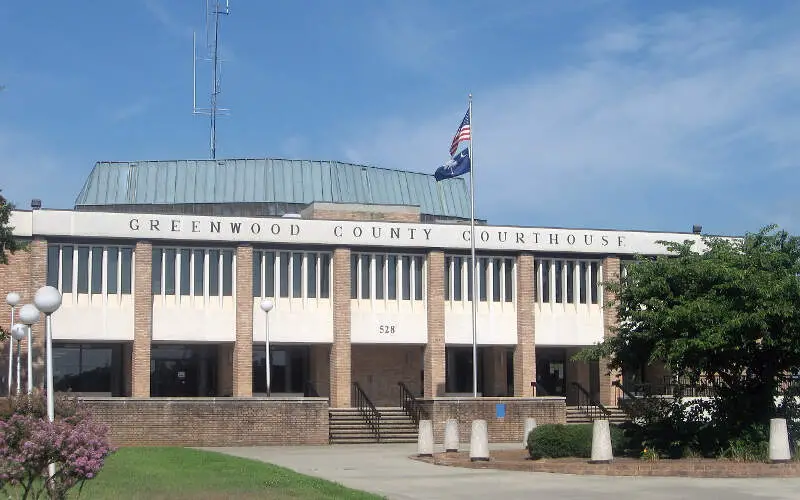
- Greenwood
- Orangeburg
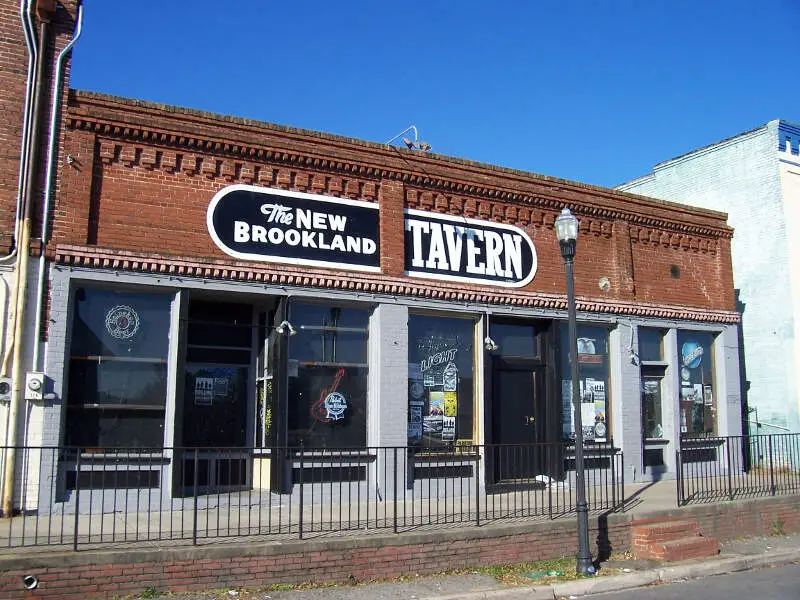
- West Columbia
- Simpsonville
What’s the gayest place in South Carolina? According to the facts, Ridgeland is the gayest place in South Carolina for 2025.
For more on how we calculated the top ten, and for more information about these places, read on.
For more South Carolina reading, check out:
- Gayest cities in the United States
- Best Places To Live In South Carolina
- Cheapest Places To Live In South Carolina
- Most Dangerous Cities In South Carolina
The 10 Gayest Cities In South Carolina For 2025
/10
Households: 1,284
Gay Households: 41 (14th highest)
% Gay Households: 6.39% (1st highest)
More on Ridgeland: Data

/10
Households: 2,075
Gay Households: 27 (18th highest)
% Gay Households: 1.83% (2nd highest)
More on Clover: Data
/10
Households: 2,151
Gay Households: 19 (28th highest)
% Gay Households: 1.77% (3rd highest)
More on Hollywood: Data
/10
Households: 2,349
Gay Households: 20 (27th highest)
% Gay Households: 1.7% (4th highest)
More on Lake City: Data

/10
Households: 2,981
Gay Households: 21 (26th highest)
% Gay Households: 1.41% (5th highest)
More on Clinton: Data
/10
Households: 1,154
Gay Households: 6 (44th highest)
% Gay Households: 1.04% (6th highest)
More on Springdale: Data

/10
Households: 8,914
Gay Households: 117 (4th highest)
% Gay Households: 0.81% (7th highest)
More on Greenwood: Data

/10
Households: 4,237
Gay Households: 17 (31st highest)
% Gay Households: 0.8% (8th highest)
More on Orangeburg: Data

/10
Households: 8,059
Gay Households: 54 (10th highest)
% Gay Households: 0.69% (9th highest)
More on West Columbia: Data

/10
Households: 8,073
Gay Households: 43 (12th highest)
% Gay Households: 0.67% (10th highest)
More on Simpsonville: Data
How do you determine the best cities for same-sex households in South Carolina for 2025
In order to rank the gayest cities in South Carolina, we used Saturday Night Science and the 2013-2018 American Community Survey from the U.S. Census. We looked at:
- Percentage of all households that are unmarried, same sex partners
We limited the analysis to non-CDPs that have over 1,000 households.
We ranked each place from 1 to 98 with the city containing the highest percentage of unmarried, same sex partners households being the most gay.
In the end, ended up being the the most gay place with 6.39% gay households.
Skip to the end to see the list of all the places in the state from gayest to straighest.
We updated this report for 2025. This report is our tenth time ranking the gayest places in South Carolina.
There You Have It – The Most LGBT Friendly Cities In South Carolina For 2025
If you’re looking at the number of gay households in South Carolina, this is an accurate list.
The gayest cities in South Carolina are .
If you’re curious enough, here are the least gay places in South Carolina:
- Isle Of Palms
- Walhalla
- Folly Beach
For more South Carolina reading, check out:
- Richest Cities In South Carolina
- Safest Places In South Carolina
- Worst Places To Live In South Carolina
- Most Expensive Places To Live In South Carolina
Table: Gayest Places To Live In South Carolina
| Rank | City | Households | % Gay Households |
|---|---|---|---|
| 1 | Ridgeland | 1,284 | 6.39% |
| 2 | Clover | 2,075 | 1.83% |
| 3 | Hollywood | 2,151 | 1.77% |
| 4 | Lake City | 2,349 | 1.7% |
| 5 | Clinton | 2,981 | 1.41% |
| 6 | Springdale | 1,154 | 1.04% |
| 7 | Greenwood | 8,914 | 0.81% |
| 8 | Orangeburg | 4,237 | 0.8% |
| 9 | West Columbia | 8,059 | 0.69% |
| 10 | Simpsonville | 8,073 | 0.67% |
| 11 | North Myrtle Beach | 7,640 | 0.65% |
| 12 | Summerville | 18,399 | 0.65% |
| 13 | Spartanburg | 15,294 | 0.6% |
| 14 | Columbia | 46,822 | 0.55% |
| 15 | Laurens | 3,763 | 0.53% |
| 16 | Charleston | 55,013 | 0.5% |
| 17 | Conway | 7,832 | 0.46% |
| 18 | Easley | 8,945 | 0.45% |
| 19 | Greenville | 28,762 | 0.4% |
| 20 | Irmo | 4,608 | 0.39% |
| 21 | North Augusta | 9,477 | 0.36% |
| 22 | Clemson | 6,246 | 0.35% |
| 23 | Hilton Head Island | 17,385 | 0.35% |
| 24 | North Charleston | 41,004 | 0.33% |
| 25 | Fort Mill | 5,702 | 0.32% |
| 26 | Myrtle Beach | 13,774 | 0.3% |
| 27 | Anderson | 11,436 | 0.19% |
| 28 | Chester | 2,235 | 0.18% |
| 29 | Hanahan | 8,376 | 0.17% |
| 30 | Sumter | 15,779 | 0.15% |
| 31 | Lexington | 7,995 | 0.1% |
| 32 | Rock Hill | 28,112 | 0.09% |
| 33 | Bennettsville | 2,947 | 0.0% |
| 34 | Hampton | 1,212 | 0.0% |
| 35 | Union | 3,455 | 0.0% |
| 36 | Landrum | 1,081 | 0.0% |
| 37 | Moncks Corner | 3,562 | 0.0% |
| 38 | Manning | 1,535 | 0.0% |
| 39 | Kingstree | 1,407 | 0.0% |
| 40 | Marion | 2,262 | 0.0% |
| 41 | Honea Path | 1,522 | 0.0% |
| 42 | Cheraw | 2,124 | 0.0% |
| 43 | Bluffton | 6,790 | 0.0% |
| 44 | Tega Cay | 3,454 | 0.0% |
| 45 | Woodruff | 1,509 | 0.0% |
| 46 | Saluda | 1,150 | 0.0% |
| 47 | Batesburg-Leesville | 2,010 | 0.0% |
| 48 | Winnsboro | 1,278 | 0.0% |
| 49 | Williamston | 1,878 | 0.0% |
| 50 | Allendale | 1,250 | 0.0% |
| 51 | Abbeville | 2,194 | 0.0% |
| 52 | Mullins | 1,633 | 0.0% |
| 53 | York | 3,353 | 0.0% |
| 54 | Loris | 1,050 | 0.0% |
| 55 | Walterboro | 2,310 | 0.0% |
| 56 | Lancaster | 3,444 | 0.0% |
| 57 | Pageland | 1,083 | 0.0% |
| 58 | Hardeeville | 2,402 | 0.0% |
| 59 | Denmark | 1,072 | 0.0% |
| 60 | Pickens | 1,272 | 0.0% |
| 61 | Barnwell | 1,736 | 0.0% |
| 62 | Pendleton | 1,450 | 0.0% |
| 63 | Duncan | 1,236 | 0.0% |
| 64 | Surfside Beach | 2,070 | 0.0% |
| 65 | Florence | 15,291 | 0.0% |
| 66 | Inman | 1,171 | 0.0% |
| 67 | Mauldin | 9,834 | 0.0% |
| 68 | Bamberg | 1,138 | 0.0% |
| 69 | Cayce | 5,905 | 0.0% |
| 70 | Hartsville | 3,065 | 0.0% |
| 71 | Edgefield | 1,204 | 0.0% |
| 72 | Forest Acres | 4,557 | 0.0% |
| 73 | Central | 2,506 | 0.0% |
| 74 | Lyman | 1,388 | 0.0% |
| 75 | Newberry | 3,947 | 0.0% |
| 76 | Gaffney | 4,293 | 0.0% |
| 77 | Port Royal | 3,688 | 0.0% |
| 78 | Beaufort | 4,835 | 0.0% |
| 79 | Goose Creek | 13,770 | 0.0% |
| 80 | Georgetown | 3,422 | 0.0% |
| 81 | Darlington | 2,772 | 0.0% |
| 82 | Dillon | 2,130 | 0.0% |
| 83 | Williston | 1,159 | 0.0% |
| 84 | Fountain Inn | 2,939 | 0.0% |
| 85 | Mount Pleasant | 33,208 | 0.0% |
| 86 | Bishopville | 1,234 | 0.0% |
| 87 | Andrews | 1,094 | 0.0% |
| 88 | Liberty | 1,381 | 0.0% |
| 89 | Belton | 2,014 | 0.0% |
| 90 | Seneca | 3,750 | 0.0% |
| 91 | Travelers Rest | 1,813 | 0.0% |
| 92 | Greer | 11,212 | 0.0% |
| 93 | Camden | 2,953 | 0.0% |
| 94 | Aiken | 13,211 | 0.0% |
| 95 | Westminster | 1,068 | 0.0% |
| 96 | Folly Beach | 1,357 | 0.0% |
| 97 | Walhalla | 1,756 | 0.0% |
| 98 | Isle Of Palms | 1,879 | 0.0% |