
Most African American cities in New Mexico research summary. We used Saturday Night Science to analyze New Mexico’s most recent Census data to determine the blackest cities in New Mexico based on the percentage of Black residents. Here are the results of our analysis:
-
The city with the largest African American population in New Mexico is Alamogordo based on the most recent Census data.
-
Alamogordo is 5.56% Black.
-
The least African American city in New Mexico is Artesia.
-
Artesia is 0.0% Black.
-
New Mexico is 1.8% Black.
-
New Mexico is the 42nd blackest state in the United States.
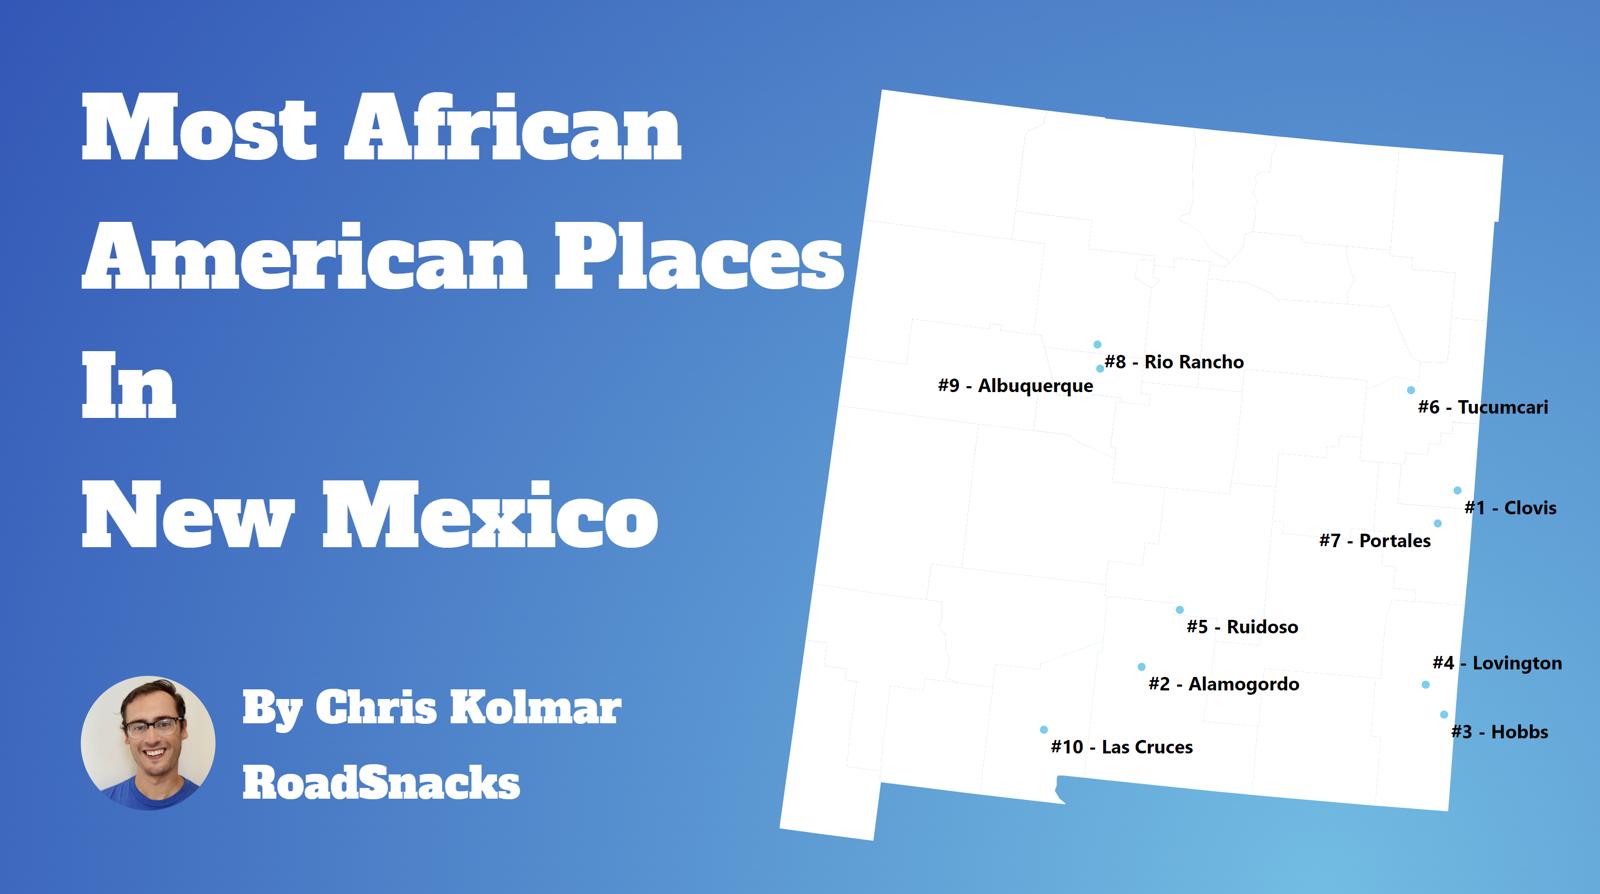
Table Of Contents: Top Ten | Methodology | Summary | Table
The Black community is one of the fastest-growing communities in America this decade.
Roughly 42 million people identifying as Black or African American live in the United States, making up 12% of the total population. According to the most recent American Community Survey, the Black population in New Mexico is 38,382 – at 1.8% of the total population of New Mexico.
The percentage growth of Blacks in America is the third largest percentage change for any race according to the Census’s race and ethnicity definition. Most scholars and historians agree that increasing diversity in America is a good thing.
We agree.
But how has the increase in the black population impacted New Mexico? Which cities and towns in New Mexico have seen the greatest increase in its Black population?
We broke down the most recent census data to determine the cities in New Mexico with the largest African American population in 2025:
Most African American Places In New Mexico
What’s the blackest city in New Mexico? The city with the largest Black population in New Mexico for 2025 is Alamogordo. See if Alamogordo ranked as one of the most african american places in America.
And if you already knew these places were Black, check out the best places to live in New Mexico or the most diverse places in New Mexico.
The 10 Blackest Cities In New Mexico For 2025
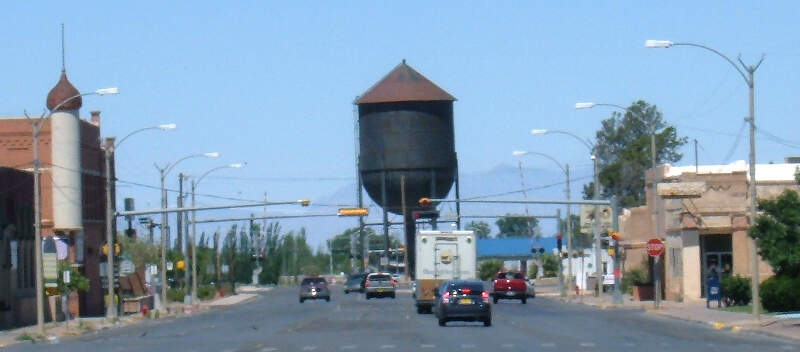
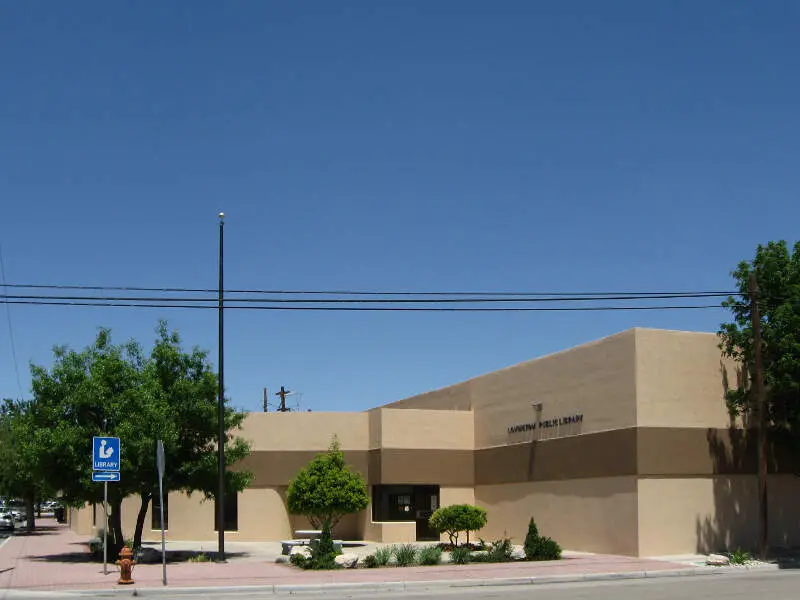
1. Alamogordo
/10
Population: 31,063
% African American: 5.56%
# Of African American Residents: 1,727
Percent Change Since 2010: 8.14%
More on Alamogordo: Data
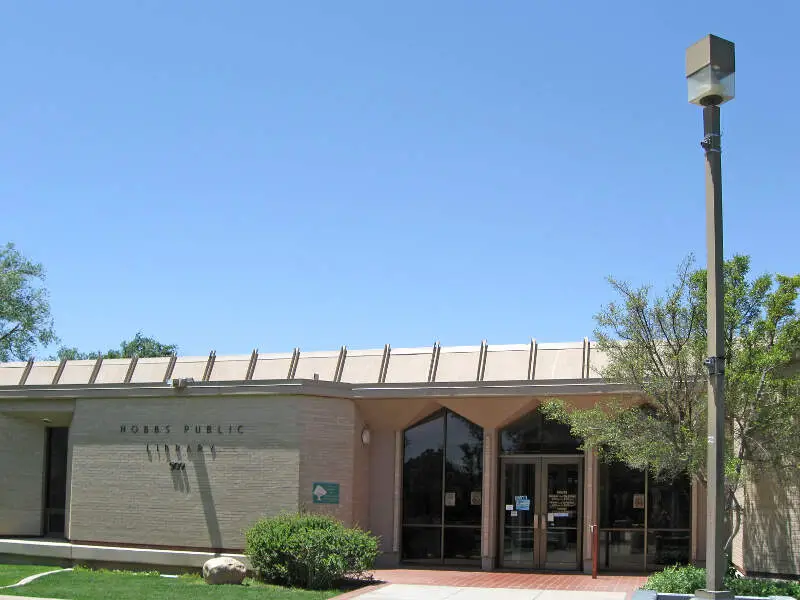
2. Hobbs
/10
Population: 39,887
% African American: 5.23%
# Of African American Residents: 2,087
Percent Change Since 2010: 1.16%
More on Hobbs: Data
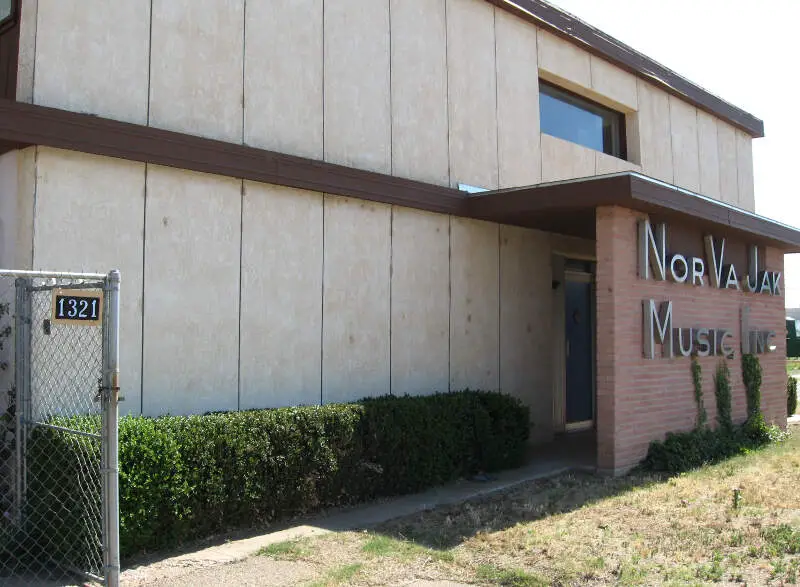
3. Clovis
/10
Population: 38,153
% African American: 5.06%
# Of African American Residents: 1,932
Percent Change Since 2010: -21.08%
More on Clovis: Data
4. Lovington
/10
Population: 11,444
% African American: 3.18%
# Of African American Residents: 364
Percent Change Since 2010: -23.04%
More on Lovington: Data
5. Albuquerque
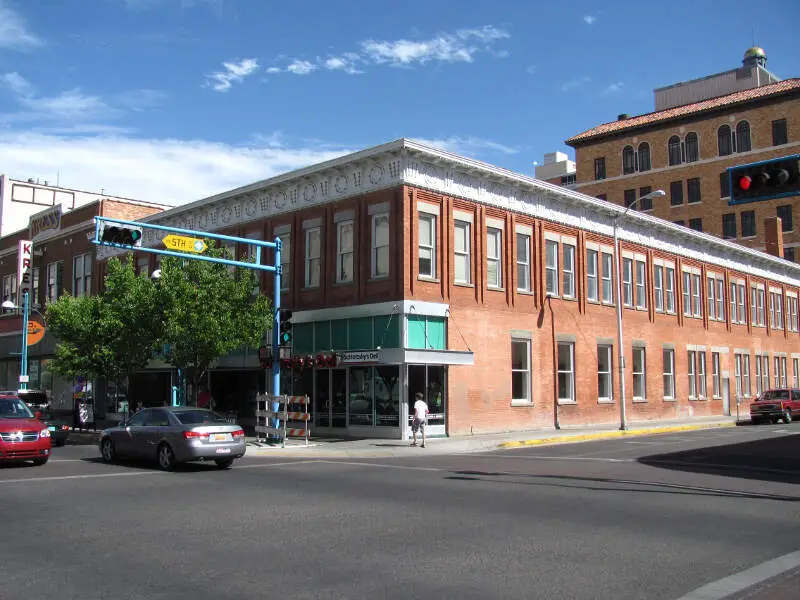
/10
Population: 562,488
% African American: 2.8%
# Of African American Residents: 15,753
Percent Change Since 2010: 3.53%
More on Albuquerque: Data
6. Rio Rancho
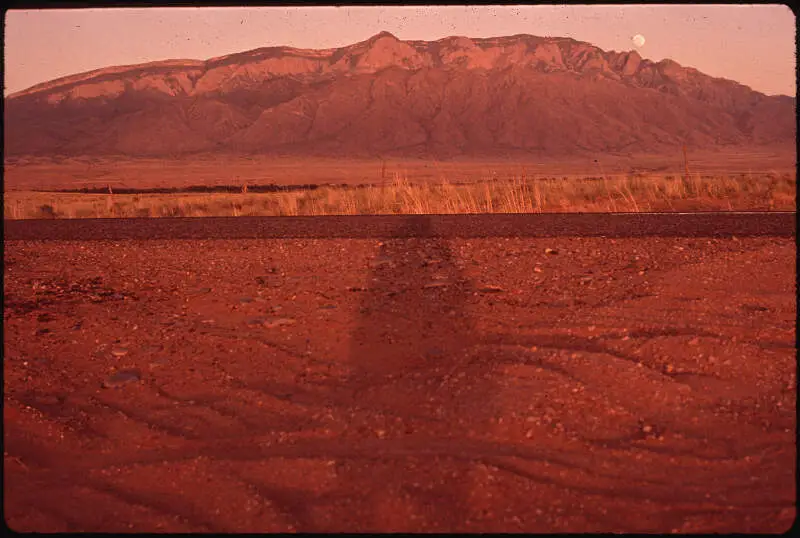
/10
Population: 106,533
% African American: 2.75%
# Of African American Residents: 2,927
Percent Change Since 2010: 24.13%
More on Rio Rancho: Data
7. Las Cruces
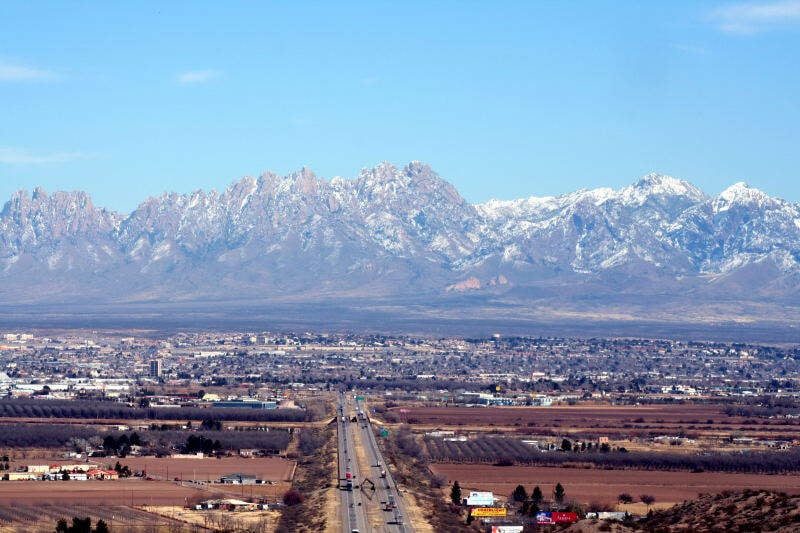
/10
Population: 112,612
% African American: 2.2%
# Of African American Residents: 2,480
Percent Change Since 2010: 55.0%
More on Las Cruces: Data
8. Carlsbad
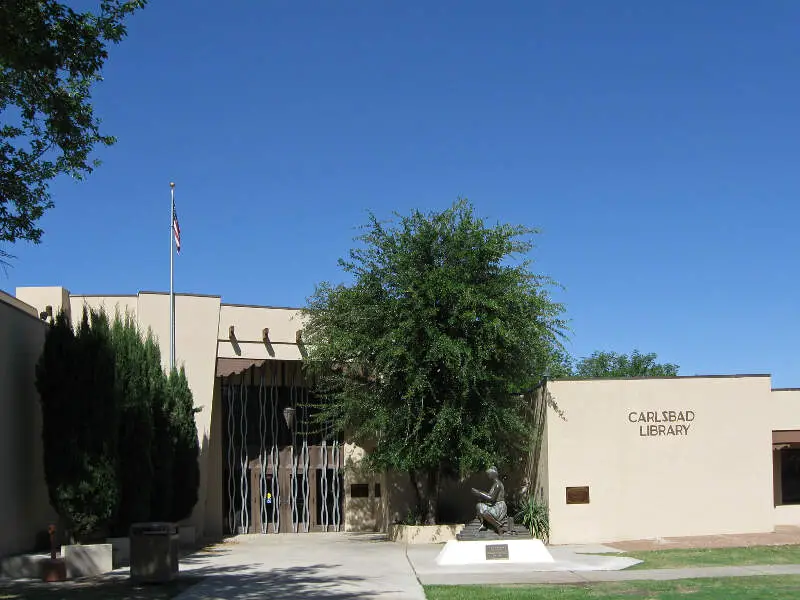
/10
Population: 31,813
% African American: 2.17%
# Of African American Residents: 689
Percent Change Since 2010: 81.79%
More on Carlsbad: Data
9. Deming
/10
Population: 14,735
% African American: 1.86%
# Of African American Residents: 274
Percent Change Since 2010: 44.97%
More on Deming: Data
10. Tucumcari
/10
Population: 5,197
% African American: 1.85%
# Of African American Residents: 96
Percent Change Since 2010: 95.92%
More on Tucumcari: Data
Methodology: How We Determined The Cities In New Mexico With The Largest Black Population For 2025
We still believe in the accuracy of data — especially from the Census. So that’s where we went to get the race breakdown across New Mexico.
That leads us to the Census’s most recently available data, the 2019-2023 American Community Survey data from the US Census.
Specifically, we looked at table B03002: Hispanic OR LATINO ORIGIN BY RACE. Here are the category names as defined by the Census:
- Hispanic or Latino
- White alone*
- Black or African American alone*
- American Indian and Alaska Native alone*
- Asian alone*
- Native Hawaiian and Other Pacific Islander alone*
- Some other race alone*
- Two or more races*
Our particular column of interest was the number of people who identified as Black or African American.
We limited our analysis to non-CDPs with a population greater than 5,000 people in New Mexico. That left us with 32 cities.
We then calculated the percentage of residents that are Black or African American. The percentages ranked from 5.6% to 0.0%.
Finally, we ranked each city based on the percentage of the Black population, with a higher score being more Black than a lower score. Alamogordo took the distinction of being the most Black, while Artesia was the least African American city.
We updated this article for 2025. This is our tenth time ranking the cities in New Mexico with the largest African American population.
Read on for more information on how the cities in New Mexico ranked by population of African American residents or, for a more general take on diversity in America, head over to our ranking of the most diverse cities in America.
Summary: Black Populations Across New Mexico
If you’re looking for a breakdown of African American populations across New Mexico according to the most recent data, this is an accurate list.
The blackest cities in New Mexico are Alamogordo, Hobbs, Clovis, Lovington, Albuquerque, Rio Rancho, Las Cruces, Carlsbad, Deming, and Tucumcari.
If you’re curious enough, here are the least African American places in New Mexico:
- Artesia
- Aztec
- Taos
For more New Mexico reading, check out:
- Best Places To Live In New Mexico
- Most Dangerous Cities In New Mexico
- Best Places To Raise A Family In New Mexico
African American Population By City In New Mexico
| Rank | City | Population | African American Population | % African American |
|---|---|---|---|---|
| 1 | Alamogordo | 31,063 | 1,727 | 5.56% |
| 2 | Hobbs | 39,887 | 2,087 | 5.23% |
| 3 | Clovis | 38,153 | 1,932 | 5.06% |
| 4 | Lovington | 11,444 | 364 | 3.18% |
| 5 | Albuquerque | 562,488 | 15,753 | 2.8% |
| 6 | Rio Rancho | 106,533 | 2,927 | 2.75% |
| 7 | Las Cruces | 112,612 | 2,480 | 2.2% |
| 8 | Carlsbad | 31,813 | 689 | 2.17% |
| 9 | Deming | 14,735 | 274 | 1.86% |
| 10 | Tucumcari | 5,197 | 96 | 1.85% |
| 11 | Roswell | 47,823 | 797 | 1.67% |
| 12 | Grants | 9,106 | 147 | 1.61% |
| 13 | Los Lunas | 17,932 | 278 | 1.55% |
| 14 | Portales | 12,023 | 164 | 1.36% |
| 15 | Gallup | 21,333 | 278 | 1.3% |
| 16 | Ruidoso | 7,701 | 98 | 1.27% |
| 17 | Las Vegas | 13,120 | 164 | 1.25% |
| 18 | Los Ranchos De Albuquerque | 5,869 | 73 | 1.24% |
| 19 | Corrales | 8,557 | 97 | 1.13% |
| 20 | Santa Fe | 88,224 | 932 | 1.06% |
| 21 | Farmington | 46,339 | 333 | 0.72% |
| 22 | Silver City | 9,574 | 66 | 0.69% |
| 23 | Sunland Park | 17,085 | 74 | 0.43% |
| 24 | Bernalillo | 9,068 | 34 | 0.37% |
| 25 | Belen | 7,427 | 27 | 0.36% |
| 26 | Socorro | 8,540 | 30 | 0.35% |
| 27 | Raton | 6,013 | 21 | 0.35% |
| 28 | Truth Or Consequences | 6,026 | 20 | 0.33% |
| 29 | Bloomfield | 7,391 | 12 | 0.16% |
| 30 | Taos | 6,468 | 8 | 0.12% |
| 31 | Aztec | 6,177 | 0 | 0.0% |
| 32 | Artesia | 12,555 | 0 | 0.0% |
Nice article, it would be great if you included the median income for the cities.