
Most African American cities in Oklahoma research summary. We used Saturday Night Science to analyze Oklahoma’s most recent Census data to determine the blackest cities in Oklahoma based on the percentage of Black residents. Here are the results of our analysis:
-
The city with the largest African American population in Oklahoma is Midwest City based on the most recent Census data.
-
Midwest City is 22.63% Black.
-
The least African American city in Oklahoma is Tuttle.
-
Tuttle is 0.09% Black.
-
Oklahoma is 6.9% Black.
-
Oklahoma is the 25th blackest state in the United States.
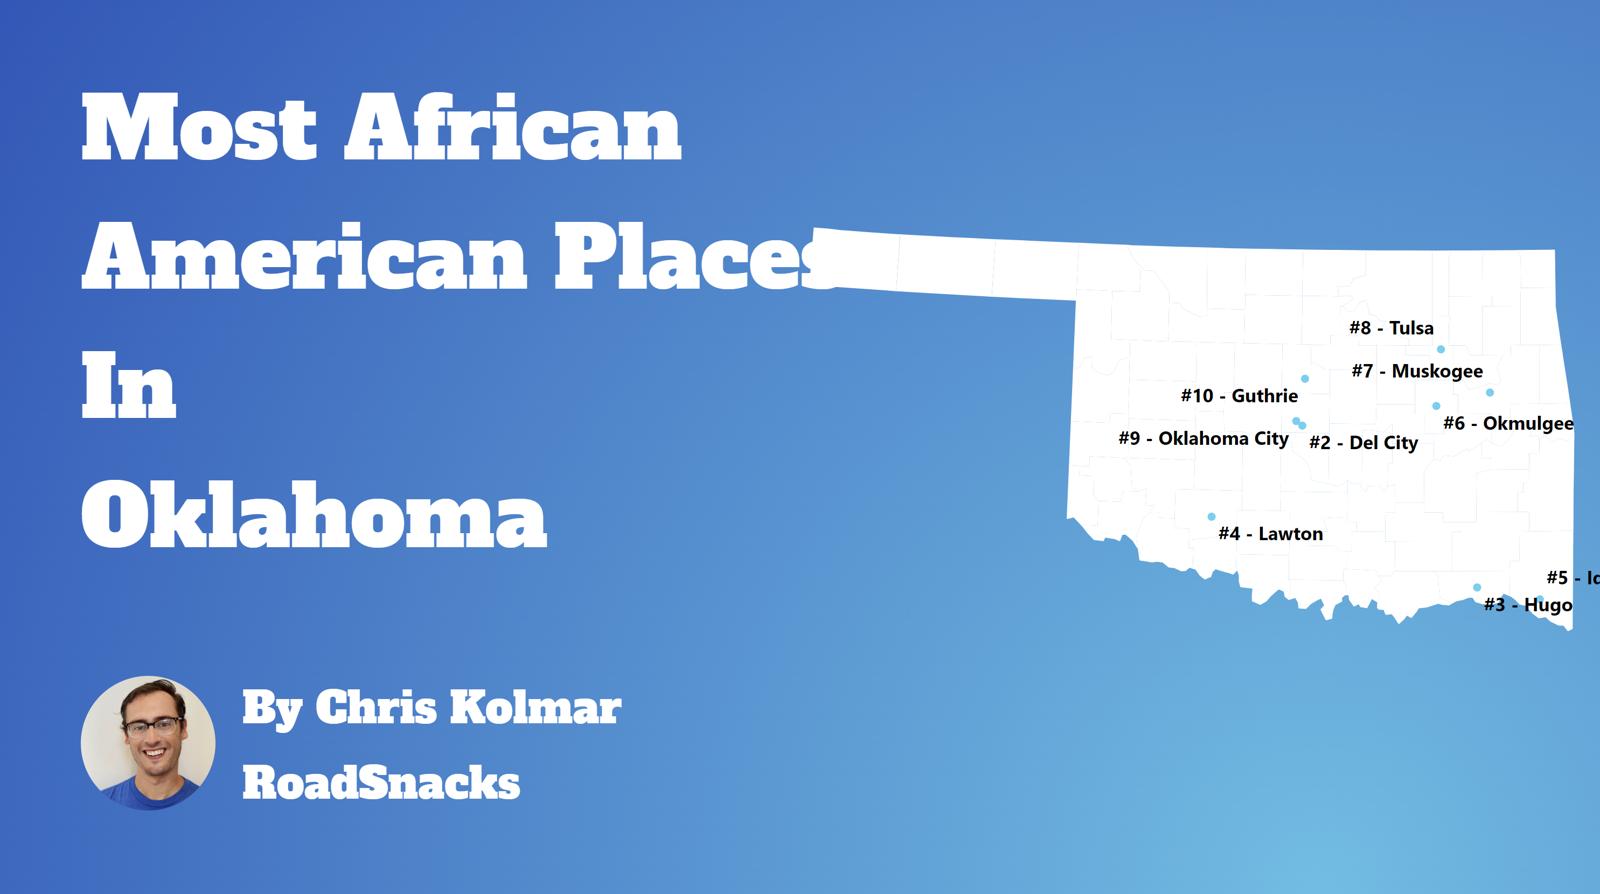
Table Of Contents: Top Ten | Methodology | Summary | Table
The Black community is one of the fastest-growing communities in America this decade.
Roughly 42 million people identifying as Black or African American live in the United States, making up 12% of the total population. According to the most recent American Community Survey, the Black population in Oklahoma is 274,899 – at 6.9% of the total population of Oklahoma.
The percentage growth of Blacks in America is the third largest percentage change for any race according to the Census’s race and ethnicity definition. Most scholars and historians agree that increasing diversity in America is a good thing.
We agree.
But how has the increase in the black population impacted Oklahoma? Which cities and towns in Oklahoma have seen the greatest increase in its Black population?
We broke down the most recent census data to determine the cities in Oklahoma with the largest African American population in 2025:
Most African American Places In Oklahoma
What’s the blackest city in Oklahoma? The city with the largest Black population in Oklahoma for 2025 is Midwest City. See if Midwest City ranked as one of the most african american places in America.
And if you already knew these places were Black, check out the best places to live in Oklahoma or the most diverse places in Oklahoma.
The 10 Blackest Cities In Oklahoma For 2025
1. Midwest City

/10
Population: 58,170
% African American: 22.63%
# Of African American Residents: 13,162
Percent Change Since 2010: 22.67%
More on Midwest City: Data
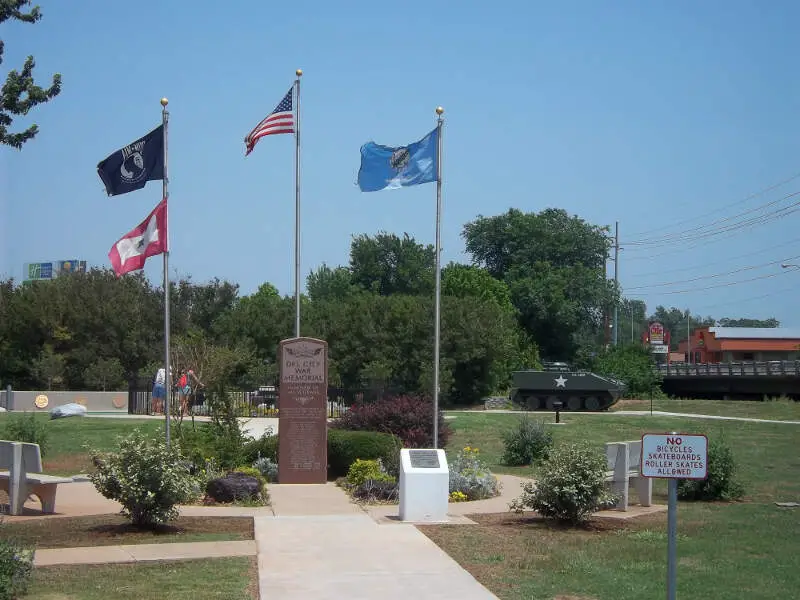
2. Del City
/10
Population: 21,561
% African American: 20.61%
# Of African American Residents: 4,444
Percent Change Since 2010: 2.16%
More on Del City: Data
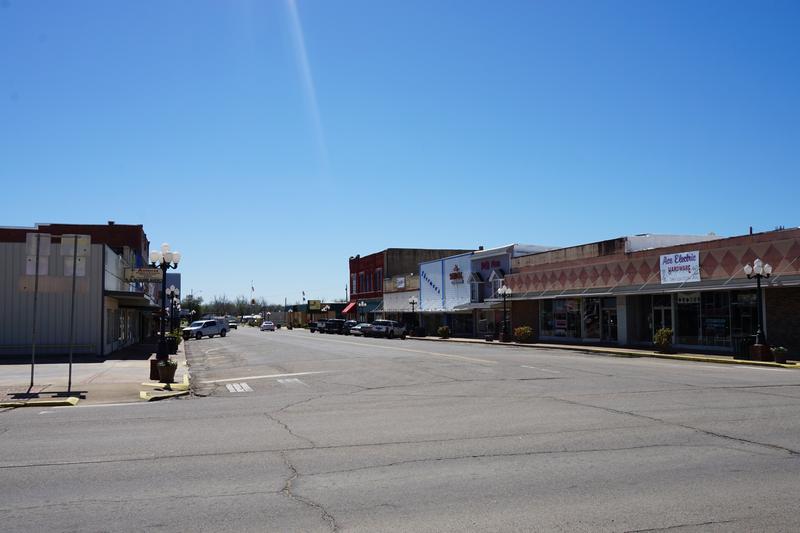
3. Hugo
/10
Population: 5,184
% African American: 19.33%
# Of African American Residents: 1,002
Percent Change Since 2010: 3.19%
More on Hugo: Data
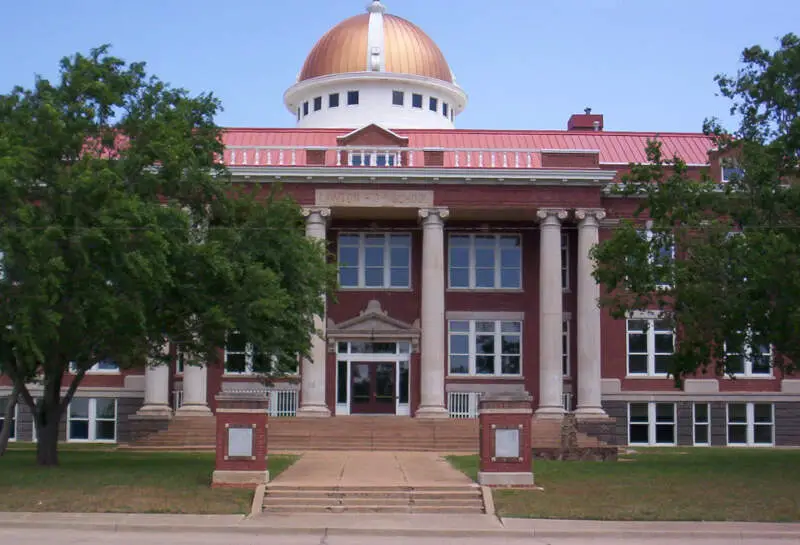
4. Lawton
/10
Population: 90,662
% African American: 17.6%
# Of African American Residents: 15,953
Percent Change Since 2010: -18.93%
More on Lawton: Data
5. Idabel
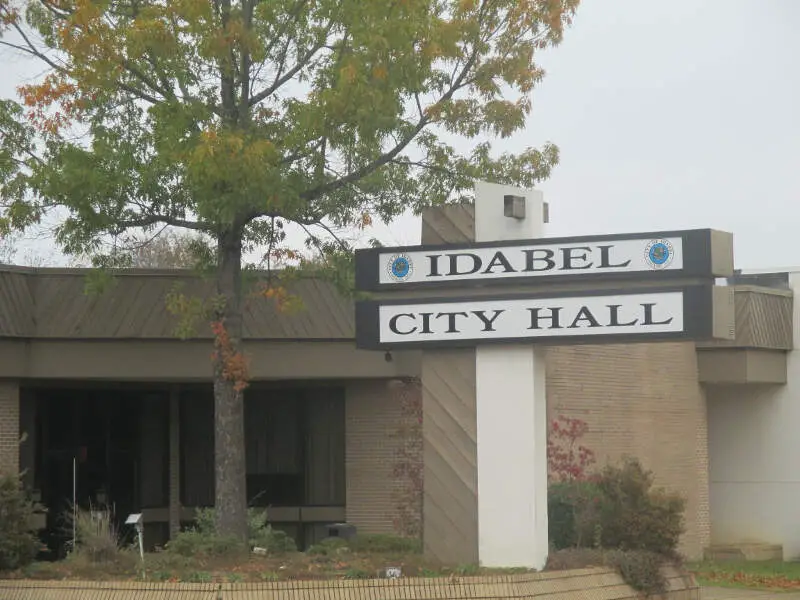
/10
Population: 6,959
% African American: 16.83%
# Of African American Residents: 1,171
Percent Change Since 2010: -28.29%
More on Idabel: Data
6. Muskogee
/10
Population: 36,819
% African American: 14.63%
# Of African American Residents: 5,388
Percent Change Since 2010: -10.16%
More on Muskogee: Data
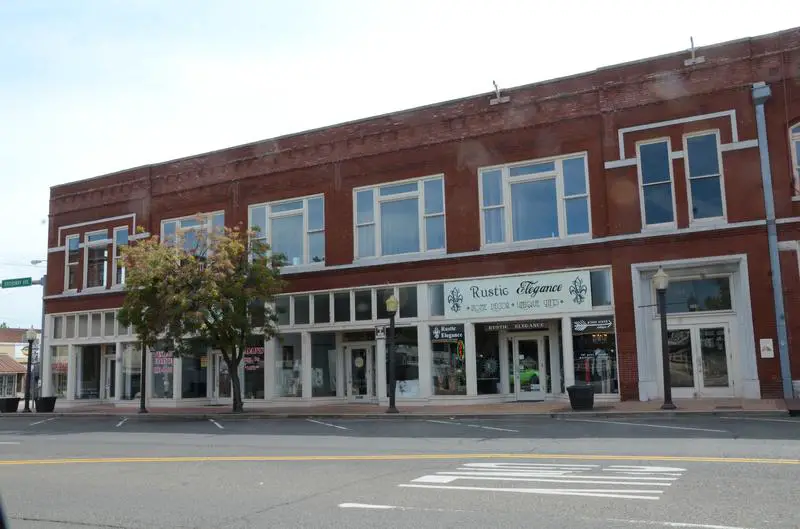
7. Okmulgee
/10
Population: 11,370
% African American: 14.6%
# Of African American Residents: 1,660
Percent Change Since 2010: -27.64%
More on Okmulgee: Data
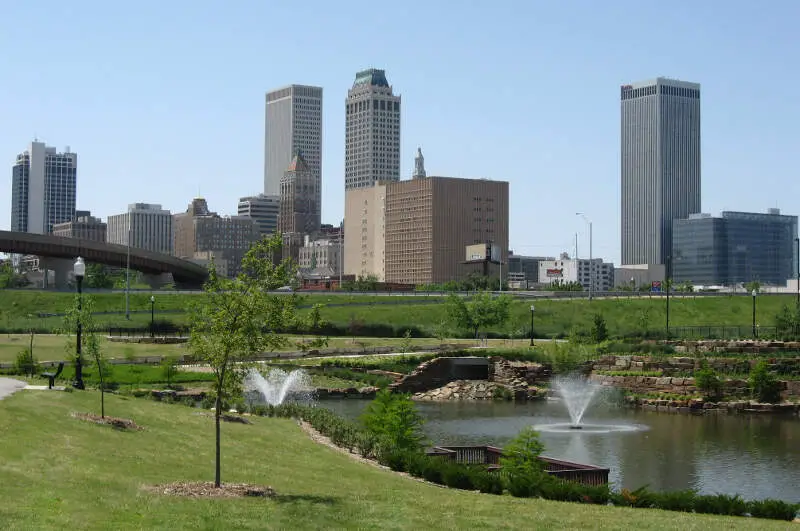
8. Tulsa

/10
Population: 412,322
% African American: 14.02%
# Of African American Residents: 57,809
Percent Change Since 2010: -3.04%
More on Tulsa: Data
9. Oklahoma City
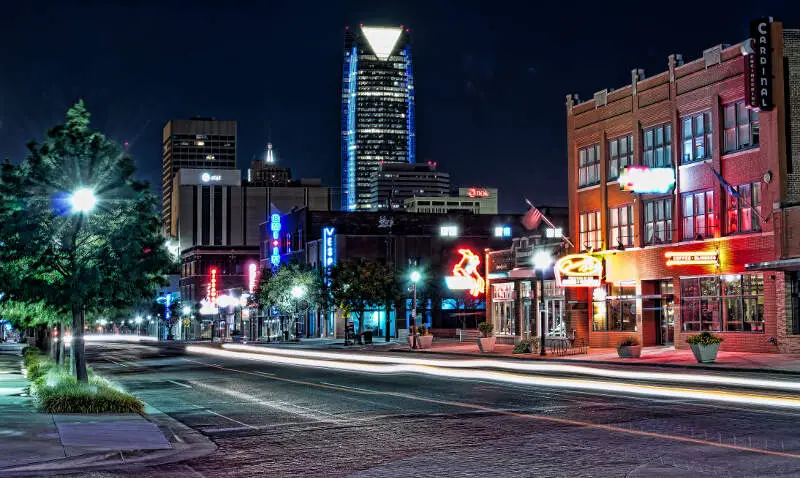
/10
Population: 688,693
% African American: 13.07%
# Of African American Residents: 90,042
Percent Change Since 2010: 12.26%
More on Oklahoma City: Data
10. Guthrie
/10
Population: 11,021
% African American: 12.6%
# Of African American Residents: 1,389
Percent Change Since 2010: -20.4%
More on Guthrie: Data
Methodology: How We Determined The Cities In Oklahoma With The Largest Black Population For 2025
We still believe in the accuracy of data — especially from the Census. So that’s where we went to get the race breakdown across Oklahoma.
That leads us to the Census’s most recently available data, the 2019-2023 American Community Survey data from the US Census.
Specifically, we looked at table B03002: Hispanic OR LATINO ORIGIN BY RACE. Here are the category names as defined by the Census:
- Hispanic or Latino
- White alone*
- Black or African American alone*
- American Indian and Alaska Native alone*
- Asian alone*
- Native Hawaiian and Other Pacific Islander alone*
- Some other race alone*
- Two or more races*
Our particular column of interest was the number of people who identified as Black or African American.
We limited our analysis to non-CDPs with a population greater than 5,000 people in Oklahoma. That left us with 71 cities.
We then calculated the percentage of residents that are Black or African American. The percentages ranked from 22.6% to 0.1%.
Finally, we ranked each city based on the percentage of the Black population, with a higher score being more Black than a lower score. Midwest City took the distinction of being the most Black, while Tuttle was the least African American city.
We updated this article for 2025. This is our tenth time ranking the cities in Oklahoma with the largest African American population.
Read on for more information on how the cities in Oklahoma ranked by population of African American residents or, for a more general take on diversity in America, head over to our ranking of the most diverse cities in America.
Summary: Black Populations Across Oklahoma
If you’re looking for a breakdown of African American populations across Oklahoma according to the most recent data, this is an accurate list.
The blackest cities in Oklahoma are Midwest City, Del City, Hugo, Lawton, Idabel, Muskogee, Okmulgee, Tulsa, Oklahoma City, and Guthrie.
If you’re curious enough, here are the least African American places in Oklahoma:
- Tuttle
- Henryetta
- Pryor Creek
For more Oklahoma reading, check out:
- Most Dangerous Cities In Oklahoma
- Safest Places In Oklahoma
- Best Places To Raise A Family In Oklahoma
African American Population By City In Oklahoma
| Rank | City | Population | African American Population | % African American |
|---|---|---|---|---|
| 1 | Midwest City | 58,170 | 13,162 | 22.63% |
| 2 | Del City | 21,561 | 4,444 | 20.61% |
| 3 | Hugo | 5,184 | 1,002 | 19.33% |
| 4 | Lawton | 90,662 | 15,953 | 17.6% |
| 5 | Idabel | 6,959 | 1,171 | 16.83% |
| 6 | Muskogee | 36,819 | 5,388 | 14.63% |
| 7 | Okmulgee | 11,370 | 1,660 | 14.6% |
| 8 | Tulsa | 412,322 | 57,809 | 14.02% |
| 9 | Oklahoma City | 688,693 | 90,042 | 13.07% |
| 10 | Guthrie | 11,021 | 1,389 | 12.6% |
| 11 | Bethany | 20,606 | 2,236 | 10.85% |
| 12 | Holdenville | 5,916 | 548 | 9.26% |
| 13 | Warr Acres | 10,437 | 958 | 9.18% |
| 14 | Ardmore | 24,757 | 2,059 | 8.32% |
| 15 | Anadarko | 5,627 | 462 | 8.21% |
| 16 | The Village | 9,470 | 745 | 7.87% |
| 17 | Altus | 18,670 | 1,387 | 7.43% |
| 18 | El Reno | 17,919 | 1,207 | 6.74% |
| 19 | Guymon | 12,596 | 814 | 6.46% |
| 20 | Chickasha | 16,349 | 1,055 | 6.45% |
| 21 | Wagoner | 7,934 | 460 | 5.8% |
| 22 | Broken Arrow | 115,919 | 6,720 | 5.8% |
| 23 | Clinton | 8,461 | 463 | 5.47% |
| 24 | Moore | 63,045 | 3,304 | 5.24% |
| 25 | Coweta | 10,157 | 528 | 5.2% |
| 26 | Seminole | 7,161 | 367 | 5.12% |
| 27 | Edmond | 95,618 | 4,791 | 5.01% |
| 28 | Pauls Valley | 6,031 | 296 | 4.91% |
| 29 | Ada | 16,536 | 810 | 4.9% |
| 30 | Norman | 128,714 | 6,134 | 4.77% |
| 31 | Stillwater | 48,818 | 2,318 | 4.75% |
| 32 | Mcalester | 18,098 | 848 | 4.69% |
| 33 | Shawnee | 31,511 | 1,312 | 4.16% |
| 34 | Glenpool | 13,885 | 547 | 3.94% |
| 35 | Cushing | 8,336 | 319 | 3.83% |
| 36 | Vinita | 5,229 | 198 | 3.79% |
| 37 | Bartlesville | 37,559 | 1,412 | 3.76% |
| 38 | Sapulpa | 22,268 | 780 | 3.5% |
| 39 | Owasso | 39,013 | 1,355 | 3.47% |
| 40 | Yukon | 24,802 | 840 | 3.39% |
| 41 | Mustang | 21,290 | 690 | 3.24% |
| 42 | Ponca City | 24,377 | 782 | 3.21% |
| 43 | Piedmont | 7,978 | 239 | 3.0% |
| 44 | Collinsville | 8,468 | 251 | 2.96% |
| 45 | Jenks | 26,519 | 756 | 2.85% |
| 46 | Durant | 19,209 | 497 | 2.59% |
| 47 | Tecumseh | 6,320 | 155 | 2.45% |
| 48 | Duncan | 22,872 | 517 | 2.26% |
| 49 | Tahlequah | 16,513 | 373 | 2.26% |
| 50 | Enid | 50,821 | 1,125 | 2.21% |
| 51 | Weatherford | 12,014 | 260 | 2.16% |
| 52 | Sallisaw | 8,553 | 175 | 2.05% |
| 53 | Miami | 12,960 | 257 | 1.98% |
| 54 | Sand Springs | 19,973 | 385 | 1.93% |
| 55 | Bixby | 29,402 | 562 | 1.91% |
| 56 | Harrah | 6,377 | 120 | 1.88% |
| 57 | Newcastle | 12,238 | 228 | 1.86% |
| 58 | Claremore | 19,921 | 367 | 1.84% |
| 59 | Noble | 7,337 | 123 | 1.68% |
| 60 | Elk City | 11,406 | 187 | 1.64% |
| 61 | Poteau | 8,903 | 133 | 1.49% |
| 62 | Catoosa | 7,631 | 113 | 1.48% |
| 63 | Purcell | 6,716 | 95 | 1.41% |
| 64 | Blackwell | 6,091 | 62 | 1.02% |
| 65 | Choctaw | 12,208 | 113 | 0.93% |
| 66 | Blanchard | 9,276 | 85 | 0.92% |
| 67 | Grove | 7,101 | 48 | 0.68% |
| 68 | Woodward | 11,976 | 57 | 0.48% |
| 69 | Pryor Creek | 9,520 | 38 | 0.4% |
| 70 | Henryetta | 5,631 | 16 | 0.28% |
| 71 | Tuttle | 7,785 | 7 | 0.09% |
The image of Okmulgee is incorrect. Please note or correct.
Thanks much for the information. As a Black Historian this data is very important and useful.
I guess they will do neither…