
Most African American cities in Virginia research summary. We used Saturday Night Science to analyze Virginia’s most recent Census data to determine the blackest cities in Virginia based on the percentage of Black residents. Here are the results of our analysis:
-
The city with the largest African American population in Virginia is Petersburg based on the most recent Census data.
-
Petersburg is 74.22% Black.
-
The least African American city in Virginia is Richlands.
-
Richlands is 0.06% Black.
-
Virginia is 18.3% Black.
-
Virginia is the 9th blackest state in the United States.
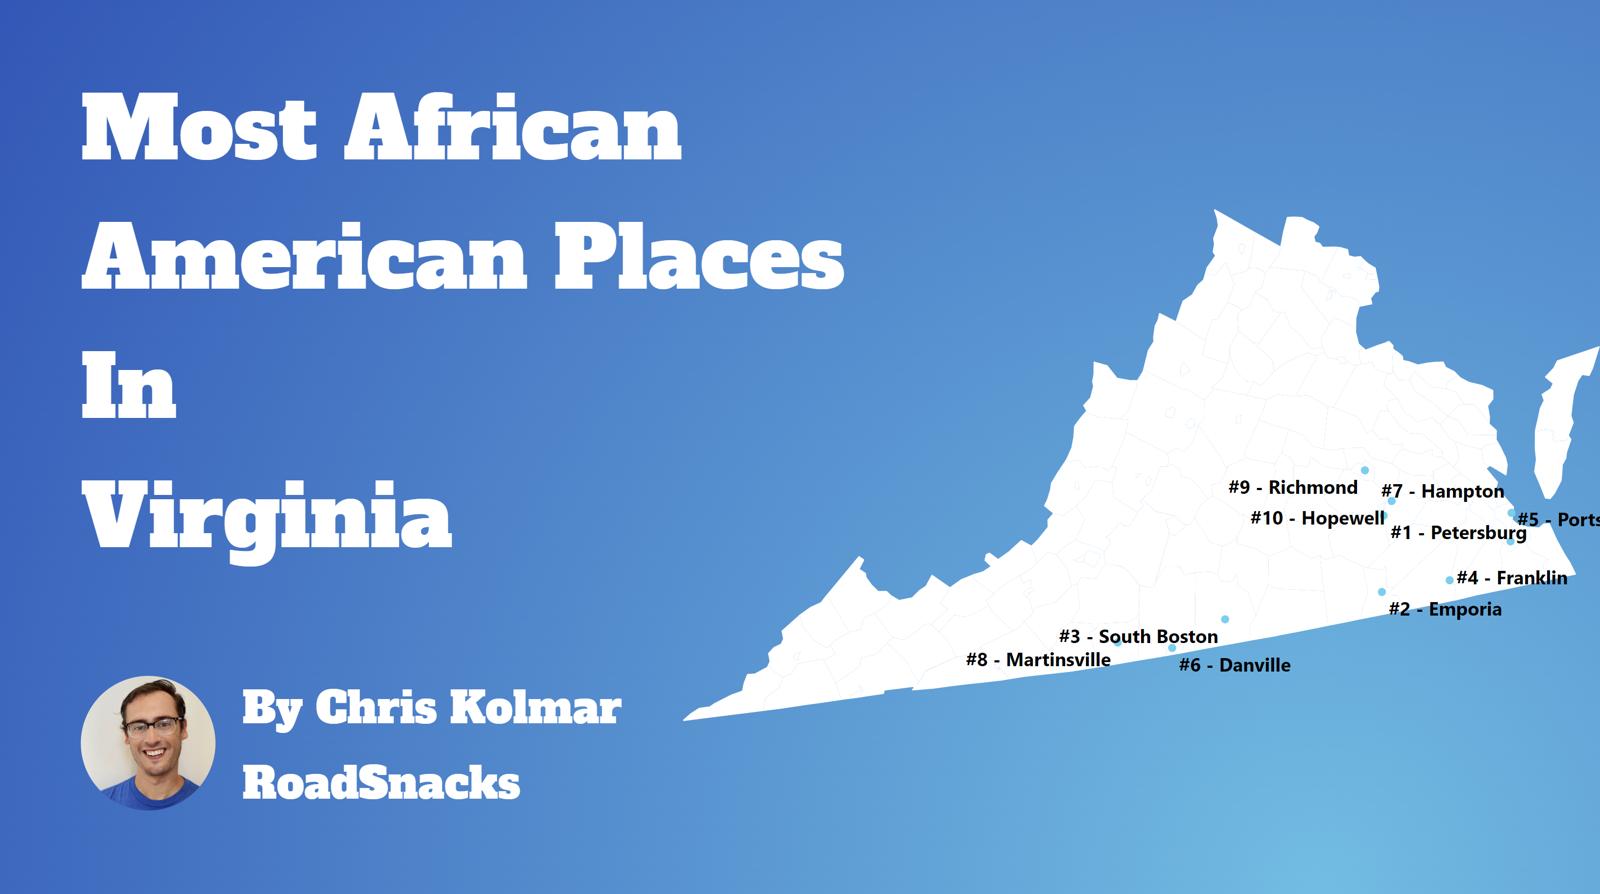
Table Of Contents: Top Ten | Methodology | Summary | Table
The Black community is one of the fastest-growing communities in America this decade.
Roughly 42 million people identifying as Black or African American live in the United States, making up 12% of the total population. According to the most recent American Community Survey, the Black population in Virginia is 1,589,523 – at 18.3% of the total population of Virginia.
The percentage growth of Blacks in America is the third largest percentage change for any race according to the Census’s race and ethnicity definition. Most scholars and historians agree that increasing diversity in America is a good thing.
We agree.
But how has the increase in the black population impacted Virginia? Which cities and towns in Virginia have seen the greatest increase in its Black population?
We broke down the most recent census data to determine the cities in Virginia with the largest African American population in 2026:
Most African American Places In Virginia
What’s the blackest city in Virginia? The city with the largest Black population in Virginia for 2026 is Petersburg. See if Petersburg ranked as one of the most african american places in America.
And if you already knew these places were Black, check out the best places to live in Virginia or the most diverse places in Virginia.
The 10 Blackest Cities In Virginia For 2026
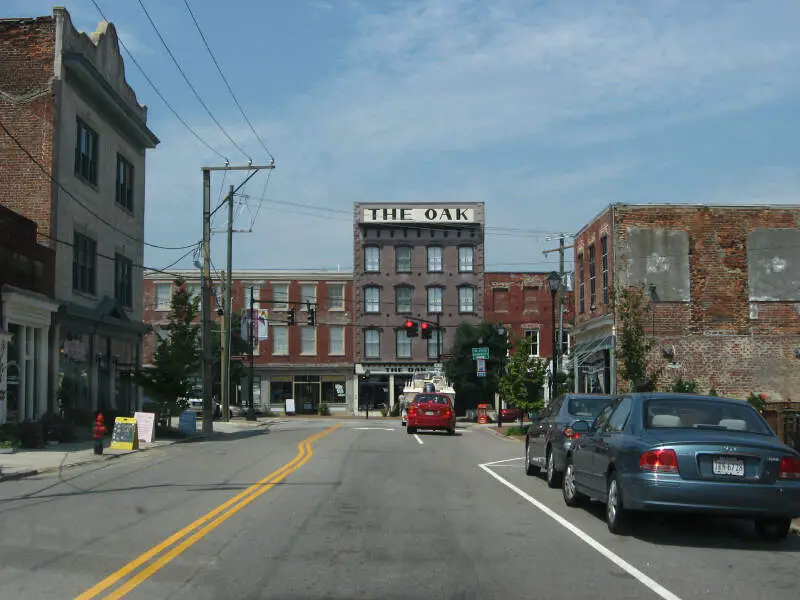
1. Petersburg
/10
Population: 33,537
% African American: 74.22%
# Of African American Residents: 24,890
Percent Change Since 2010: -2.64%
More on Petersburg: Data | Cost Of Living | Movers
2. Emporia
/10
Population: 5,547
% African American: 64.34%
# Of African American Residents: 3,569
Percent Change Since 2010: -1.98%
More on Emporia: Data | Cost Of Living | Movers
3. Franklin
/10
Population: 8,250
% African American: 54.84%
# Of African American Residents: 4,524
Percent Change Since 2010: -6.28%
More on Franklin: Data | Cost Of Living | Movers
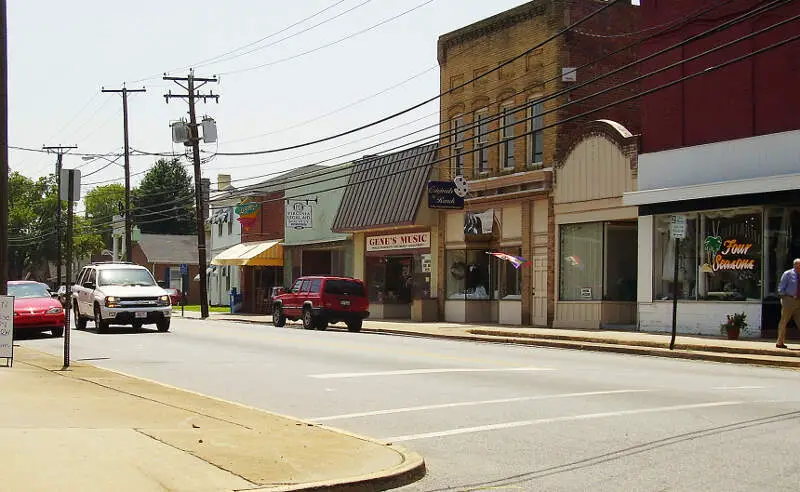
4. Danville
/10
Population: 42,214
% African American: 50.47%
# Of African American Residents: 21,304
Percent Change Since 2010: 1.29%
More on Danville: Data | Cost Of Living | Movers
5. Portsmouth
/10
Population: 97,190
% African American: 50.19%
# Of African American Residents: 48,784
Percent Change Since 2010: -2.85%
More on Portsmouth: Data | Cost Of Living | Movers
6. South Boston
/10
Population: 7,853
% African American: 49.96%
# Of African American Residents: 3,923
Percent Change Since 2010: 0.18%
More on South Boston: Data | Cost Of Living | Movers
7. Hampton
/10
Population: 137,557
% African American: 48.12%
# Of African American Residents: 66,188
Percent Change Since 2010: -2.0%
More on Hampton: Data | Cost Of Living | Movers
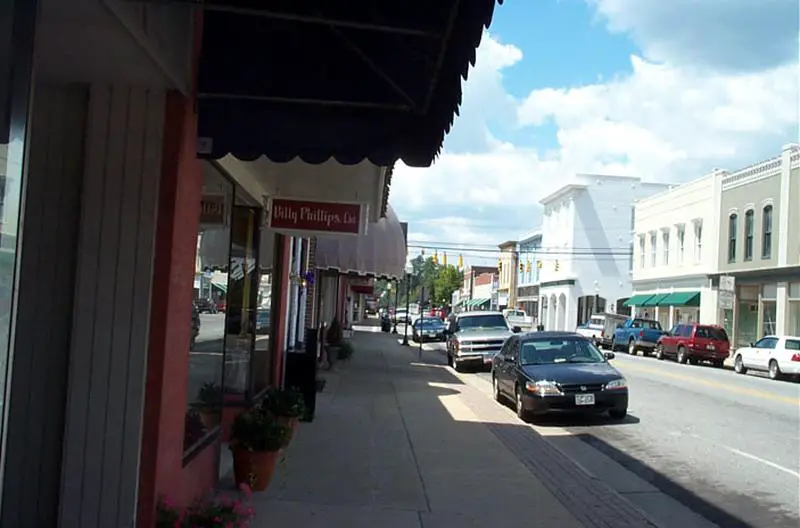
8. Martinsville
/10
Population: 13,658
% African American: 43.92%
# Of African American Residents: 5,999
Percent Change Since 2010: -4.2%
More on Martinsville: Data | Cost Of Living | Movers
9. Hopewell
/10
Population: 22,959
% African American: 41.57%
# Of African American Residents: 9,545
Percent Change Since 2010: 11.81%
More on Hopewell: Data | Cost Of Living | Movers
10. Suffolk
/10
Population: 98,796
% African American: 41.57%
# Of African American Residents: 41,068
Percent Change Since 2010: 19.99%
More on Suffolk: Data | Cost Of Living | Movers
Methodology: How We Determined The Cities In Virginia With The Largest Black Population For 2026
We still believe in the accuracy of data — especially from the Census. So that’s where we went to get the race breakdown across Virginia.
That leads us to the Census’s most recently available data, the 2020-2024 American Community Survey data from the US Census.
Specifically, we looked at table B03002: Hispanic OR LATINO ORIGIN BY RACE. Here are the category names as defined by the Census:
- Hispanic or Latino
- White alone*
- Black or African American alone*
- American Indian and Alaska Native alone*
- Asian alone*
- Native Hawaiian and Other Pacific Islander alone*
- Some other race alone*
- Two or more races*
Our particular column of interest was the number of people who identified as Black or African American.
We limited our analysis to non-CDPs with a population greater than 5,000 people in Virginia. That left us with 59 cities.
We then calculated the percentage of residents that are Black or African American. The percentages ranked from 74.2% to 0.1%.
Finally, we ranked each city based on the percentage of the Black population, with a higher score being more Black than a lower score. Petersburg took the distinction of being the most Black, while Richlands was the least African American city.
We updated this article for 2026. This is our eleventh time ranking the cities in Virginia with the largest African American population.
Read on for more information on how the cities in Virginia ranked by population of African American residents or, for a more general take on diversity in America, head over to our ranking of the most diverse cities in America.
Summary: Black Populations Across Virginia
If you’re looking for a breakdown of African American populations across Virginia according to the most recent data, this is an accurate list.
The blackest cities in Virginia are Petersburg, Emporia, Franklin, Danville, Portsmouth, South Boston, Hampton, Martinsville, Hopewell, and Suffolk.
If you’re curious enough, here are the least African American places in Virginia:
- Richlands
- Vinton
- Poquoson
For more Virginia reading, check out:
- Best Places To Raise A Family In Virginia
- Cheapest Places To Live In Virginia
- Most Dangerous Cities In Virginia
African American Population By City In Virginia
| Rank | City | Population | African American Population | % African American |
|---|---|---|---|---|
| 1 | Petersburg | 33,537 | 24,890 | 74.22% |
| 2 | Emporia | 5,547 | 3,569 | 64.34% |
| 3 | Franklin | 8,250 | 4,524 | 54.84% |
| 4 | Danville | 42,214 | 21,304 | 50.47% |
| 5 | Portsmouth | 97,190 | 48,784 | 50.19% |
| 6 | South Boston | 7,853 | 3,923 | 49.96% |
| 7 | Hampton | 137,557 | 66,188 | 48.12% |
| 8 | Martinsville | 13,658 | 5,999 | 43.92% |
| 9 | Hopewell | 22,959 | 9,545 | 41.57% |
| 10 | Suffolk | 98,796 | 41,068 | 41.57% |
| 11 | Newport News | 184,216 | 74,745 | 40.57% |
| 12 | Richmond | 229,359 | 93,026 | 40.56% |
| 13 | Norfolk | 233,596 | 90,856 | 38.89% |
| 14 | Chesapeake | 252,583 | 71,944 | 28.48% |
| 15 | Roanoke | 98,355 | 27,236 | 27.69% |
| 16 | Lynchburg | 79,497 | 21,483 | 27.02% |
| 17 | Farmville | 7,774 | 1,993 | 25.64% |
| 18 | Alexandria | 156,976 | 32,969 | 21.0% |
| 19 | Fredericksburg | 28,873 | 5,603 | 19.41% |
| 20 | Ashland | 7,772 | 1,494 | 19.22% |
| 21 | Colonial Heights | 18,352 | 3,432 | 18.7% |
| 22 | Virginia Beach | 456,349 | 82,972 | 18.18% |
| 23 | Smithfield | 8,834 | 1,557 | 17.63% |
| 24 | Culpeper | 20,794 | 3,489 | 16.78% |
| 25 | Big Stone Gap | 5,162 | 835 | 16.18% |
| 26 | Charlottesville | 45,437 | 7,026 | 15.46% |
| 27 | Williamsburg | 15,798 | 2,258 | 14.29% |
| 28 | Manassas Park | 16,798 | 2,282 | 13.58% |
| 29 | Covington | 5,680 | 720 | 12.68% |
| 30 | Manassas | 42,976 | 5,058 | 11.77% |
| 31 | Waynesboro | 22,841 | 2,491 | 10.91% |
| 32 | Staunton | 25,948 | 2,662 | 10.26% |
| 33 | Warrenton | 10,176 | 1,007 | 9.9% |
| 34 | Radford | 16,726 | 1,544 | 9.23% |
| 35 | Front Royal | 15,296 | 1,380 | 9.02% |
| 36 | Salem | 25,618 | 2,217 | 8.65% |
| 37 | Leesburg | 49,171 | 4,247 | 8.64% |
| 38 | Herndon | 24,672 | 2,007 | 8.13% |
| 39 | Winchester | 27,913 | 2,156 | 7.72% |
| 40 | Harrisonburg | 51,392 | 3,685 | 7.17% |
| 41 | Purcellville | 8,973 | 641 | 7.14% |
| 42 | Marion | 5,670 | 385 | 6.79% |
| 43 | Fairfax | 25,026 | 1,585 | 6.33% |
| 44 | Christiansburg | 22,720 | 1,347 | 5.93% |
| 45 | Lexington | 7,525 | 437 | 5.81% |
| 46 | Bristol | 16,849 | 969 | 5.75% |
| 47 | Strasburg | 7,214 | 408 | 5.66% |
| 48 | Galax | 6,726 | 331 | 4.92% |
| 49 | Vienna | 16,412 | 733 | 4.47% |
| 50 | Pulaski | 8,893 | 380 | 4.27% |
| 51 | Bridgewater | 6,708 | 281 | 4.19% |
| 52 | Abingdon | 8,330 | 337 | 4.05% |
| 53 | Blacksburg | 45,446 | 1,779 | 3.91% |
| 54 | Falls Church | 14,710 | 520 | 3.54% |
| 55 | Wytheville | 8,202 | 271 | 3.3% |
| 56 | Buena Vista | 6,593 | 134 | 2.03% |
| 57 | Poquoson | 12,639 | 238 | 1.88% |
| 58 | Vinton | 8,056 | 132 | 1.64% |
| 59 | Richlands | 5,171 | 3 | 0.06% |
I am a student at VCU studying Virginia. Mini sources say that more black people than white people are arrested for possession of marijuana. In fact black people are three times more likely to be arrested for simple possession of marijuana. I am asking why. Some say it is because there is a higher presence of police officers and predominately black Neighborhoods. I ask myself why. Some say crime rates are higher in the predominately black neighborhoods. I want some statistics that show me that. I would think if you wanted to commit a crime you would go to the rich neighborhoods where they have silver and gold and other nice things to steal. I am doing research that supports legalizing the adult recreational use of Marijuana. I would like to find out that crime is not the highest and predominately black neighborhoods and that it is the same regardless of the Racial makeup of the neighborhood that you live in. What information do you have that could help me find out this information?
“As most scholars and historians agree, an increase in the diversity in America is a good thing.
We agree.”
Is that why the scores get higher the lower the percentage? Lol. Would like to get some of what those ‘scholars’ are smoking.