
There’s no denying it: there are plenty of places in New Jersey that are downright beautiful and full of excitement.
Unfortunately, not all towns and cities in Garden State are so lucky.
Just like in all U.S. States, there are definitely some boring places within New Jersey’s’ borders. You know the places where everyone has an AARP card and the most exciting thing they do all day is post a picture of their grandchild on Facebook.
Like Mountainside, for instance. In our latest analysis, we found that this city was the most boring city in all of Oklahoma according to Saturday Night Science. But don’t feel bad if you’re a resident of Mountainside. There are plenty of other boring, lackluster places in New Jersey as well.
Here they are. Try not to jump out of your seat with excitement.
Table Of Contents: Top Ten | Methodology | Summary | Table
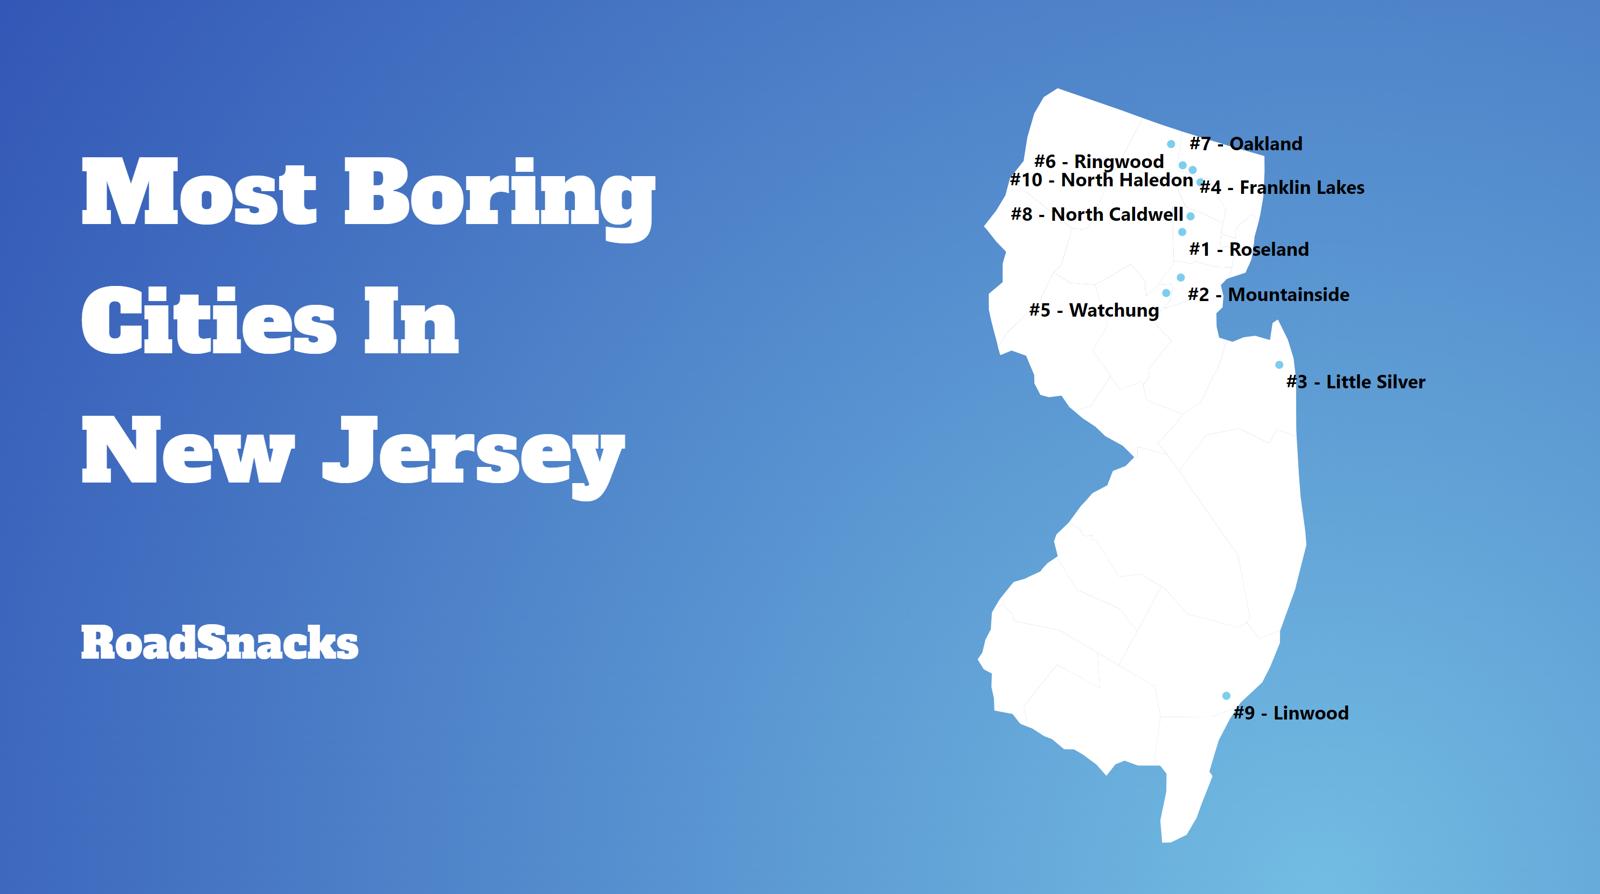
The 10 Most Boring Places In New Jersey
Don’t freak out, in fact, believe it not, a boring city is actually one a lot of people would like to call home.
Before you get all upset if your city’s name is on the list, rest assured that we didn’t use personal opinion when it comes to what classifies a city or town as “boring” or “exciting”. We crunched actual numbers to figure out which towns are statistically more boring.
Showing this data to you is the kind of thing that a real estate agent knows, but would never share.
For more New Jersey reading, check out:
The 10 Most Boring Places In New Jersey For 2026

/10
Average Age: 48.0
% Married: 32.0%
More on Mountainside: Data | Crime | Cost Of Living | Movers

/10
Average Age: 48.1
% Married: 28.0%
More on Watchung: Data | Crime | Cost Of Living | Movers

/10
Average Age: 47.6
% Married: 29.0%
More on Roseland: Data | Crime | Cost Of Living | Movers

/10
Average Age: 47.3
% Married: 30.0%
More on North Haledon: Data | Crime | Cost Of Living | Movers

/10
Average Age: 46.1
% Married: 38.0%
More on Little Silver: Data | Crime | Cost Of Living | Movers

/10
Average Age: 47.1
% Married: 34.0%
More on Rockaway: Data | Crime | Cost Of Living | Movers

/10
Average Age: 46.3
% Married: 25.0%
More on Franklin Lakes: Data | Crime | Cost Of Living | Movers

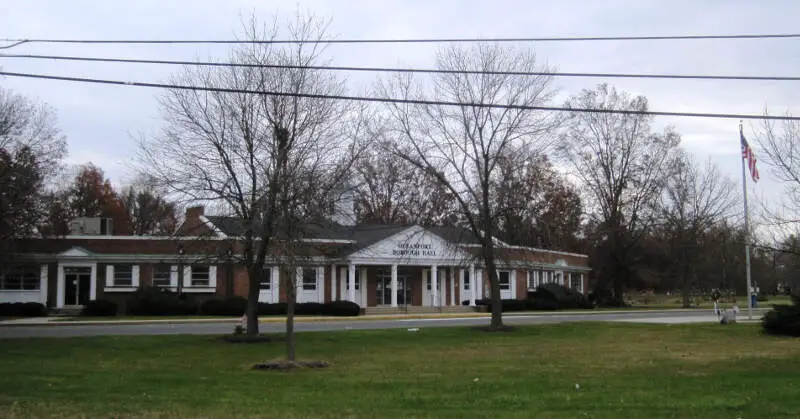
/10
Average Age: 51.3
% Married: 37.0%
More on Oceanport: Data | Crime | Cost Of Living | Movers

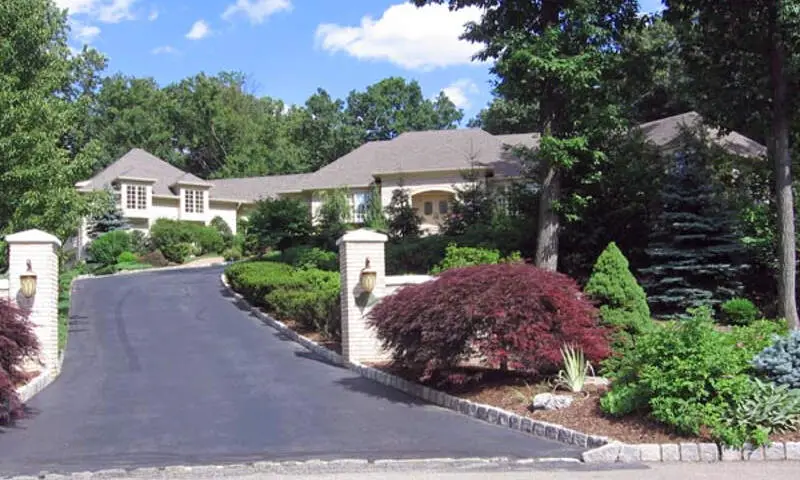
/10
Average Age: 43.6
% Married: 36.0%
More on North Caldwell: Data | Crime | Cost Of Living | Movers

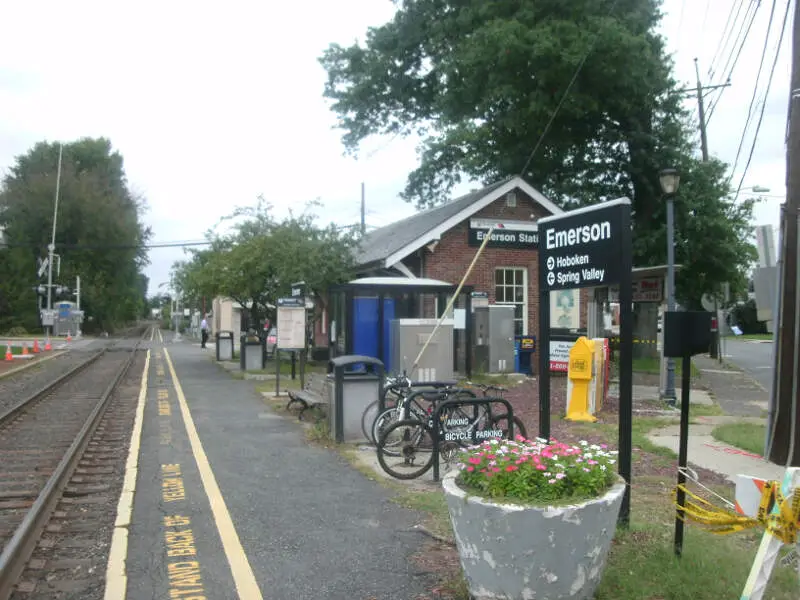
/10
Average Age: 48.8
% Married: 29.0%
More on Emerson: Data | Crime | Cost Of Living | Movers
Methodology: How we determined the boring cities in the Garden State
You would present the following case to your friends if you were argueing with them at a bar about the most boring place to live in New Jersey. And that’s why we call it Saturday Night Science.
Because our data speaks more truth than feelings.
To figure out how boring a place is, we factored in things we generally think make people exciting, and then we figure out which cities have the least number of those exciting people.
We used the U.S. American Community Census data to gather the information presented here. HSome of the things people tend to think of as making a city’s population boring include:
- % of Population Over 25 (higher is more boring)
- % of Married Household (higher is more boring)
- Average Age (higher is more boring)
- % of Households With Kids (higher is more boring)
- Population density (lower is more boring)
Then, our algorithm generates a ranking for each place in these categories. After crunching the numbers, all of the cities ranked from most boring to most exciting.
For this ranking, we used every New Jersey city with at least 5,000 residents. This keeps us from prejudicing our rankings by including very small pockets of retired people.
Grab your rocker and hold on.
We updated this article for 2026, and it’s our eleventh time ranking the most boring cities in New Jersey.
There You Have It – Now That You’re Asleep
On a ranking like this, there are usually no winners, but since New Jersey isn’t necessarily the most boring state in the United States, the cities on this ranking can at least take solace that there are, in fact, more boring cities in the country.
The most boring cities in New Jersey are Mountainside, Watchung, Roseland, North Haledon, Little Silver, Rockaway, Franklin Lakes, Oceanport, North Caldwell, and Emerson.
If you’re also curious enough, here are the most exciting places in New Jersey, according to science:
- New Brunswick
- Trenton
- Newark
For more New Jersey reading, check out:
- Best Places To Live In New Jersey
- Cheapest Places To Live In New Jersey
- Most Dangerous Cities In New Jersey
- Richest Cities In New Jersey
- Safest Places In New Jersey
- Worst Places To Live In New Jersey
- Most Expensive Places To Live In New Jersey
Detailed List Of The Most Boring Cities In New Jersey For 2026
| Rank | City | Population | Average Age | % Married | % Kids |
|---|---|---|---|---|---|
| 1 | Mountainside, NJ | 7,049 | 48.0 | 32.0% | 38.3% |
| 2 | Watchung, NJ | 6,485 | 48.1 | 28.0% | 34.7% |
| 3 | Roseland, NJ | 6,268 | 47.6 | 29.0% | 28.9% |
| 4 | North Haledon, NJ | 8,778 | 47.3 | 30.0% | 31.9% |
| 5 | Little Silver, NJ | 6,105 | 46.1 | 38.0% | 33.6% |
| 6 | Rockaway, NJ | 6,613 | 47.1 | 34.0% | 28.2% |
| 7 | Franklin Lakes, NJ | 11,084 | 46.3 | 25.0% | 41.2% |
| 8 | Oceanport, NJ | 6,195 | 51.3 | 37.0% | 30.3% |
| 9 | North Caldwell, NJ | 6,656 | 43.6 | 36.0% | 37.1% |
| 10 | Emerson, NJ | 7,305 | 48.8 | 29.0% | 32.7% |
| 11 | Union Beach, NJ | 5,707 | 42.0 | 29.0% | 33.3% |
| 12 | Tinton Falls, NJ | 19,361 | 46.6 | 29.0% | 22.9% |
| 13 | Ringwood, NJ | 11,657 | 42.6 | 32.0% | 26.6% |
| 14 | Kinnelon, NJ | 10,013 | 42.8 | 33.0% | 32.7% |
| 15 | Bernardsville, NJ | 7,916 | 40.0 | 33.0% | 36.5% |
| 16 | Lincoln Park, NJ | 10,957 | 48.3 | 22.0% | 23.9% |
| 17 | Rumson, NJ | 7,241 | 44.4 | 27.0% | 38.4% |
| 18 | Morris Plains, NJ | 6,315 | 41.7 | 30.0% | 28.6% |
| 19 | Point Pleasant, NJ | 19,334 | 46.1 | 38.0% | 29.0% |
| 20 | Woodcliff Lake, NJ | 6,152 | 45.4 | 19.0% | 42.5% |
| 21 | Linwood, NJ | 6,992 | 45.3 | 27.0% | 35.3% |
| 22 | Wanaque, NJ | 11,206 | 47.2 | 21.0% | 21.7% |
| 23 | Oakland, NJ | 12,768 | 40.7 | 31.0% | 36.8% |
| 24 | Hopatcong, NJ | 14,565 | 41.0 | 31.0% | 25.5% |
| 25 | Northfield, NJ | 8,456 | 43.7 | 28.0% | 29.6% |
| 26 | Mount Arlington, NJ | 5,935 | 48.1 | 24.0% | 17.6% |
| 27 | South Plainfield, NJ | 24,473 | 41.7 | 27.0% | 34.9% |
| 28 | Paramus, NJ | 26,568 | 49.1 | 16.0% | 32.2% |
| 29 | Millville, NJ | 27,511 | 44.4 | 28.0% | 24.9% |
| 30 | Englewood Cliffs, NJ | 5,362 | 49.8 | 10.0% | 33.6% |
| 31 | New Providence, NJ | 13,727 | 45.7 | 20.0% | 37.7% |
| 32 | Brigantine, NJ | 7,674 | 60.6 | 18.0% | 9.4% |
| 33 | Allendale, NJ | 6,865 | 45.2 | 20.0% | 40.1% |
| 34 | Spotswood, NJ | 8,171 | 46.0 | 26.0% | 26.6% |
| 35 | Middlesex, NJ | 14,645 | 44.3 | 27.0% | 30.5% |
| 36 | Newton, NJ | 8,369 | 42.5 | 27.0% | 28.0% |
| 37 | Totowa, NJ | 10,959 | 42.0 | 28.0% | 35.0% |
| 38 | Norwood, NJ | 5,724 | 48.2 | 14.0% | 36.9% |
| 39 | Upper Saddle River, NJ | 8,439 | 40.8 | 25.0% | 46.7% |
| 40 | Hammonton, NJ | 14,840 | 41.4 | 26.0% | 30.9% |
| 41 | Old Tappan, NJ | 6,008 | 44.4 | 15.0% | 42.4% |
| 42 | Manasquan, NJ | 5,922 | 48.3 | 37.0% | 24.0% |
| 43 | Hillsdale, NJ | 10,144 | 42.7 | 28.0% | 35.4% |
| 44 | Park Ridge, NJ | 9,406 | 47.0 | 24.0% | 30.9% |
| 45 | Clementon, NJ | 5,410 | 42.6 | 27.0% | 26.0% |
| 46 | Oradell, NJ | 8,235 | 43.4 | 22.0% | 44.8% |
| 47 | Wharton, NJ | 7,318 | 46.3 | 19.0% | 21.5% |
| 48 | Bloomingdale, NJ | 7,716 | 43.8 | 25.0% | 22.8% |
| 49 | Montvale, NJ | 8,901 | 40.1 | 22.0% | 37.0% |
| 50 | Barrington, NJ | 7,076 | 44.3 | 28.0% | 18.9% |
| 51 | Somerdale, NJ | 5,581 | 42.3 | 21.0% | 27.7% |
| 52 | Belmar, NJ | 5,869 | 49.5 | 23.0% | 13.4% |
| 53 | Clayton, NJ | 8,921 | 39.8 | 23.0% | 31.3% |
| 54 | Fair Haven, NJ | 6,170 | 40.1 | 31.0% | 47.9% |
| 55 | Hawthorne, NJ | 19,628 | 42.4 | 26.0% | 30.3% |
| 56 | Waldwick, NJ | 10,164 | 40.5 | 29.0% | 37.9% |
| 57 | Beachwood, NJ | 11,088 | 42.5 | 32.0% | 28.8% |
| 58 | South Amboy, NJ | 9,989 | 42.4 | 24.0% | 28.6% |
| 59 | Pitman, NJ | 8,856 | 40.7 | 28.0% | 26.5% |
| 60 | Wildwood, NJ | 5,130 | 45.2 | 20.0% | 21.1% |
| 61 | Pompton Lakes, NJ | 11,047 | 39.7 | 31.0% | 31.1% |
| 62 | Manville, NJ | 10,921 | 44.9 | 20.0% | 24.6% |
| 63 | Carlstadt, NJ | 6,378 | 44.7 | 27.0% | 18.9% |
| 64 | Midland Park, NJ | 7,019 | 41.8 | 34.0% | 24.4% |
| 65 | Absecon, NJ | 9,170 | 38.2 | 26.0% | 32.0% |
| 66 | River Edge, NJ | 12,091 | 43.6 | 21.0% | 35.6% |
| 67 | Ramsey, NJ | 14,805 | 41.8 | 19.0% | 35.5% |
| 68 | Butler, NJ | 8,133 | 40.3 | 26.0% | 27.5% |
| 69 | East Rutherford, NJ | 10,313 | 38.2 | 17.0% | 31.3% |
| 70 | Raritan, NJ | 8,368 | 41.3 | 24.0% | 20.6% |
| 71 | Vineland, NJ | 61,006 | 38.8 | 24.0% | 34.9% |
| 72 | Somers Point, NJ | 10,515 | 43.6 | 20.0% | 21.4% |
| 73 | Haddon Heights, NJ | 7,516 | 41.6 | 29.0% | 26.6% |
| 74 | Summit, NJ | 22,705 | 41.8 | 16.0% | 38.2% |
| 75 | Leonia, NJ | 9,336 | 45.9 | 8.0% | 33.8% |
| 76 | Fanwood, NJ | 7,799 | 43.4 | 23.0% | 32.5% |
| 77 | Maywood, NJ | 10,093 | 44.9 | 18.0% | 29.4% |
| 78 | Westwood, NJ | 11,283 | 41.4 | 21.0% | 33.1% |
| 79 | Hasbrouck Heights, NJ | 12,115 | 44.3 | 19.0% | 34.7% |
| 80 | Tenafly, NJ | 15,319 | 42.2 | 9.0% | 51.1% |
| 81 | Woodland Park, NJ | 13,355 | 42.7 | 17.0% | 29.4% |
| 82 | Kenilworth, NJ | 8,401 | 38.5 | 23.0% | 37.8% |
| 83 | Cresskill, NJ | 9,174 | 44.8 | 11.0% | 37.1% |
| 84 | Westfield, NJ | 31,111 | 40.7 | 20.0% | 43.8% |
| 85 | Berlin, NJ | 7,539 | 39.0 | 21.0% | 35.3% |
| 86 | Haddonfield, NJ | 12,595 | 39.0 | 24.0% | 50.0% |
| 87 | Ridgewood, NJ | 26,308 | 41.6 | 18.0% | 43.6% |
| 88 | North Arlington, NJ | 16,461 | 40.1 | 23.0% | 28.1% |
| 89 | Boonton, NJ | 8,854 | 39.5 | 29.0% | 30.6% |
| 90 | Palmyra, NJ | 7,485 | 44.1 | 13.0% | 21.7% |
| 91 | Florham Park, NJ | 13,564 | 40.9 | 24.0% | 27.3% |
| 92 | Sayreville, NJ | 45,838 | 39.9 | 14.0% | 31.3% |
| 93 | Washington, NJ | 7,334 | 39.3 | 19.0% | 33.1% |
| 94 | Burlington, NJ | 9,993 | 40.3 | 18.0% | 28.4% |
| 95 | Metuchen, NJ | 15,144 | 39.1 | 23.0% | 37.6% |
| 96 | Linden, NJ | 44,192 | 40.1 | 10.0% | 32.7% |
| 97 | Wood-Ridge, NJ | 10,218 | 39.8 | 21.0% | 30.6% |
| 98 | Matawan, NJ | 9,710 | 34.7 | 21.0% | 31.9% |
| 99 | Ridgefield, NJ | 11,498 | 39.8 | 13.0% | 31.4% |
| 100 | Secaucus, NJ | 21,778 | 38.4 | 13.0% | 27.8% |
My goodness–what an education…in what, I’m not quite sure! I started reading this w/ inquisitiveness (how boring!!); but…I must admit I couldn’t help but laugh out loud as I continued reading. Whoever wrote these “ratings and views” etc. is not only talented and insightful, but hilariously funny and creative. I have a brother (the “genius” of my family) who is currently working at Harvard. He and I–growing up–shared a wacky sense of humor, etc. Your input is so true. But please don’t put down old folks (and no, I’m not that old yet)! Folks of all ages REALLY do matter…from infancy to the elderly! Thank you.
If it has a string, it must be totally silicone coated.
Nothing about New Jersey is boring