These Are The 10 Most Liberal Cities In California For 2019


We used science and data to determine which cities in California probably voted for Obama.

RoadSnacks is reader-supported. When you click through real estate links on our site, we earn an affiliate commission. Learn more.
Editor’s Note: We updated this article for 2019. This is our third time ranking the most liberal places to live in California.

Swipe left for slideshow. Article continues below.

Now that we’re starting up the election swing to decide not only our next President, but many other local statewide initiatives, it’s important to put into context the types of decisions that will be made in the coming years.

Who makes the decisions? Not the people getting elected. It’s the voters.

Specifically, we wanted to know which cities have the highest number of liberal voters in the Golden State?

In order to do so, we turned our sites on measuring how each city in California with populations greater than 5,000 voted and contributed to political campaigns in the past several years. The cities with the highest percentage of voters who voted Democrat and gave the most to liberals where named the most liberal cities in the state.

Here are the 10 most liberal places in California for 2019:

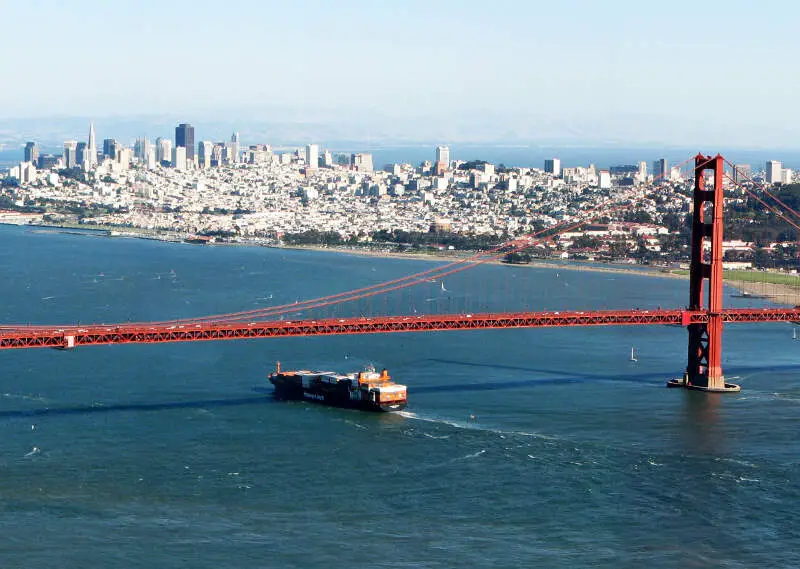
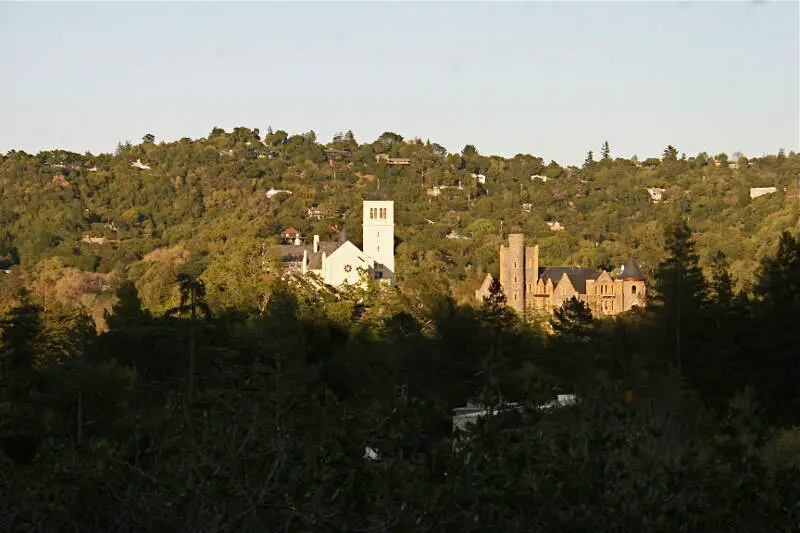
  1. San Francisco (Photos)
  2. Dublin (Photos)
  3. Livermore (Photos)
  4. Union City (Photos)
  5. Emeryville (Photos)
  6. Alameda (Photos)
  7. Pleasanton (Photos)
  8. Hayward (Photos)
  9. San Leandro (Photos)
  10. Newark (Photos)

If you’re wondering, Susanville is the most conservative city in California of all those we measured.

And to be clear, we didn’t form this list based on our own biases — we relied on the cold hard data. For more on how we ran the numbers, keep on reading. Then we’ll take a closer look at each of our top 10 most liberal cities in California.

And if you already knew these places were liberal, check out some more reading about California and the most lberal places in the country:

How we determined the most liberal cities in California for 2019

We started by making a list of every city in California over 5,000 people based on the 2013-2017 American Community Survey (The most recent data). That left us with 425 cities and towns.

We then measured the voting record and donation data to determine which places lean the most rightward in their allegiances by:

  1. Percentage Of Registered Democrats
  2. # Of Contributions To Democrats Per Capita
  3. $ Amount Contributed To Democrats Per Capita

Next, we ranked each city from 1 to 425 for each of the criteria where number one was the most liberal.

The winner, San Francisco, is “The Most liberal City in California For 2019”.

Let’s go through these liberal places, shall we?

The 10 Most liberal Places In California For 2019

San Francisco, CA

Overall SnackAbility

8.5
/10

Population: 864,263
Percent Democrat: 84.5%
$ Democrat Amount Per Capita: $282.97
# Democrat Contributions Per Capita: 0.34
More on San Francisco: PhotosData

Dublin, CA

Overall SnackAbility

9.5
/10

Population: 57,022
Percent Democrat: 78.1%
$ Democrat Amount Per Capita: $9.59
# Democrat Contributions Per Capita: 0.11
More on Dublin: PhotosData

Dublin is a suburban city of the East Bay and Tri-Valley regions of Alameda County, California, United States. Located along the north side of Interstate 580 at the intersection with Interstate 680, roughly 35 miles east of downtown San Francisco, 23 miles east of downtown Oakland, and 31 miles north of downtown San Jose, it was named after the city of Dublin in Ireland. Dublin is the second fastest-growing city in the state of California, behind only Santa Clarita. The population was 46,063, and the 2013 estimate at 49,890. Dublin is home to the headquarters of Sybase, Inc, CallidusCloud, Ross Stores, Tria Beauty, Medley Health, Challenge Dairy and Arlen Ness.

Livermore, CA

Overall SnackAbility

9
/10

Population: 88,232
Percent Democrat: 78.1%
$ Democrat Amount Per Capita: $25.6
# Democrat Contributions Per Capita: 0.17
More on Livermore: PhotosData

Livermore is a city in Alameda County, California, in the United States. With an estimated 2017 population of 89,648, Livermore is the most populous city in the Tri-Valley. Livermore is located on the eastern edge of California’s San Francisco Bay Area. The incumbent Mayor of Livermore is John Marchand, a registered Democrat.

Union City, CA

Source: Public domain
Overall SnackAbility

8.5
/10

Population: 74,354
Percent Democrat: 78.1%
$ Democrat Amount Per Capita: $11.12
# Democrat Contributions Per Capita: 0.15
More on Union City: PhotosData

Union City is a city in the San Francisco Bay Area in Alameda County, California, United States located approximately 20 miles south of Oakland, 30 miles southeast of San Francisco, and 20 miles north of San Jose. Incorporated on January 13, 1959, combining the communities of Alvarado, New Haven, and Decoto, the city has over 72,000 residents today and very diverse population. Alvarado is a California Historical Landmark. The city celebrated its 50th Anniversary in 2009. The Cities of Fremont, Newark, and Union City make up the Tri-City Area to the south. The larger City of Hayward surrounds the city to the north. The Tri-City Area hosts many local events, along with programs for the youth.

Emeryville, CA

Overall SnackAbility

8.5
/10

Population: 11,524
Percent Democrat: 78.1%
$ Democrat Amount Per Capita: $68.28
# Democrat Contributions Per Capita: 0.83
More on Emeryville: PhotosData

Emeryville is a small city located in northwest Alameda County, California, in the United States. It is located in a corridor between the cities of Berkeley and Oakland, extending to the shore of San Francisco Bay. Its proximity to San Francisco, the Bay Bridge, the University of California, Berkeley, and Silicon Valley has been a catalyst for recent economic growth.

Alameda, CA

Overall SnackAbility

9
/10

Population: 78,246
Percent Democrat: 78.1%
$ Democrat Amount Per Capita: $20.89
# Democrat Contributions Per Capita: 0.33
More on Alameda: PhotosData

Alameda is a city in Alameda County, California, United States. It is located on Alameda Island and Bay Farm Island, and is adjacent to and south of Oakland and east of San Francisco across the San Francisco Bay. Bay Farm Island, a portion of which is also known as “Harbor Bay Isle”, is not actually an island, and is part of the mainland adjacent to the Oakland International Airport. The city’s estimated 2017 population was 79,928. Alameda is a charter city, rather than a general law city, allowing the city to provide for any form of government. Alameda became a charter city and adopted a council-manager government in 1916, which it retains to the present.

Pleasanton, CA

Overall SnackAbility

10
/10

Population: 79,341
Percent Democrat: 78.1%
$ Democrat Amount Per Capita: $33.6
# Democrat Contributions Per Capita: 0.16
More on Pleasanton: PhotosData

Pleasanton is a city in Alameda County, California, incorporated in 1894. It is a suburb in the San Francisco Bay Area located about 25 miles east of Oakland, and 6 miles west of Livermore. The population was 70,285 at the 2010 census. In 2005 and 2007, Pleasanton was ranked the wealthiest middle-sized city in the United States by the Census Bureau. Pleasanton is home to the headquarters of Workday, Ellie Mae, Roche Molecular Diagnostics, Blackhawk Network Holdings, and Veeva Systems. Other major employers include Kaiser Permanente, Safeway, Oracle, Nordstrom and Macy’s. Although Oakland is the Alameda County seat, a few county offices and a courthouse are located in Pleasanton. The Alameda County Fairgrounds are located in Pleasanton, where the county fair is held during the last week of June and the first week of July. Pleasanton Ridge Regional Park is located on the west side of town.

Hayward, CA

Overall SnackAbility

8
/10

Population: 156,917
Percent Democrat: 78.1%
$ Democrat Amount Per Capita: $18.6
# Democrat Contributions Per Capita: 0.18
More on Hayward: PhotosData

Hayward is a city located in Alameda County, California in the East Bay subregion of the San Francisco Bay Area. With a 2014 population of 149,392, Hayward is the sixth largest city in the Bay Area and the third largest in Alameda County. Hayward was ranked as the 37th most populous municipality in California. It is included in the San Francisco-Oakland-Fremont Metropolitan Statistical Area by the US Census. It is located primarily between Castro Valley and Union City, and lies at the eastern terminus of the San Mateo-Hayward Bridge. The city was devastated early in its history by the 1868 Hayward earthquake. From the early 20th century until the beginning of the 1980s, Hayward’s economy was dominated by its now defunct food canning and salt production industries.

San Leandro, CA

Overall SnackAbility

8
/10

Population: 89,910
Percent Democrat: 78.1%
$ Democrat Amount Per Capita: $9.43
# Democrat Contributions Per Capita: 0.13
More on San Leandro: PhotosData

San Leandro is a suburban city in Alameda County, California, United States. It is located on the eastern shore of San Francisco Bay, between Oakland to the northwest and Hayward to the southeast.

Newark, CA

Source: Public domain
Overall SnackAbility

7.5
/10

Population: 45,554
Percent Democrat: 78.1%
$ Democrat Amount Per Capita: $3.74
# Democrat Contributions Per Capita: 0.05
More on Newark: PhotosData

Newark is a city in Alameda County, California, United States. It was incorporated as a city in September 1955. Newark is an enclave, surrounded by the city of Fremont. The three cities of Newark, Fremont, and Union City make up the “Tri-City” area. Its population was 44,205 in 2015.

Summing Up The Liberal Snowflakes in California

Well there you have it, the places in California that have the highest number of liberals per capita, with San Francisco ranking as the least conservative in the entire state.

If you’re curious, here are the least liberal cities in California:

  1. Susanville
  2. Anderson
  3. Shasta Lake

For more California reading, check out:

Detailed List Of The Most Liberal Places In California

Rank City Population % Liberal
1 San Francisco, CA 864,263 84.5%
2 Dublin, CA 57,022 78.1%
3 Livermore, CA 88,232 78.1%
4 Union City, CA 74,354 78.1%
5 Emeryville, CA 11,524 78.1%
6 Alameda, CA 78,246 78.1%
7 Pleasanton, CA 79,341 78.1%
8 Hayward, CA 156,917 78.1%
9 San Leandro, CA 89,910 78.1%
10 Newark, CA 45,554 78.1%
11 Piedmont, CA 11,296 78.1%
12 Fremont, CA 230,964 78.1%
13 Oakland, CA 417,442 78.1%
14 Berkeley, CA 120,179 78.1%
15 Albany, CA 19,682 78.1%
16 San Anselmo, CA 12,619 77.3%
17 Novato, CA 55,378 77.3%
18 Fairfax, CA 7,616 77.3%
19 Mill Valley, CA 14,392 77.3%
20 Tiburon, CA 9,205 77.3%
21 Corte Madera, CA 9,811 77.3%
22 San Rafael, CA 59,180 77.3%
23 Larkspur, CA 12,367 77.3%
24 Sausalito, CA 7,147 77.3%
25 Half Moon Bay, CA 12,565 75.7%
26 Millbrae, CA 22,738 75.7%
27 San Mateo, CA 103,500 75.7%
28 Burlingame, CA 30,401 75.7%
29 Redwood City, CA 84,368 75.7%
30 San Carlos, CA 29,954 75.7%
31 Atherton, CA 7,182 75.7%
32 Pacifica, CA 39,141 75.7%
33 Daly City, CA 106,480 75.7%
34 Menlo Park, CA 33,661 75.7%
35 Woodside, CA 5,550 75.7%
36 South San Francisco, CA 67,120 75.7%
37 East Palo Alto, CA 29,646 75.7%
38 Foster City, CA 33,529 75.7%
39 Hillsborough, CA 11,436 75.7%
40 Belmont, CA 27,110 75.7%
41 San Bruno, CA 43,105 75.7%
42 Capitola, CA 10,158 73.3%
43 Watsonville, CA 53,452 73.3%
44 Santa Cruz, CA 63,993 73.3%
45 Scotts Valley, CA 11,892 73.3%
46 Gilroy, CA 54,159 72.7%
47 Cupertino, CA 60,687 72.7%
48 Morgan Hill, CA 43,136 72.7%
49 Los Altos, CA 30,527 72.7%
50 San Jose, CA 1,023,031 72.7%
51 Los Altos Hills, CA 8,490 72.7%
52 Sunnyvale, CA 151,565 72.7%
53 Mountain View, CA 80,076 72.7%
54 Milpitas, CA 75,498 72.7%
55 Campbell, CA 41,164 72.7%
56 Santa Clara, CA 124,635 72.7%
57 Saratoga, CA 31,013 72.7%
58 Los Gatos, CA 30,709 72.7%
59 Palo Alto, CA 67,082 72.7%
60 Lomita, CA 20,707 71.8%
61 Los Angeles, CA 3,949,776 71.8%
62 Downey, CA 113,358 71.8%
63 Azusa, CA 49,029 71.8%
64 Santa Fe Springs, CA 17,669 71.8%
65 Lynwood, CA 71,350 71.8%
66 Hermosa Beach, CA 19,750 71.8%
67 Covina, CA 48,601 71.8%
68 Baldwin Park, CA 76,572 71.8%
69 Hawthorne, CA 87,425 71.8%
70 Signal Hill, CA 11,508 71.8%
71 Monrovia, CA 37,138 71.8%
72 South Gate, CA 95,420 71.8%
73 San Marino, CA 13,331 71.8%
74 Palos Verdes Estates, CA 13,591 71.8%
75 Bell, CA 35,942 71.8%
76 Temple City, CA 36,214 71.8%
77 San Gabriel, CA 40,315 71.8%
78 Lawndale, CA 33,191 71.8%
79 Alhambra, CA 85,168 71.8%
80 Compton, CA 97,847 71.8%
81 Montebello, CA 63,468 71.8%
82 Palmdale, CA 157,358 71.8%
83 Cudahy, CA 24,146 71.8%
84 Rosemead, CA 54,615 71.8%
85 South El Monte, CA 20,712 71.8%
86 Inglewood, CA 111,006 71.8%
87 La Puente, CA 40,451 71.8%
88 San Fernando, CA 24,581 71.8%
89 Pomona, CA 152,366 71.8%
90 Rolling Hills Estates, CA 8,229 71.8%
91 Paramount, CA 55,020 71.8%
92 El Monte, CA 115,958 71.8%
93 Pico Rivera, CA 63,750 71.8%
94 Bellflower, CA 77,852 71.8%
95 Hawaiian Gardens, CA 14,465 71.8%
96 Bell Gardens, CA 42,845 71.8%
97 Monterey Park, CA 61,056 71.8%
98 La Verne, CA 32,320 71.8%
99 Whittier, CA 86,852 71.8%
100 Lancaster, CA 160,113 71.8%